


Man AHL’s trend fund gets paid by a bond selloff only once the selloff becomes a trend. In 2026’s first half its bond and rate futures lost $1.05m while the fund still made money. With the 10-year Treasury yield at its highest since 2002 this month, anyone holding trend funds as a hedge against a bond rout needs to know when that hedge pays. I read the program’s SEC filings and Man’s own monthly reports against Treasury’s yield curve.
The coverage credits the bond selloff. On 2 October, Hedgeweek relayed an FT report that “Computer-driven funds that seek persistent market trends have built sizeable positions against fixed income”. By that account Graham’s Tactical Trend fund was up more than 31% this year, Winton’s Diversified Macro 17.5% through late September and Aspect’s flagship about 21%, according to people familiar. The same report noted that the managers’ returns “have not been driven solely by government bond positions”. Treasury’s par curve, its daily yield for a notional bond priced at par at each exact maturity, had the 10-year at 5.31% on 5 October. On 5 October I worked through where AQR’s own trend rule turns its Treasury short off. This piece asks what the bond trade has actually paid.
Man AHL’s own records describe a different first half. The fund made 11.86% for its SEC feeder’s investors, yet its bond and rate futures lost money through June, in the filing’s dollars and in Man’s own monthly figures, while currencies, stock indices and energy made the return. In July and August, with the fund already short as yields rose, bonds and rates paid. Trend following is a rule that loses small and often and is paid by whichever markets keep moving; in bonds, the paying started only once the selloff had become a trend. Call it no trend, no pay. The turn that starts a trend costs first.
Three of Man’s funds appear below, each named once here. The SEC feeder is Man-AHL Diversified I LP, $64.4m at 30 June; its 11.86% is the return on its Class A Series 1 units after costs. The trading company is the master fund it invests in, Man-AHL Diversified Trading Company L.P., about $145m, whose accounts sit inside the feeder’s 10-Q with gains and losses by sector. The $1.05m is the trading company’s loss on interest rate futures, a line that holds both government bond and short rate futures. The flagship is Man AHL Diversified, a fund of about $313m that Man runs on the same AHL Diversified Programme and reports on monthly. I profiled the firm in December; here I take its trend machine apart.
If you hold a trend allocation as protection against falling bond prices, the first half says it pays on a selloff that has become a trend, and that it can lose at the turn that starts one.
AHL’s machine, in its own words
AHL’s 2022 annual report describes the program without decoration. It is “designed in the anticipation that most of its trades will be unprofitable; the objective of overall profitability depends on the system identifying certain major trends which occur and recognizing significant profits from participating in such trends”. The same section adds that “in trendless or stagnant markets, the AHL Diversified Program is unlikely to be profitable”.
In plain terms, AHL expects to be wrong on most trades and right, by a lot, on a few. The losses are the cost of being in position when a big move starts.
The 2026 10-Q adds the second half of the design. “All of the strategies and systems of the AHL Diversified Program are designed to target defined volatility levels rather than returns.” The program chooses how much risk to run. It doesn’t choose how much to make.
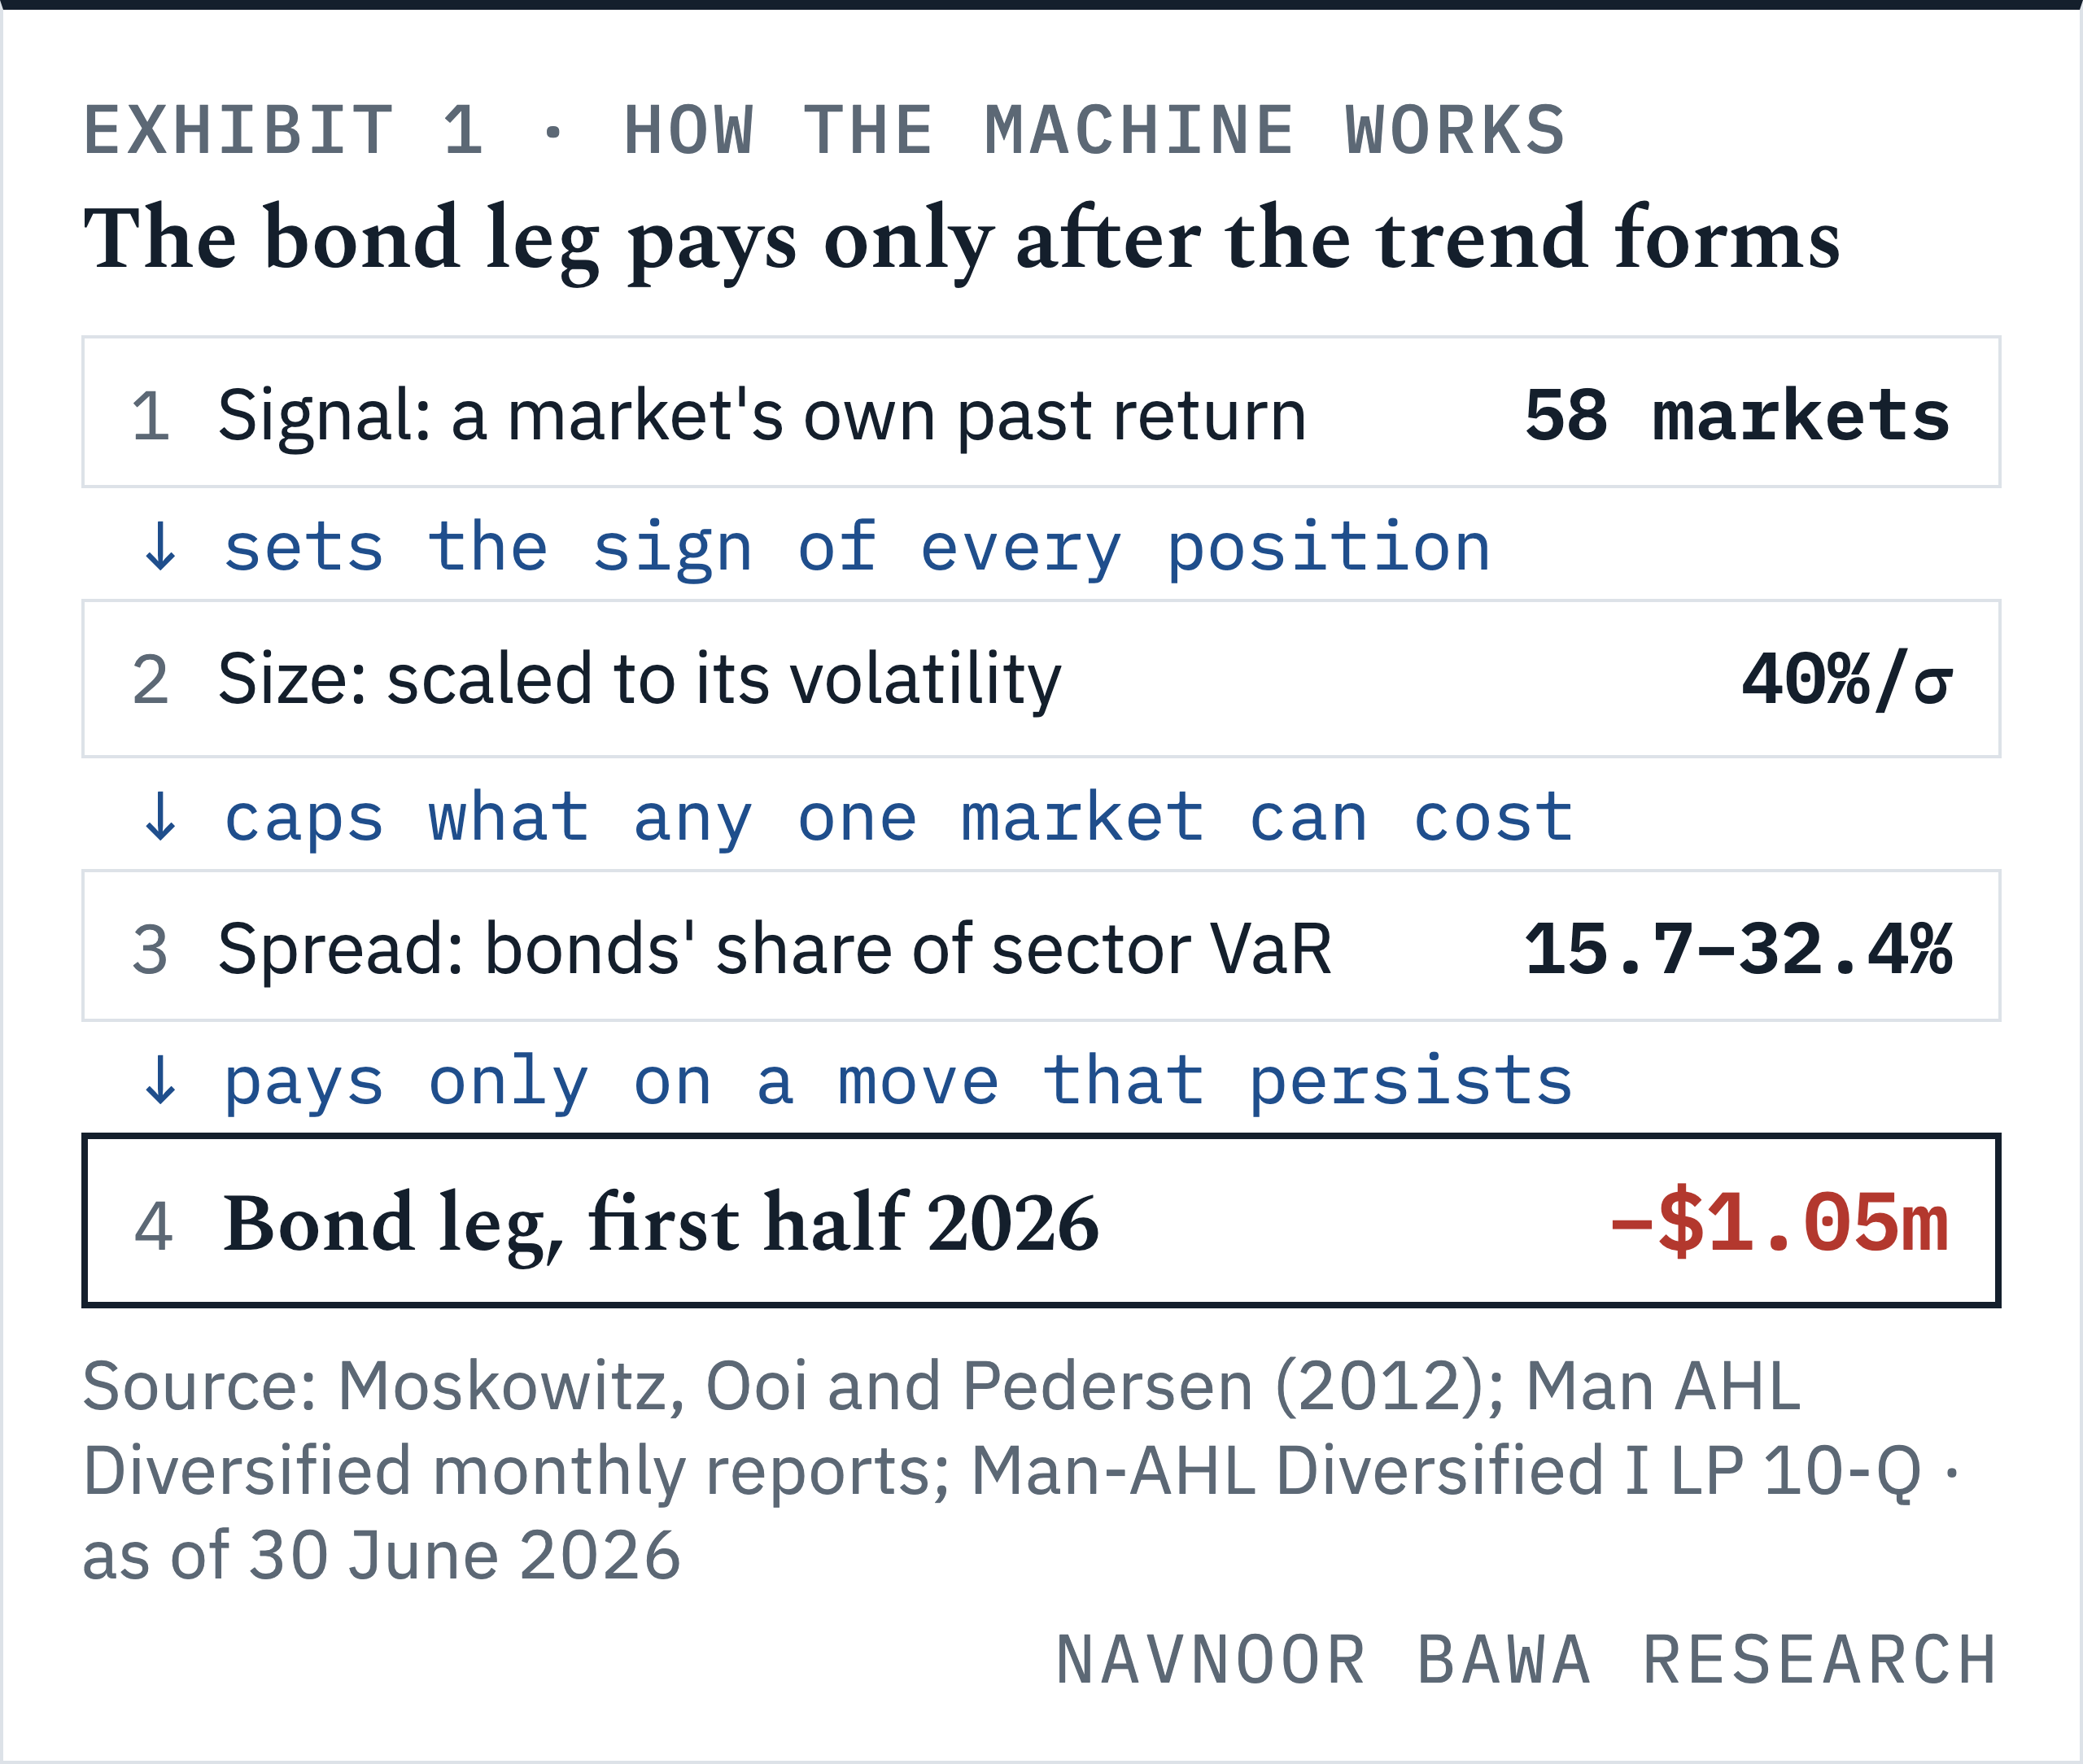
The filing describes the machine in words. The tested public version comes from researchers at AQR, and it has three parts: a signal, a size and a spread across markets.
The signal is each market’s own past
Time series momentum is the rule that a market’s own recent return decides whether you are long or short it. Stock pickers’ momentum ranks one stock against another; here each market is judged only against its own history.
A 2012 study of 58 futures markets by Moskowitz, Ooi and Pedersen found that a market’s past 12-month excess return, its return above cash, predicted its next month’s. It held “for every asset contract we examine (58 in total)”. A market that had gone up tended to keep going up for a while, and a falling one kept falling.
Why trends exist at all is the question a sceptic should ask first. The study reads its result as “consistent with sentiment theories of initial under-reaction and delayed over-reaction”. In the CFTC’s positioning data it found that “speculators profit from time series momentum at the expense of hedgers”. A 2017 AQR study adds a reason that matters for bonds: “when central banks intervene to reduce currency and interest rate volatility, they may slow down the rate at which information is incorporated into prices, thus creating trends.” A central bank that moves rates in announced steps is close to a trend generator for its own bond market. That study’s version of the rule blends 1-, 3- and 12-month signals with equal weight across 67 markets, 15 of them bond markets, and rebalances monthly.
Now apply it to bonds. A bond future’s price rises when yields fall, so a falling 10-year yield turns the signal long, and a rising yield turns it short. The rule doesn’t ask what the Fed will do next. It asks only which way the price has gone over the lookback.
That has one consequence for a selloff. The signal can only go short after yields have risen long enough to show up in the lookback. With a 1-month signal in the blend the lag is weeks, not months, but it is always there.
Positions sized to a volatility target
The second part is size, and it is where “defined volatility levels” comes from. The 2012 study sets each market’s position to 40%/σ. Here σ is the market’s ex ante volatility, a forecast of its annualized volatility made before the trade. The study builds it from an exponentially weighted average of past squared daily returns with a centre of mass of 60 days, a weighting that gives each new day about a sixtieth of the weight. AHL doesn’t publish its own estimator; these are the study’s choices.
Plug in two markets. Say one has a σ of 10%, so it gets 40/10 = 4 times capital in exposure. Say another has 20%, so it gets 40/20 = 2. The quieter market gets the bigger position, so each contributes about the same risk. The 2017 study then scales the whole book to a 10% annualized volatility target.
So a calm bond market can carry a large position. When bonds start to swing, σ rises and the position shrinks, whatever the signal says. The size is set by how noisy the market is, never by a view on yields.
Bonds carry a sixth to a third of the risk
Man’s monthly reports put bonds and rates at between a sixth and a third of the fund’s risk at each 2026 month end, which is the third part of the machine: the spread across markets. Each gives a 99% value at risk (VaR) by sector, a statistical estimate of a loss the positions should exceed with 1% probability; the report doesn’t state the holding period. The feeder’s 10-Q prints a table it also calls VaR, but by its own words it uses “exchange initial margin requirements” as the measure, so I use Man’s figures.
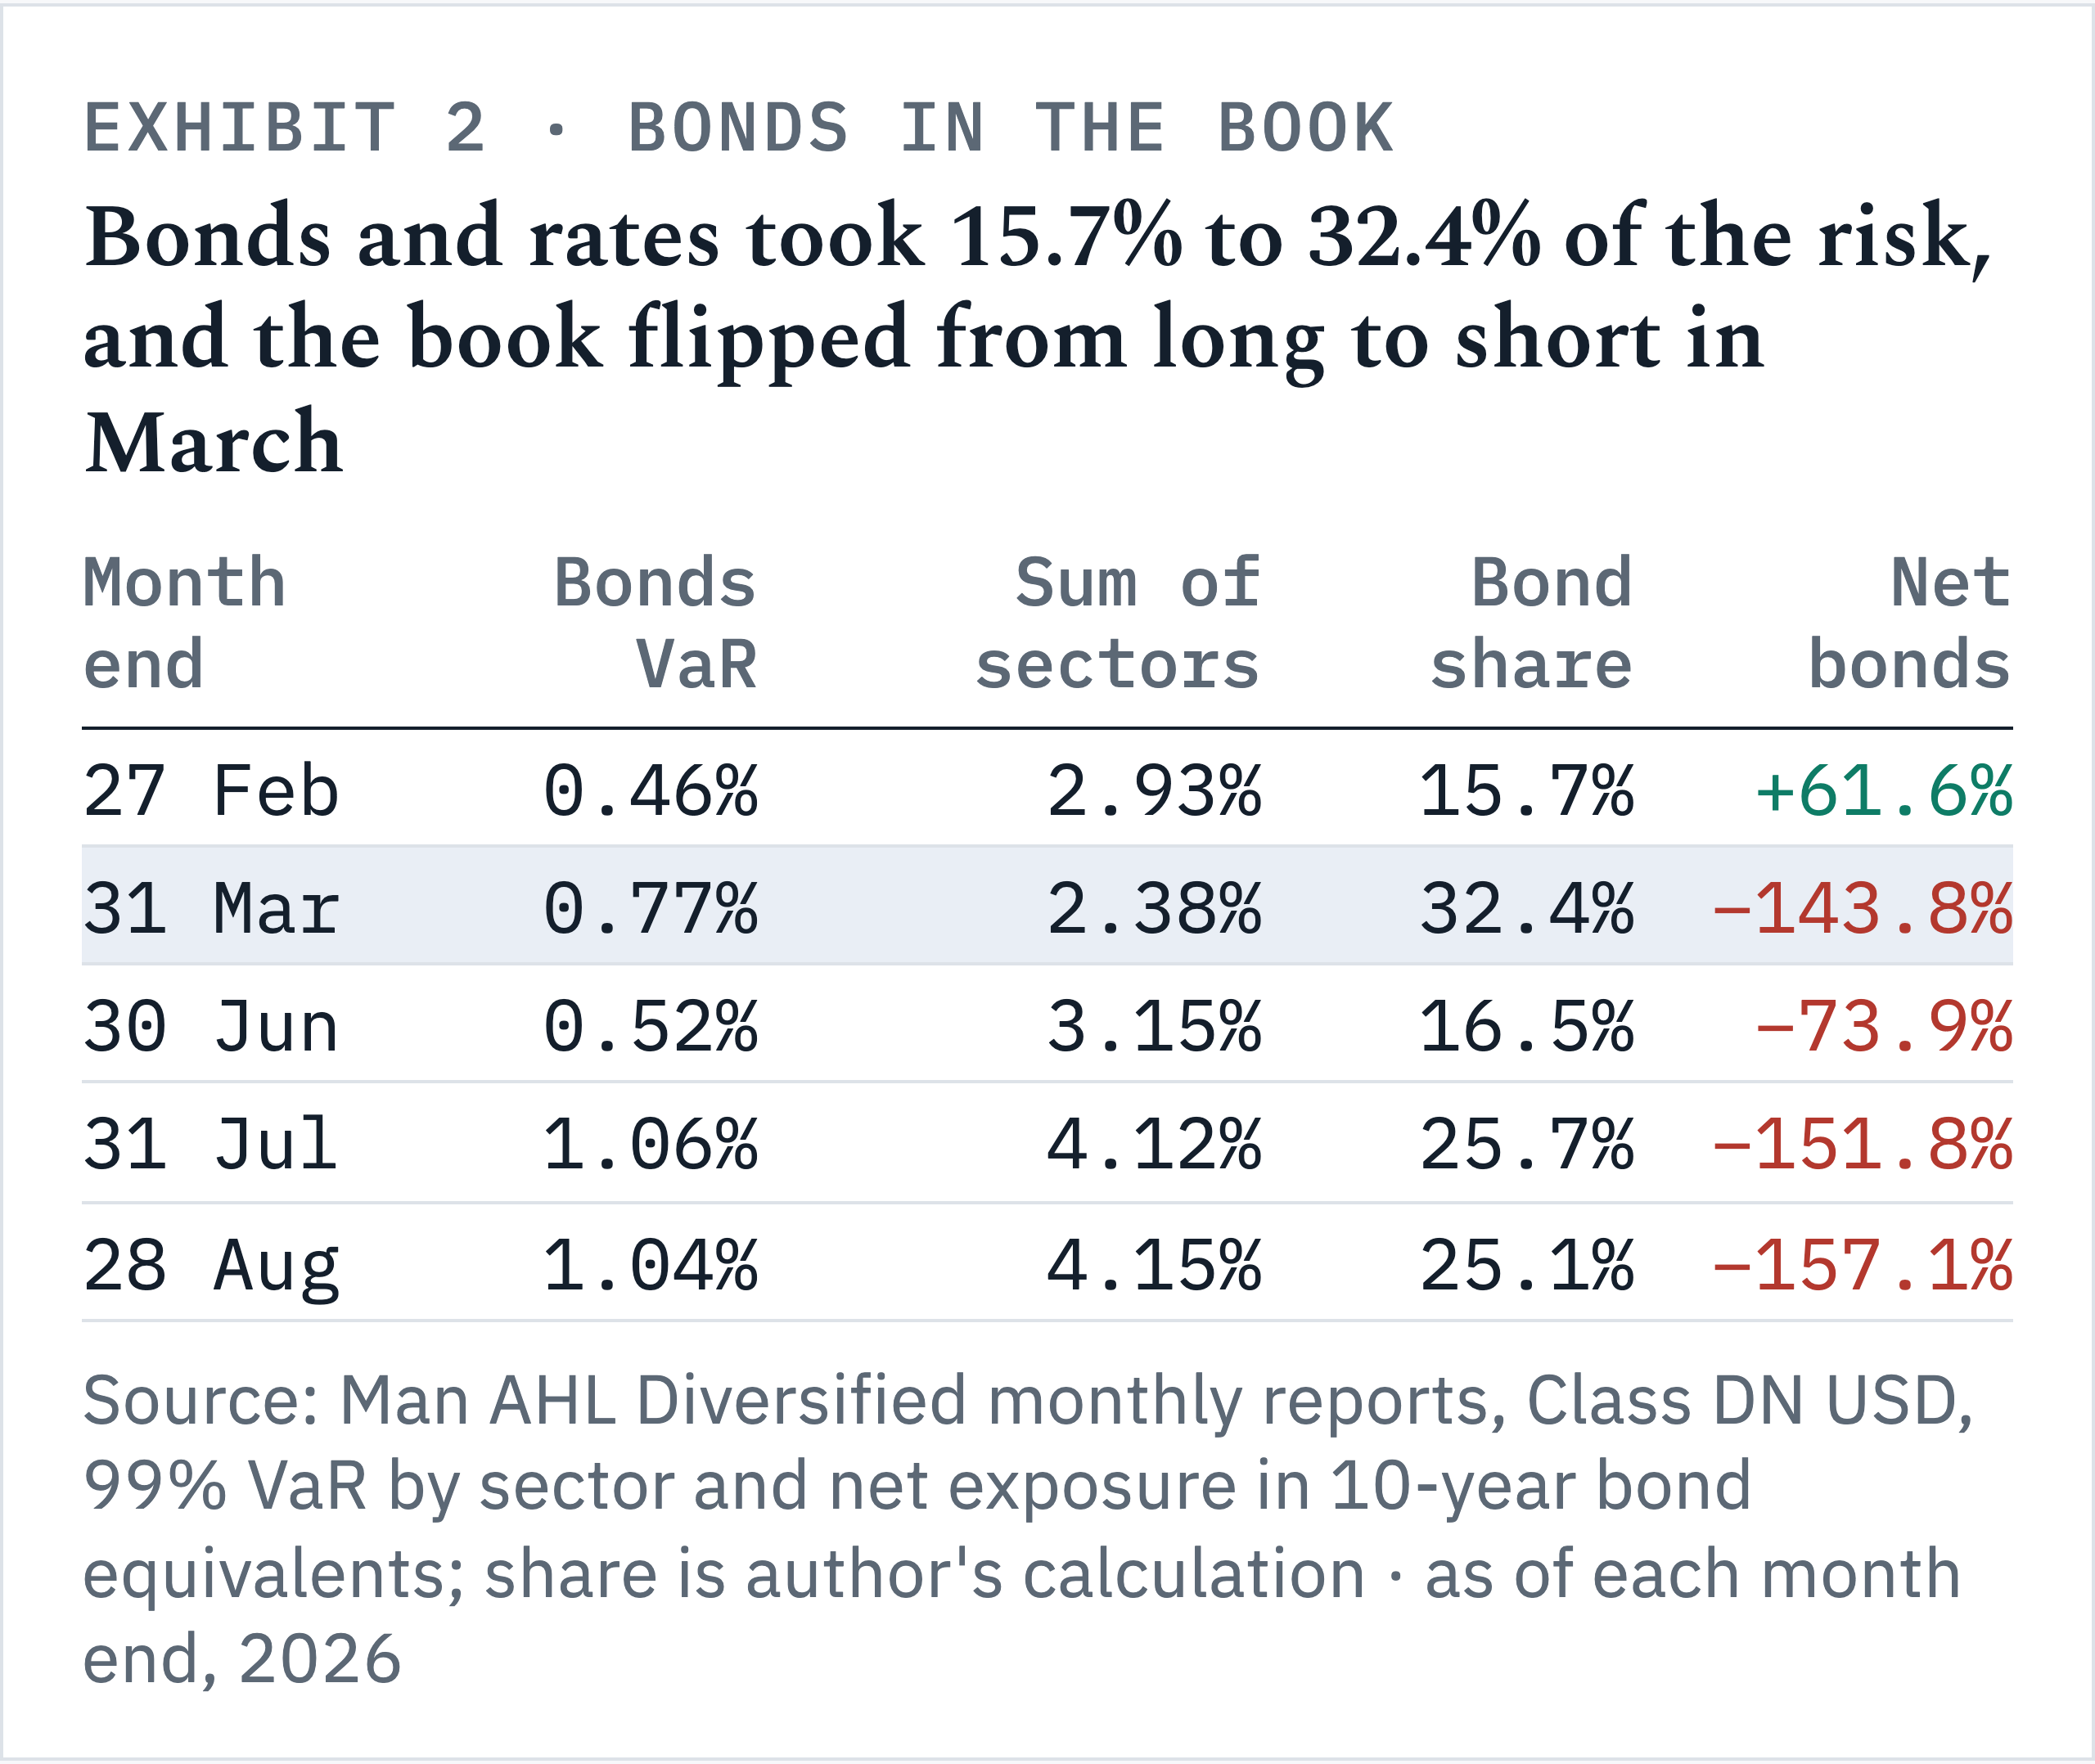
Source: the flagship’s monthly reports for February, March, June, July and August 2026, Class DN USD. Man reports five sectors (bonds and rates, commodities, credit, currencies, stocks); the sum adds them with no credit for diversification, and the shares are my arithmetic. Net exposure is the positions’ notional value as a share of the fund’s capital, with bond positions restated as 10-year bond equivalents.
A large part of the book, then, never the whole of it. The last column is the turn in one line. At the end of February the fund was long bonds worth 61.6% of its capital in 10-year terms; a month later it was 143.8% short.
The payoff looks like a straddle
The 2012 study found that trend following’s returns look “similar to an option straddle on the market”. A straddle is a call and a put at the same strike. Its owner pays a premium up front and makes money only on a large move, in either direction.
AHL’s line that most trades “will be unprofitable” is the premium. Each trend that fails costs a small loss, kept small by the volatility target. Each one that runs pays for many failures.
The analogy breaks in one place. A straddle’s premium is known the day you buy it. A trend follower’s isn’t, and a trend that reverses in a few sessions can cost far more than the small, steady bleed the design expects.
Long into March, short by April
The flagship was long bonds when this year’s selloff began, and the worked case starts at that turn. The 10-year par yield fell from 4.18% at the end of 2025 to 3.97% on 27 February, 21 basis points over January and February (a basis point is a hundredth of a percentage point). Falling yields mean rising bond prices, and the flagship went from 114.1% net short at the end of January to 61.6% net long at the end of February.
Then the market turned. The 10-year rose 33bp to 4.30% by 31 March. The feeder’s first quarter 10-Q reads: “Fixed income trading proved challenging, as long bond positions detracted amid rising yields.” Positions in Italian, Canadian and French rates were among the worst; shorts in German, Australian and Korean bonds offset part of it. Man put the month’s bonds and rates contribution at −1.50%.
That is the cost the program describes in advance. The signal was long because prices had risen, and prices fell before the lookback caught up.
It flipped fast. By the end of March the flagship was 143.8% net short, and in April the second quarter 10-Q says “Fixed income trading contributed to gains, led by short ten-year Japanese Government Bond positions.” Then the trend stalled. The 10-year rose 10bp in April and 5bp in May, and slipped 1bp in June, while Australian, European and Korean bonds rallied against the book’s shorts.
Meanwhile the fund still made money. The Class A Series 1 units returned 8.39% after fees in the first quarter and 3.20% in the second. Compounded, that is the half’s 11.86%.
Currencies and stocks paid the first half
Currencies, stock indices and energy paid for the first half, and the trading company’s own table shows it: the 10-Q’s notes give gains and losses by sector, realized and unrealized, and I added the two for each sector.
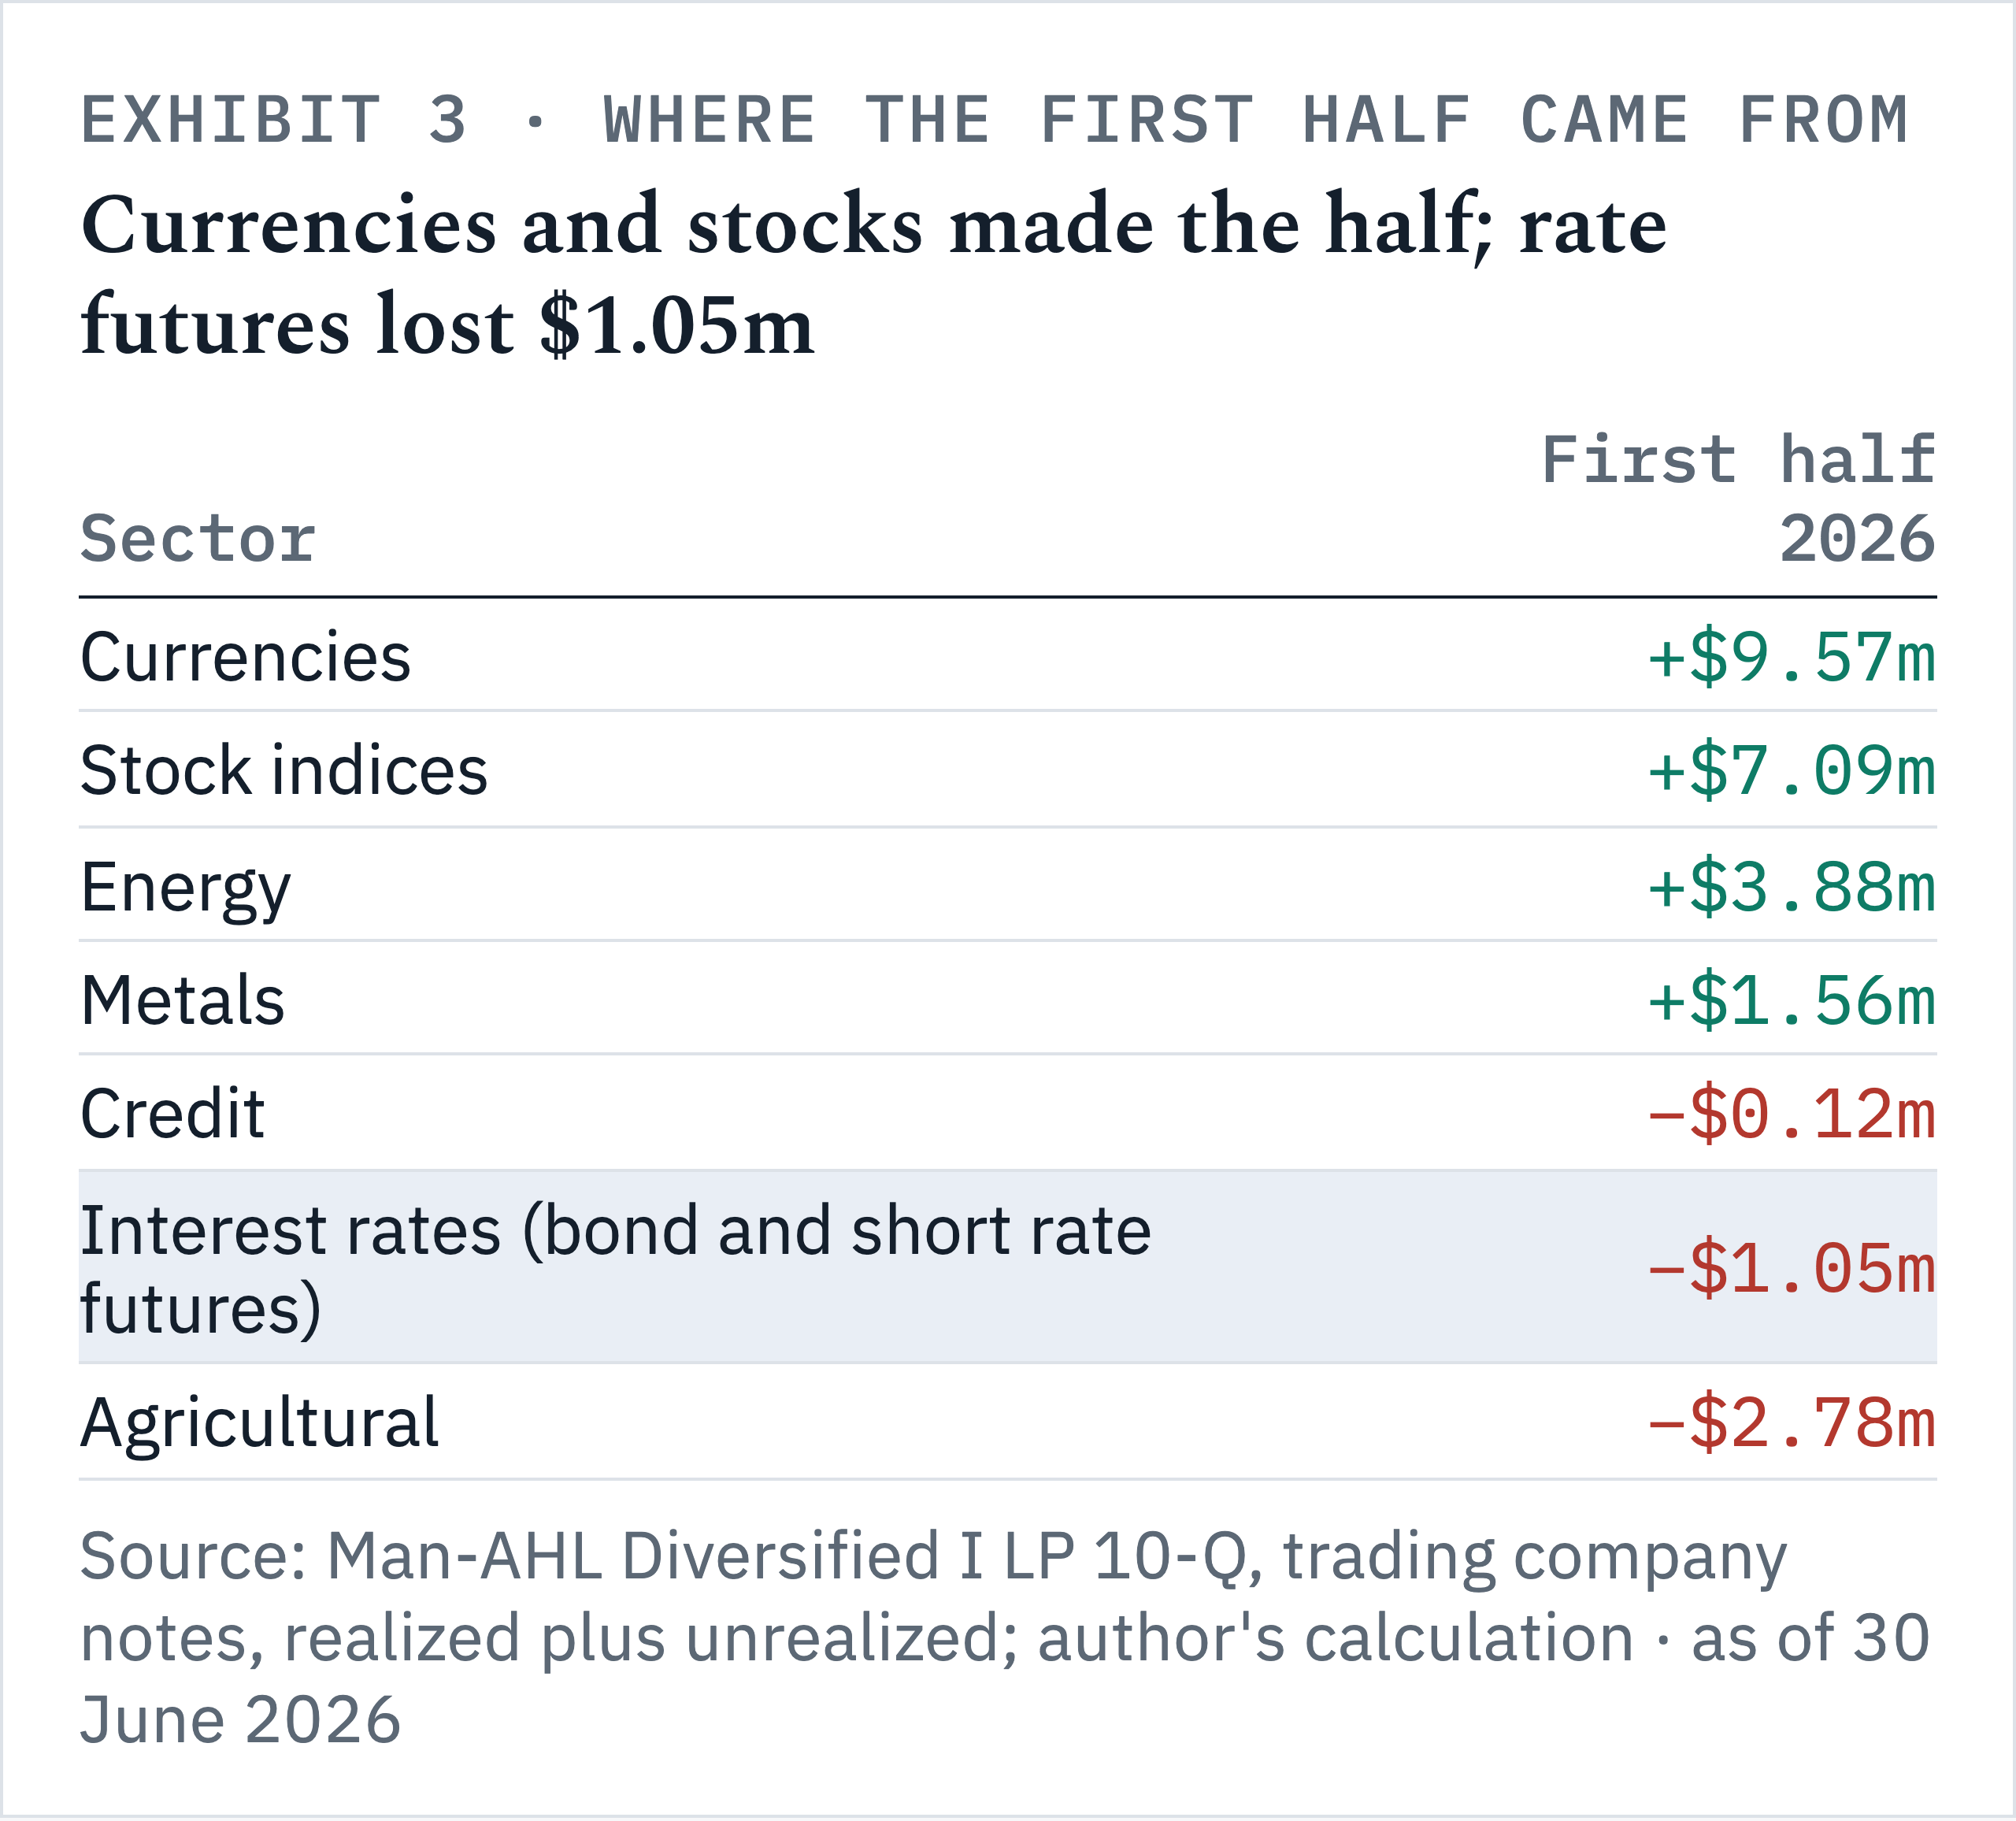
Source: Man-AHL Diversified I LP 10-Q, quarter ended 30 June 2026, notes to the trading company’s statements; forwards and futures combined, excluding currency translation and spot contracts. The trading company reported a total trading gain of $17.93m for the half.
Interest rate futures lost $0.72m in the first quarter and $0.33m in the second. On the trading company’s $145m that is about 0.7% of capital, and the rest of the book paid for it many times over.
The feeder’s share of the trading company’s gains was $8.07m of the $17.93m, about 45%. Fees and other expenses took $1.90m, an annualized 5.77% for the Class A Series 1 units, and interest on its cash added back $1.18m. That leaves $7.36m, about 11.4% of its average capital of $64.8m.
The flagship tells the same story at a different size. Its bonds and rates lost 2.48% gross over the half, in four losing months out of six. It is a different fund run at different risk, so I compare the direction of the two, never the size.
So through June, the bond short the coverage credits was a cost. Currencies, stock indices and energy carried the half.
The rule you can check in advance
The fund’s net bond position going into a month, set against that month’s yield move, called the bond leg’s sign in two of 2026’s three big months. A rule fitted after the outcome can explain any quarter; this one can be checked before the month starts, because Man’s report gives the fund’s net bond exposure at each month end. Going into a month, which way is the book facing, and which way do yields move?
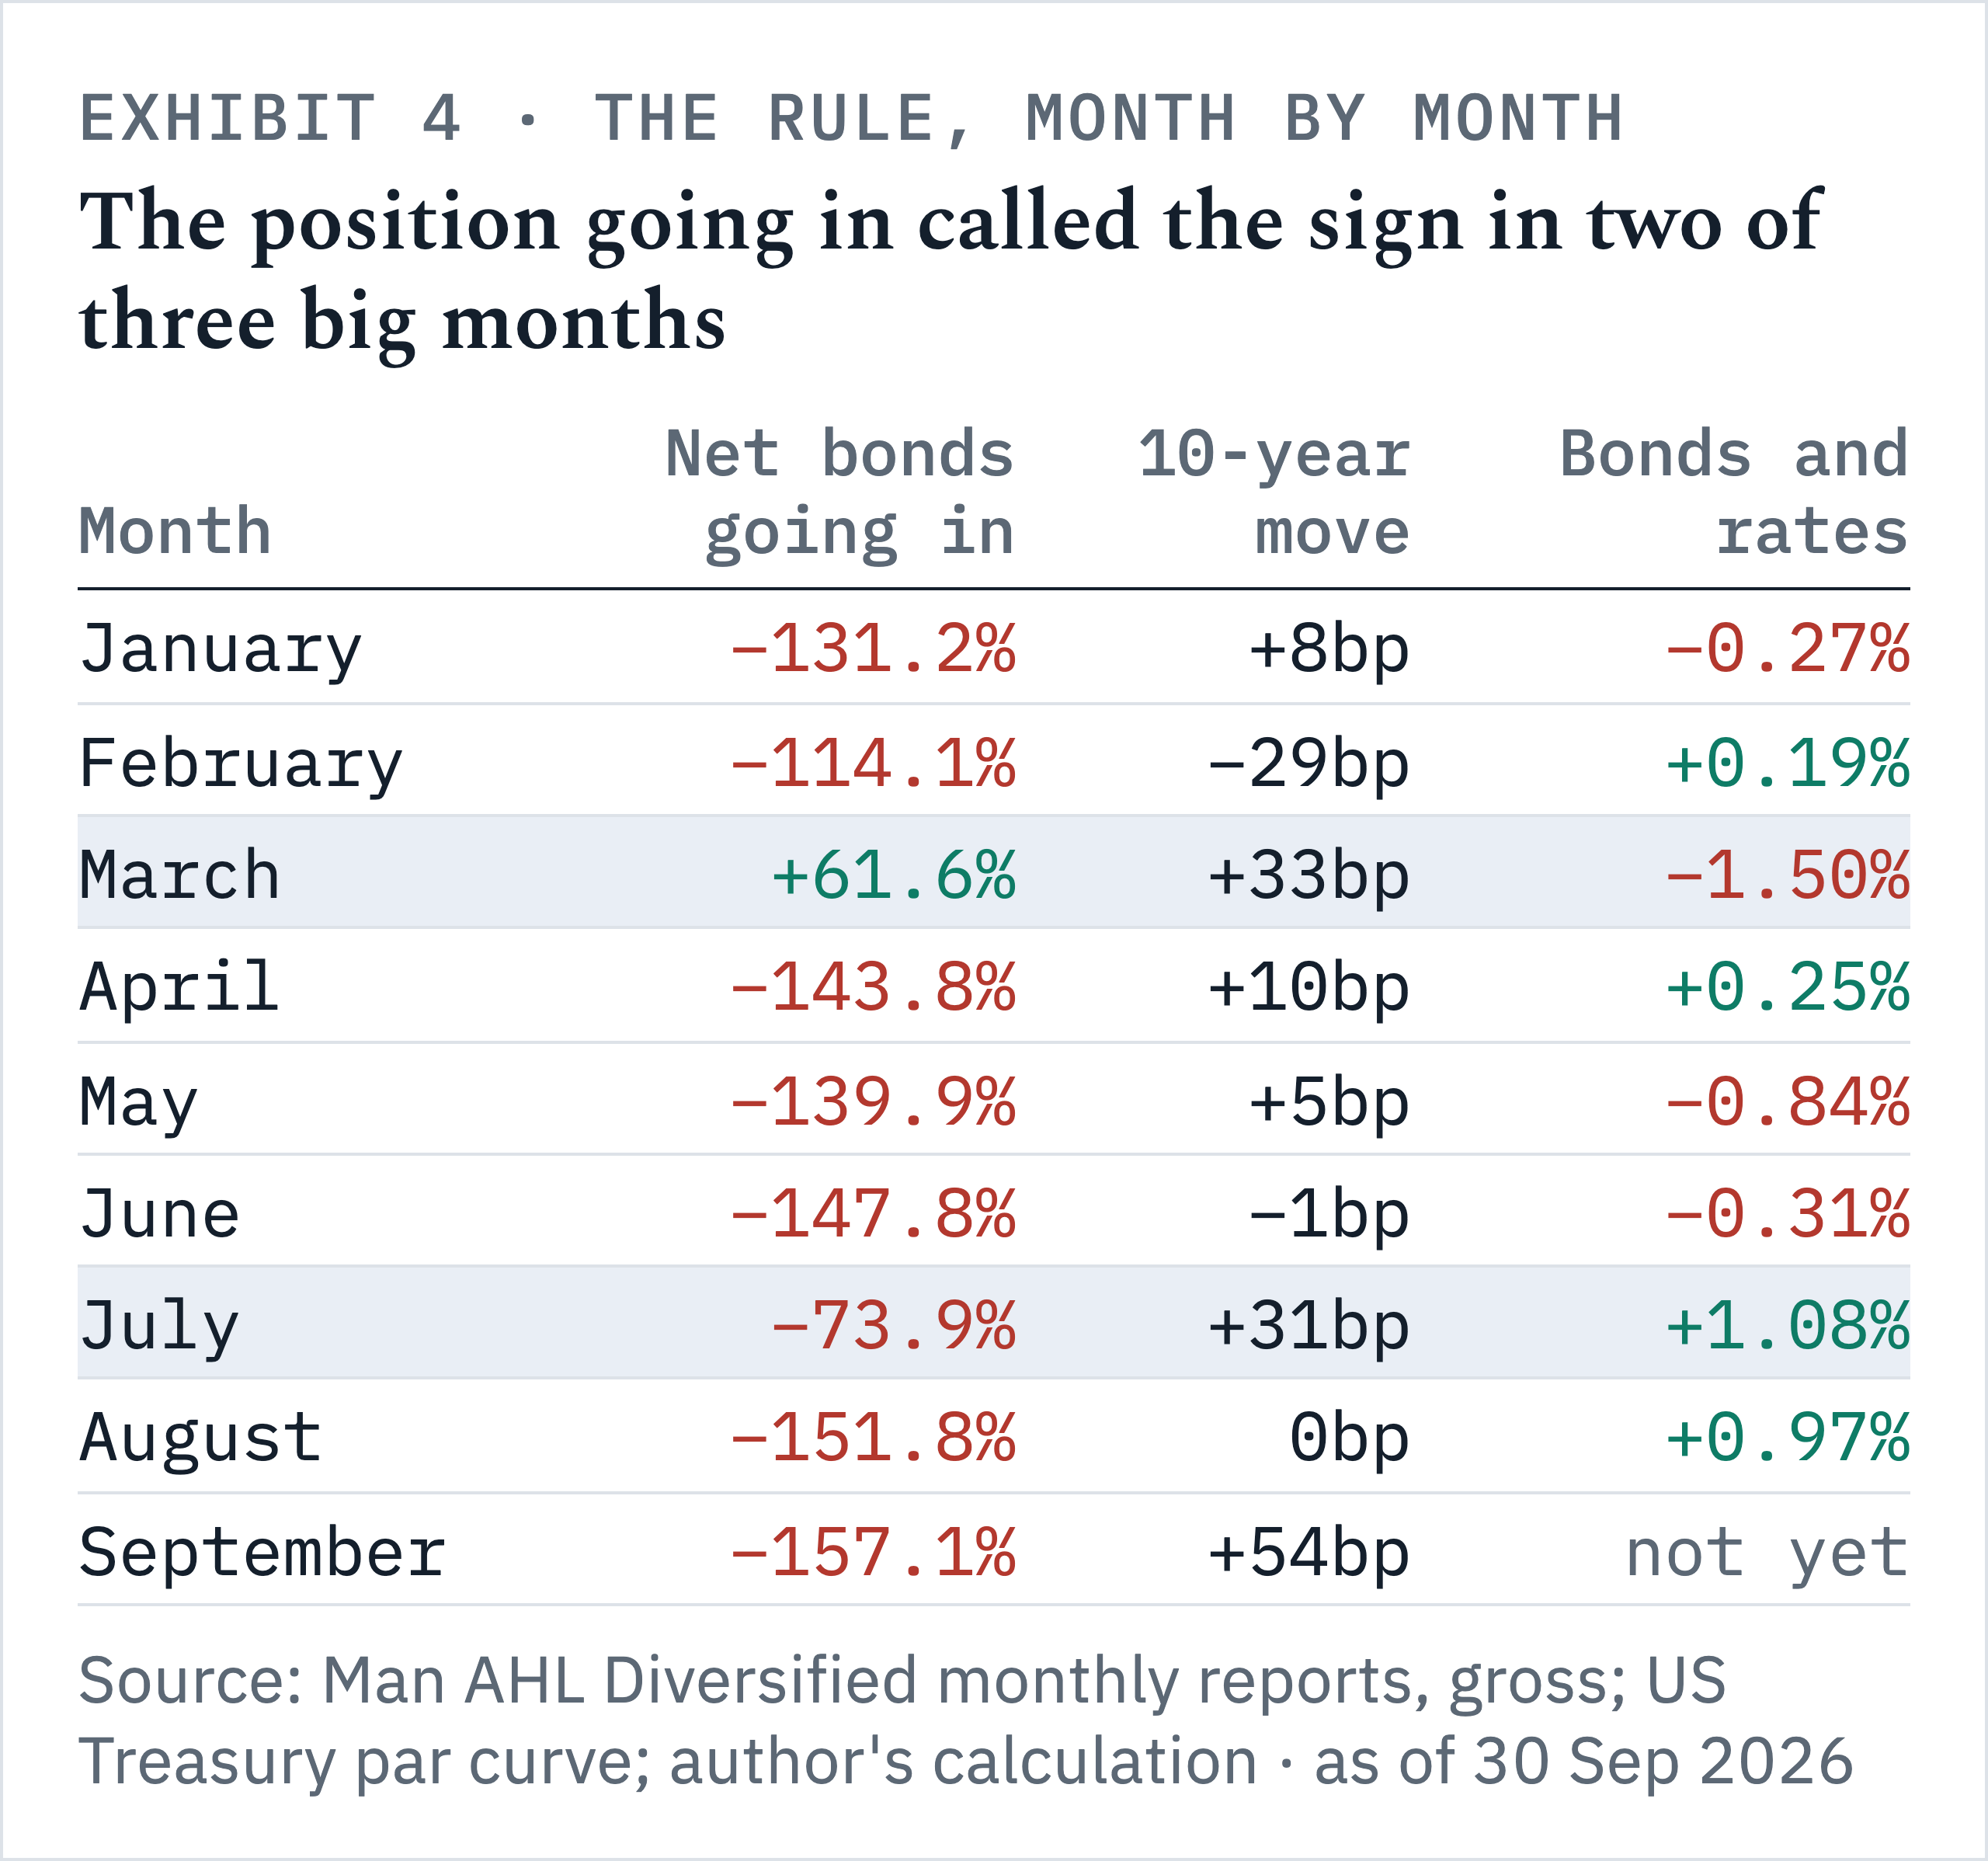
Sources: the flagship’s monthly reports, December 2025 to August 2026, gross contribution; exposure is the prior month end’s; Treasury par curve month ends, my arithmetic.
In the five months the 10-year moved less than 25bp, the bond leg’s results net to about −0.2%. That is noise. In the three months it moved 25bp or more, the position going in called the sign twice. March, long into a 33bp selloff, cost 1.50%. July, short into a 31bp selloff, made 1.08%.
February broke the rule. The book went into a 29bp rally net short and still made 0.19%, because, in the first quarter 10-Q’s words, “Long SONIA and SOFR positions generated profits in rates trading”. SONIA and SOFR are the overnight sterling and dollar rates, and futures on them made money while the bond shorts lost. The US 10-year is my yardstick, not the book, which trades Japanese, Australian, European and Korean bonds as much as American ones.
The trading company’s longer record says the same thing in dollars, with a denominator.
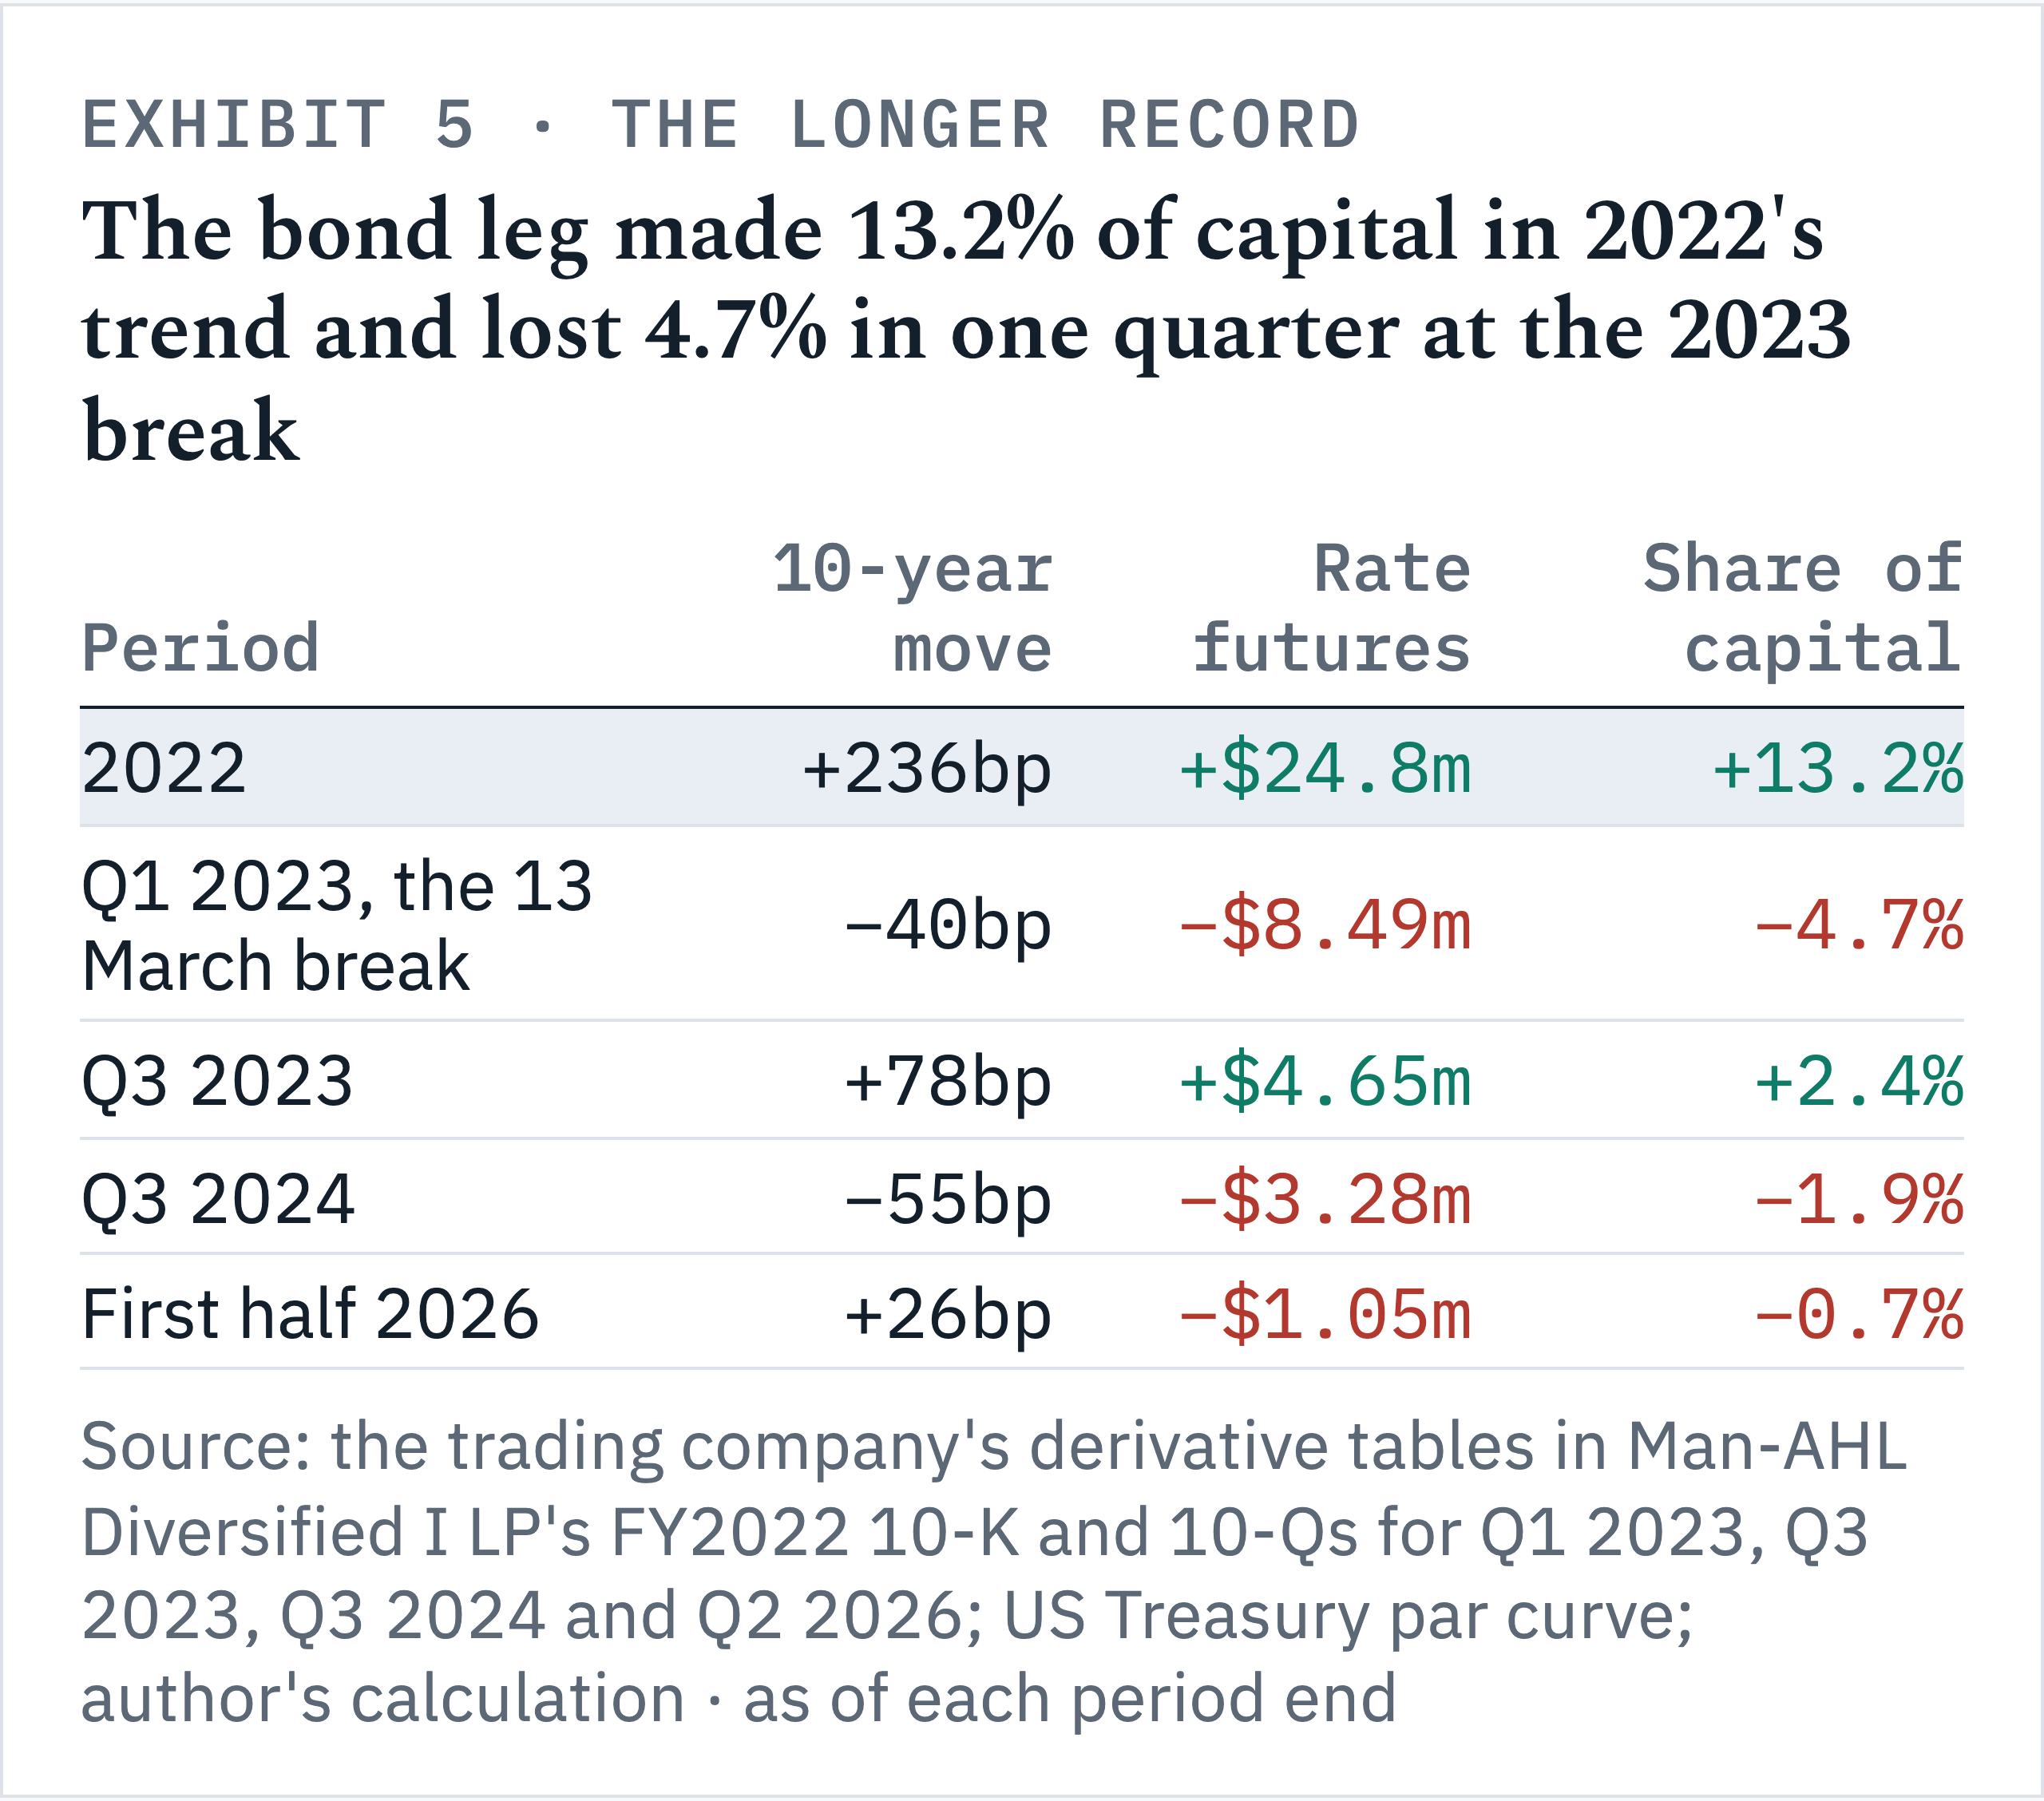
Sources: the trading company’s derivative tables in the FY2022 10-K, the first quarter 2023 10-Q, the third quarter 2023 10-Q, the third quarter 2024 10-Q and the second quarter 2026 10-Q, realized plus unrealized; share of the limited partners’ capital at the period’s end ($188.0m, $182.2m, $194.9m, $172.0m, $145.0m); Treasury par curve. My arithmetic.
In 2022 the bond leg was the year. The 10-year rose from 1.52% to 3.88% and the units returned 14.63%. Interest rate futures made $24.8m of the trading company’s $29.7m of net gains on derivatives, about 84%. Sized against the yield move, the two trend periods paid roughly 3% to 6% of capital per 100bp. In the third quarter of 2024 the 10-year fell 55bp, every month, and the bond leg still lost 1.9%, because the book came into the rally short. The 10-Q says fixed income lost in July, was flat in August, and that in September “The Partnership’s transition to long fixed income over the quarter was rewarded”. That is the lag, with a price on it.
Where the machine breaks: 13 March 2023
A trend follower’s worst day is a trend that reverses at once. AHL’s own record has one. Its first quarter 2023 10-Q reads: “A decline of 61bp on 13th of March for US 2-year Treasury yields was the largest decline in over 40 years, was against the prevailing price trend, and was detrimental to a short in the instrument and indeed all other tenors of US treasuries traded by the Partnership.”
The 61bp is AHL’s market figure. Treasury’s par curve, which marks a constant 2 year maturity, shows 57bp, from 4.60% on 10 March to 4.03% on 13 March. Over three sessions from 8 March the fall was 102bp. The trading company’s interest rate futures lost $8.49m that quarter. The units lost 5.60% in the quarter and finished 2023 down 4.57%.
The rule had done what it was built to do, short a market that had been falling, and the market reversed faster than a volatility target can shrink a position. I read the mechanics this way. AHL doesn’t publish its estimator, but in the 2012 study’s version σ moves slowly by construction: each new day carries about a sixtieth of the weight, so three sessions barely move it before the damage is done. The volatility target protects against a market that gets noisier over weeks. It has no answer to a few sessions.
The 2012 study found the same shape in 2009, when trend following took “sharp losses when the crisis ends in March, April, and May”. Between the big years the units’ returns were thin: 1.09% in 2024, and 5.45% in 2025 after a 14.52% loss in its first half, per the 2025 annual report and the 2026 10-Q.
September 2026 is the test
September is the month the rule has to get right, because July to September supplied the trend the first half lacked. The 10-year rose 85bp, from 4.44% on 30 June to 5.29% on 30 September, 54bp of it in September. Man’s reports already show the bond leg collecting: bonds and rates added 1.08% in July and 0.97% in August, and the flagship went into September 157.1% net short. On my reading of the table above, September should pay.
This is wrong if Man AHL Diversified’s monthly report for September 2026, published in October 2026, shows bonds and rates with a negative contribution for the month. In 2026 that line was crossed in four of eight months, but never in a month when the 10-year moved 25bp or more in the direction the book already faced. There has been one such month, July, so the evidence is thin. The filing check follows: the feeder’s 10-Q for the quarter ended 30 September 2026, due on EDGAR by 16 November 2026, carries the trading company’s interest rate futures line for the quarter.
On the day each lands, you can check it yourself. The flagship’s report prints the month’s bonds and rates contribution. On EDGAR, search CIK 1052354 and open the 10-Q; in the notes, find the trading company’s table of gains and losses on derivatives and add the realized and unrealized lines for “Interest rates”.
A few limits sit under all of this. The 10-Q gives sector dollars only by quarter, its monthly paragraphs are the fund’s own account in a filing it is required to make, and its statements are unaudited. The flagship’s monthly figures are gross, before fees, for a larger fund than the SEC feeder. The 2017 study’s century of results, positive before costs in every decade from 1880 to 2016, is a backtest of the published rule that no fund traded for most of that span.
The open question is the turn. The flagship is short 157.1% in 10-year terms, and the next reversal will cost before the lookback catches it; how much depends on how fast it comes. Trends pay over months. Reversals collect in days.
Further reading
AQR’s Managed Futures Fund Bet Against Treasuries. AQR’s Own Trend Rule Says When It Stops: the same trend rule run tenor by tenor on the Treasury curve, with the yields at which it flips
Inside the $168B Systematic Fund Making Money While Others Lose (Man AHL): the firm and the research process behind this machine
The $5.6 Billion Unwind: How Trump’s Tariff Shock Broke the Quant Machine: what a fast reversal does to systematic books, from April 2025
Next Monday: a named fund’s bet, read from its own filing, with the position.
→ Man AHL’s 2022 bond rout, rebuilt quarter by quarter from its filings on Patreon, open to everyone.
Navnoor Bawa · YouTube · LinkedIn · Patreon
Logo: Man Group plc