


When market correlations shatter and trends reverse violently, even the world’s most sophisticated algorithms can’t escape the physics of position unwinding.
On April 17, 2025, Man Group — the world’s largest publicly traded hedge fund — reported a startling reality: assets under management dropped from $172.6 billion on March 31 to $167.0 billion as of April 14, 2025. A $5.6 billion hemorrhage in 14 days, and the unfolding is a lesson in what happens when large-scale systematic strategies confront a regime-shifting policy shock.
This was not a garden-variety drawdown. It exposed structural vulnerabilities in momentum-driven systems: signal lag, crowding, market-impact feedback, and the failure of standard diversification assumptions under extreme political volatility.
Four Funds, One Shock
The losses concentrated in Man Group’s AHL suite. According to the firm’s Q1 2025 trading statement, the quarter had already been difficult:
AHL Diversified: -7.9% for Q1 2025
AHL Alpha: -4.5% for Q1 2025
AHL Evolution: -4.6% for Q1 2025
AHL Dimension: -2.1% for Q1 2025
But April accelerated the damage. Bloomberg reported that Man Group’s main computer-driven funds lost as much as 7.8% through April 9, with AHL Diversified suffering the largest hits. Over the 12 months to March 31, 2025, AHL Diversified was down -18.4% — a stark reminder that long drawdowns can compound rapidly when markets re-price risk and liquidity simultaneously.
The Trigger: “Liberation Day”
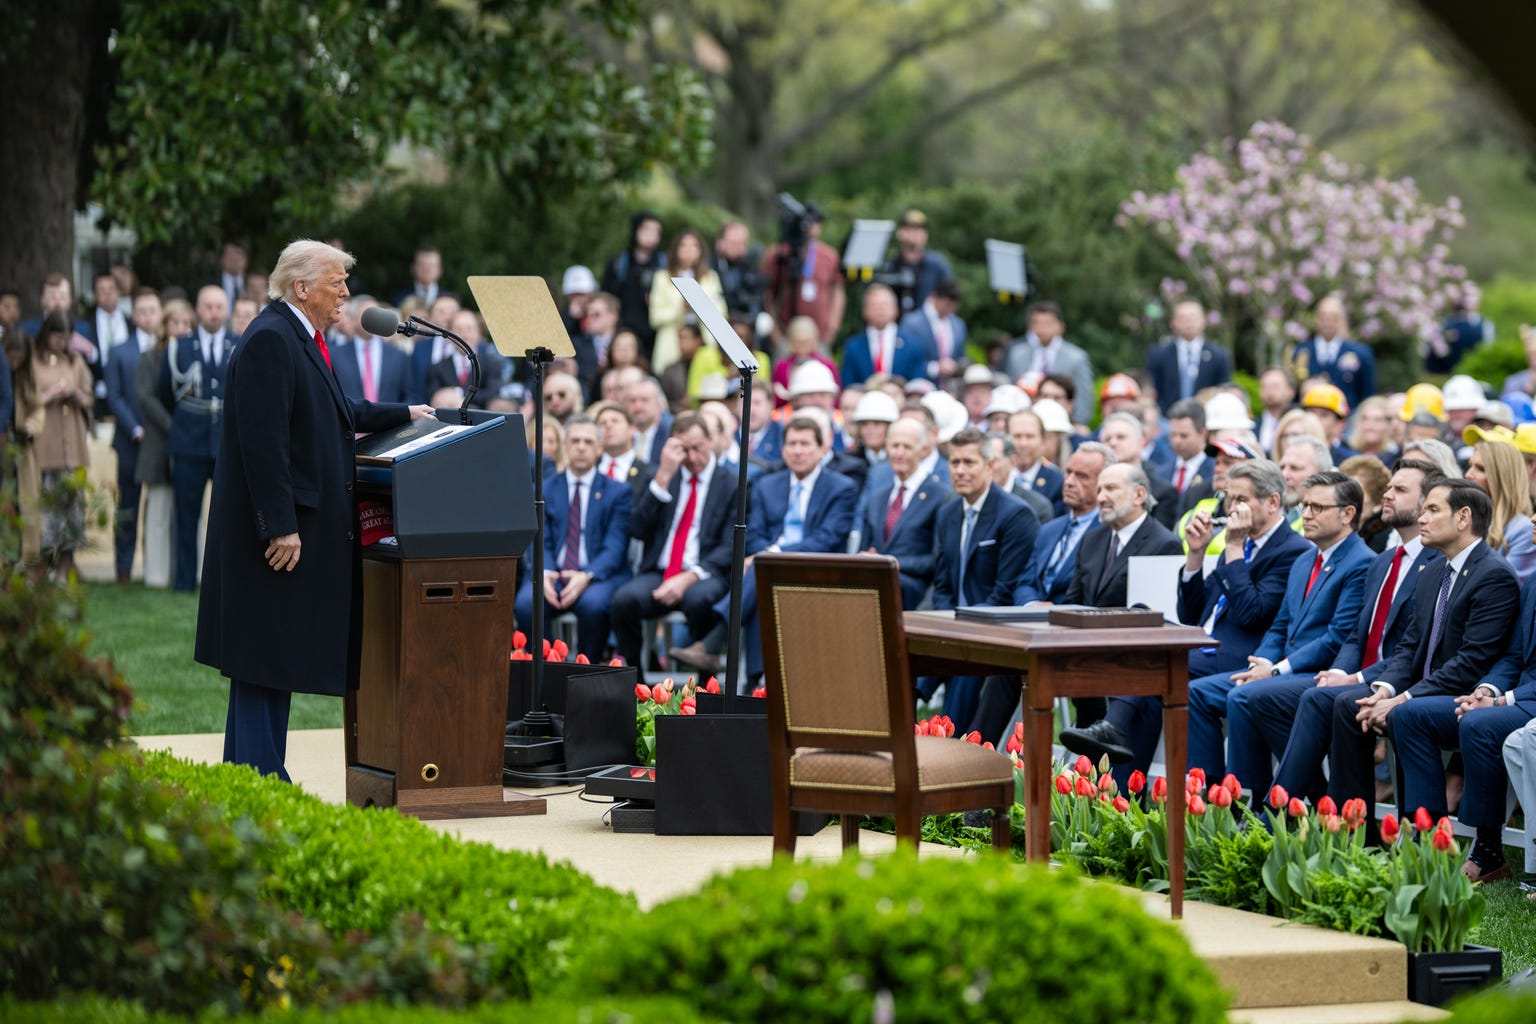
The proximate cause was the policy announcement on April 2, 2025 — branded by the administration as “Liberation Day” — which introduced sweeping tariffs across nearly every sector of the U.S. economy. The details and market reaction were unprecedented: multi‑tier tariff increases, immediate effective dates, and aggressive escalation between major economies.
Markets responded violently. Within days major equity indexes plunged, correlations across asset classes broke down, and the liquidity landscape shifted. For trend strategies calibrated to historical cross-asset relationships and gradual regime shifts, the event looked less like a market correction and more like a discontinuous structural shock.
Why Trend-Following Failed This Time
Momentum and trend-following systems are elegantly simple: identify persistent directional moves, size positions, and ride trends until they reverse. But they depend on two fragile assumptions:
Momentum persistence — trends last long enough to overcome transaction and implementation costs.
Stable cross-asset correlations — hedging and diversification behave predictably in stress.
April 2025 violated both.
Signal Lag and Whipsawing
Systematic signals are historically derived and parameterized to balance responsiveness with noise control. In a flash reversal driven by policy, signals can flip from long to short faster than execution teams can safely reverse large exposures. As Hedgeweek and industry analysts noted, whipsawing markets are the worst environment for trend-following models — frequent false signals and rapid reversals cause realized P&L to diverge materially from backtested expectations.
The Size Problem
With $172.6 billion AUM, Man Group faced a market-impact problem of its own making. When a model signals a broad, simultaneous position reversal across hundreds of markets, the fund becomes the market. The operational timeline during the event was brutal:
Signal generation: T+0
Position sizing calculations: T+1 hour
Order routing and execution: T+2 hours
Full position reversal: T+48–72 hours (minimum)
Market moves outpaced execution. Slippage and widening spreads transformed expected small losses into catastrophic drawdowns.
Correlation Breakdown
Risk models often rely on canonical stress behaviors (e.g., bonds up when stocks drop, dollar as a safe haven). In early April, those relationships collapsed: equities, certain fixed-income sectors, and the dollar moved together in directions traditional models did not anticipate. When correlations converge toward 1.0, the mathematics of diversification fail — every instrument contributes to the same directional risk.
Liquidity and Transaction-Cost Explosion
Stress widens bid-ask spreads and thins depth. During the tariff shock, the Treasury market and futures venues saw spreads and implementation costs expand materially. A strategy with a theoretical +2% alpha can rapidly turn negative once execution costs, market impact, and fill risk are included. For large systematic players, the same liquidity that supports normal trading disappears when the crowd tries to exit together.
Industry-Wide Implications
This wasn’t an isolated AHL problem. The CTA/trend-following complex as a whole was bruised. Indexes tracking trend-following strategies (SG Trend Index, TTU, BTOP50) showed significant drawdowns, and industry commentary through April and into the summer of 2025 reflected a sobering reassessment of momentum strategies’ robustness under political tail risks.
Three Structural Lessons for Quant Research
For researchers building robust systematic strategies, April 2025 offers clear, actionable lessons:
Model Humility & Regime Awareness. Backtests are conditional on historical regimes. Explicit regime-detection layers — and conservative behavior during detected regime shifts — are critical. Don’t assume stationarity when policy risk is rising.
Liquidity-First Execution Design. Treat liquidity as a primary risk factor, not a convenience. Incorporate realistic market-impact models, staggered execution plans, and dynamic sizing that responds to real-time depth, not just historical averages.
Stress-Test Political Tail Risk. Calibrate scenarios that produce discontinuous price moves across multiple asset classes. Use adversarial tests where correlations converge and liquidity evaporates. Consider option-based overlays or protective sleeves that limit downside during policy-driven jumps.
The Recovery Question
As of the April 17, 2025 trading statement, recovery looked distant. Man Group cut performance fee forecasts sharply — reflecting that many of the firm’s flagship funds were underwater and unlikely to generate incentive fees in the near term. The broader question lingers: can large-scale trend-following survive in a world where policy shocks can induce abrupt, cross-asset breakdowns?
There is no single, neat answer. Size, liquidity, and political tail risk create a three-way interaction that demands both humility and innovation from quantitative teams.
Final Takeaway — Politics Breaks Math
Quant strategies are powerful tools, but they are built on assumptions. April 2025 exposed a central truth: when political shocks produce discontinuous, cross-asset moves, many of those assumptions fail together. The most dangerous phrase in quant finance isn’t “this time is different” — it’s “our models already account for that.”
The $5.6 billion loss at Man Group is a painful case study in the limits of historical inference, the primacy of liquidity, and the necessity of designing models that actively manage the possibility that politics can — and will — break the math.
Sources
(Primary filings and contemporaneous reporting cited by the author.)
Man Group — Trading statement for the quarter ended 31 March 2025 (April 17, 2025)
Bloomberg — Man Group Hedge Funds Losing Up to 15% This Year Show Quant Pain (April 11, 2025)
Reuters — Hedge fund Man Group’s assets dip by nearly $6 billion during Trump tariff turmoil (April 17, 2025)
Reuters — What just happened in the US Treasury market? (April 10, 2025)
CityAM — Man Group: Hedge fund racks up billions in performance losses (April 17, 2025)
Pensions & Investments — Man Group assets drop by $5.6 billion in April tariff chaos (April 17, 2025)
Alternatives Watch — Man Group’s Q1 gains wiped out by April turmoil (April 21, 2025)
Peel Hunt — Man Group stock price target downgraded on performance fee concerns (May 1, 2025)
Hedgeweek — Man Group’s quant hedge funds slide as market volatility roils trend strategies (April 14, 2025)
New York Fed, BNY Mellon, and other market-structure analyses on spread widening during April 2025 (various April–May 2025 publications)
This analysis is part of a series examining real hedge fund trades and their quantitative mechanics. All performance figures are based on official company filings and verified third-party sources. For corrections or additional sourcing, contact me on Linkedin.
Cover photograph: The White House, public domain, via Wikimedia Commons.