



On 27 August, AQR’s $3.2bn managed futures fund reported it was short every US Treasury future on 30 June. Anyone short duration beside the trend funds, or waiting to buy what they sell, needs to know when that selling stops. I read the filing line by line and rebuilt AQR’s published trend rule on Treasury’s daily yield curve to find out.
The claim: AQR’s published trend rule, which averages a 1-, 3- and 12-month signal and rebalances at each month end, does not need a bond rally to stop being short Treasuries. If the 10-year simply holds near 5.28%, the calendar and the bond’s carry turn its fastest signal long at a month end this autumn and its average net long by the end of December.
The stake: Trend funds built large positions against bonds in this selloff, the FT reported. A rule that stops selling with no move in price matters to every short duration book leaning on that flow.
The catalyst: The Fed meets on 27 and 28 October and on 8 and 9 December. AQR’s rule decides at each month end.
Wrong if: AQR Managed Futures Strategy Fund’s N-PORT for 31 March 2027, due on EDGAR by about 1 June 2027, reports a positive 10-year bucket in its US dollar DV01 (a 10-year book that gains when yields rise) while the published rule’s 10-year position, set at the 26 February 2027 month end on Treasury’s par curve, is net long.
In August I argued that Bessent’s doubled buybacks would not cap the long end, and said I was wrong if the 30-year held under roughly 5.10% for two weeks once the larger operations took effect on 9 September. It never did, closing at 5.63% on 2 October, so that leg stands; the 4 November refunding is the open test.
Trend funds rode the bond rout
The money on the other side of that market has done well. According to people familiar, as reported by the FT and relayed by Hedgeweek, Graham Capital’s Tactical Trend fund was up more than 31% for the year, Winton’s Diversified Macro 17.5% through late September and Aspect Capital’s flagship 21%. Not all of it came from bonds: the same report says Winton and Aspect also gained in energy. The FT said the computer driven funds had built large positions against bonds, and that the 10-year reached 5.342% on 1 October, its highest since 2002. Treasury’s par curve, which this piece uses throughout, peaked at 5.29% on 30 September.
None of the three publishes its futures positions, so I can’t check their books. I went to a large trend fund that has to show the SEC what it holds.
The usual way to frame a trend fund’s exit is a price trigger: the funds stay short until a rally through some level forces them to cover. AQR’s published rule, run on Treasury’s own data, says something stranger. Read on 2 October, its fastest signal needed a rally the 10-year has not produced in any month of the past year. Read at the October month end, when the rule actually decides, the same signal needs no rally at all.
AQR is short the Treasury curve
Form N-PORT is a registered fund’s holdings report to the SEC, made public as a quarter end snapshot weeks later. AQR’s report shows the book on 30 June and was filed on 27 August. The fund trades frequently, so the report shows direction, and size only as of that date.
The direction is plain. The fund was short 2-year, 5-year and 10-year note futures, the long bond and the ultra bond, with no long US Treasury future anywhere in the book. Those lines carried −$1,116.1m of notional, or 34.8% of net assets. It was also short all seven SOFR contract months it held.
Item B.3 of the form asks for the change in value of a fund’s portfolio for a one basis point move in rates, which desks call DV01. AQR’s US dollar buckets sum to +$825,142, positive in every bucket from one year to 30 years. On a $3.2bn fund, that is about 2.6bp of NAV for every basis point US yields rise.
The trigger resets each month
AQR’s 2017 paper on a century of trend following, by Brian Hurst, Yao Hua Ooi and Lasse Pedersen, tested one trend rule on 67 markets, 15 of them bond markets, with data back to 1880. It averages three signals in equal weight, built on 1-, 3- and 12-month windows, and it rebalances once a month. Each window is a lookback, the stretch over which the rule measures a market’s past return. Positive means long, negative means short, and each position is sized to the same volatility inside a book scaled to a 10% annual volatility target.
The return it reads is a return over cash, the definition AQR’s original trend paper tested across 58 futures and forward markets. So I take what a constant maturity 10-year earned over each window, yield plus price change, and subtract what a three month bill earned. The yield the bond earns over the bill is carry: what it pays you for sitting still.
Two things in that rule decide the exit, and neither is a fixed price. At each month end, every window’s start moves to a later month end close. And the bond earns carry: the 10-year closed at 5.28% on 2 October against 4.19% on a three month bill. A leg flips when the 10-year finishes the month below its window’s starting yield plus a small carry allowance.
Say the 10-year jumps 50bp in September and then goes nowhere. At the end of October the 1-month window starts from September’s high, so a flat October shows a small positive return over cash, just the carry, and the leg goes long. After a steady selloff, the start points the windows roll onto are higher than the ones they drop, so the trigger climbs toward the price even if the price stands still.
A trend rule’s trigger is a date with a level attached, and the date keeps moving.
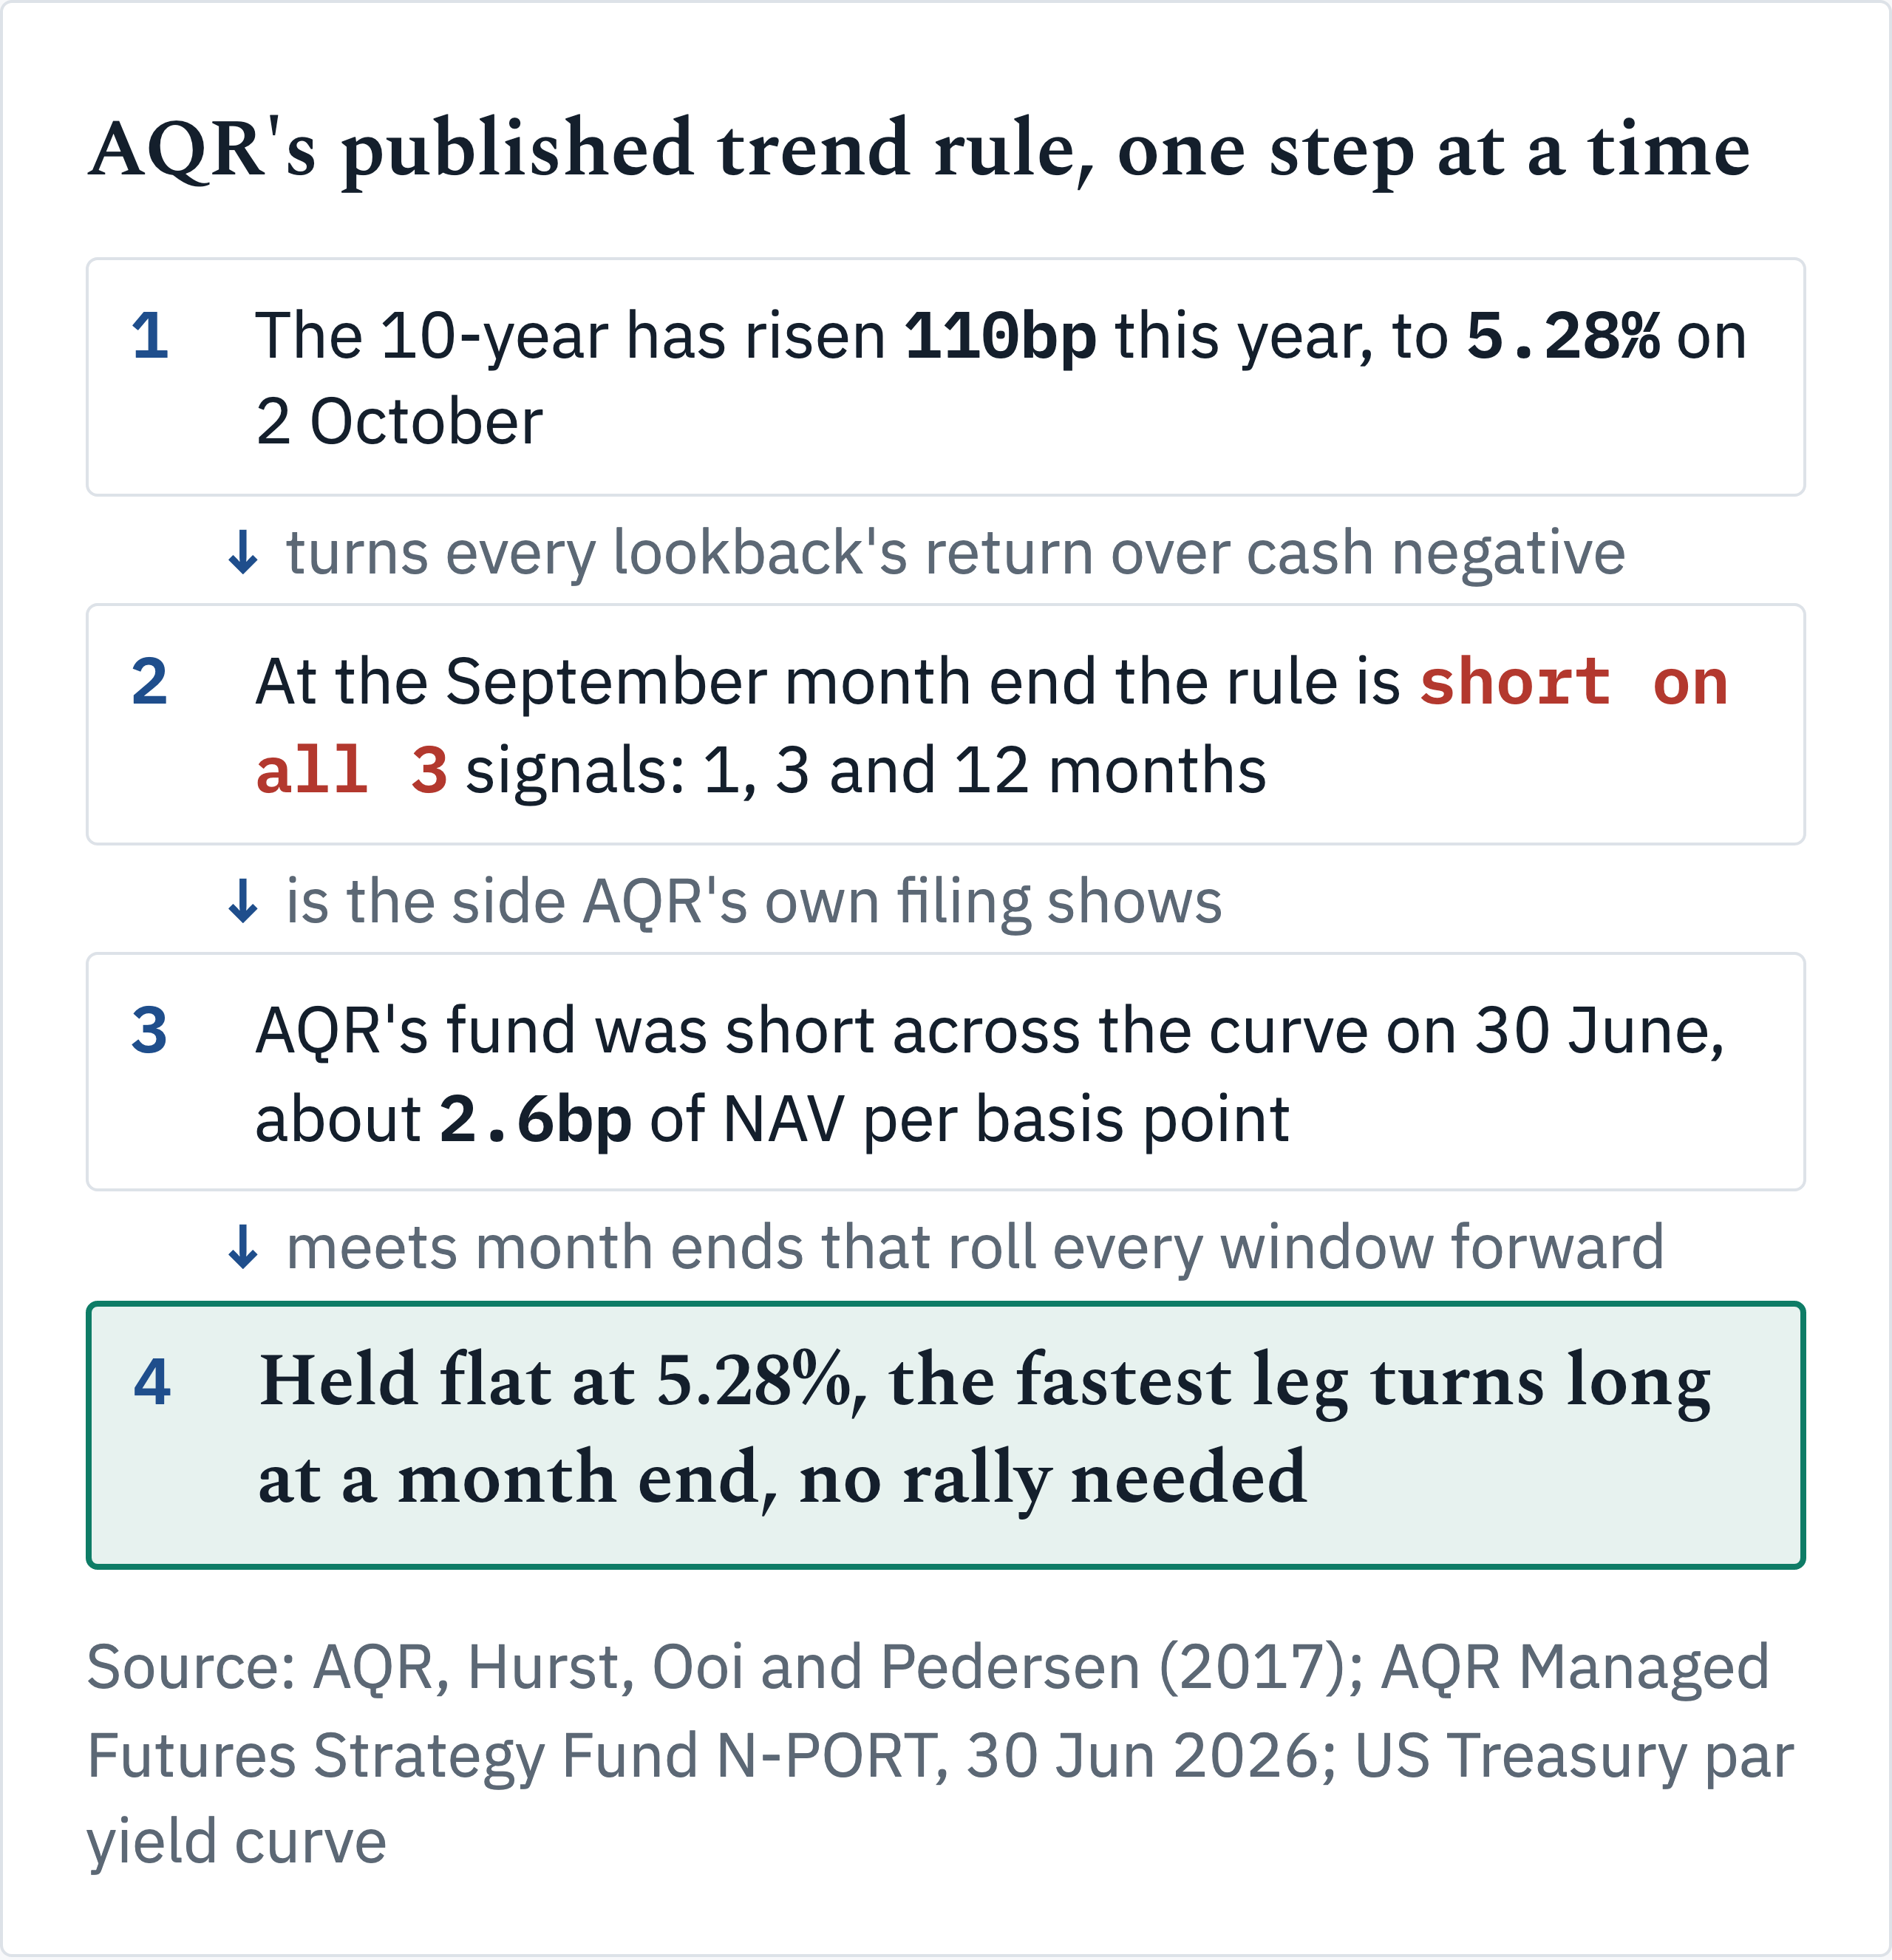
The chain, one step at a time:
The 10-year has risen 110bp this year, to 5.28% on 2 October.
So at the September month end each lookback’s return over cash was negative, and the published rule went short on all three.
AQR’s fund was short across the curve at 30 June, at about 2.6bp of NAV per basis point.
In a flat market the trigger climbs to the price at the month ends, and the legs turn long one at a time, fastest first.
If you are short duration partly because the trend money is short, your thesis carries a clock that runs whether or not the 10-year moves. If you are waiting to buy duration once the selling stops, the stop can arrive in a market that has not rallied at all.
So price triggers describe half the exit, and time is the other half. One number decides how they combine: at what 10-year close does the fastest leg flip at the October month end?
What follows lets you decide whether to stay short duration beside AQR through the October Fed, or step aside before its rule does.
Below the paid line:
The month end flip table: where each of the three lookbacks turns long on 30 October, with the arithmetic.
The schedule a sideways market sets through December, in three month end rows, leg by leg.
The filing line by line, with its rate risk per maturity and what the June book would have earned since.
The position: instrument, entry, payoff and kill levels, size in risk units, and the exit date.
