



Treasury doubled the per operation buyback ceiling this week, and the total quarterly dollars it actually budgeted for these buybacks never moved.

Photo: Treasury Department · Public domain · via Wikimedia Commons

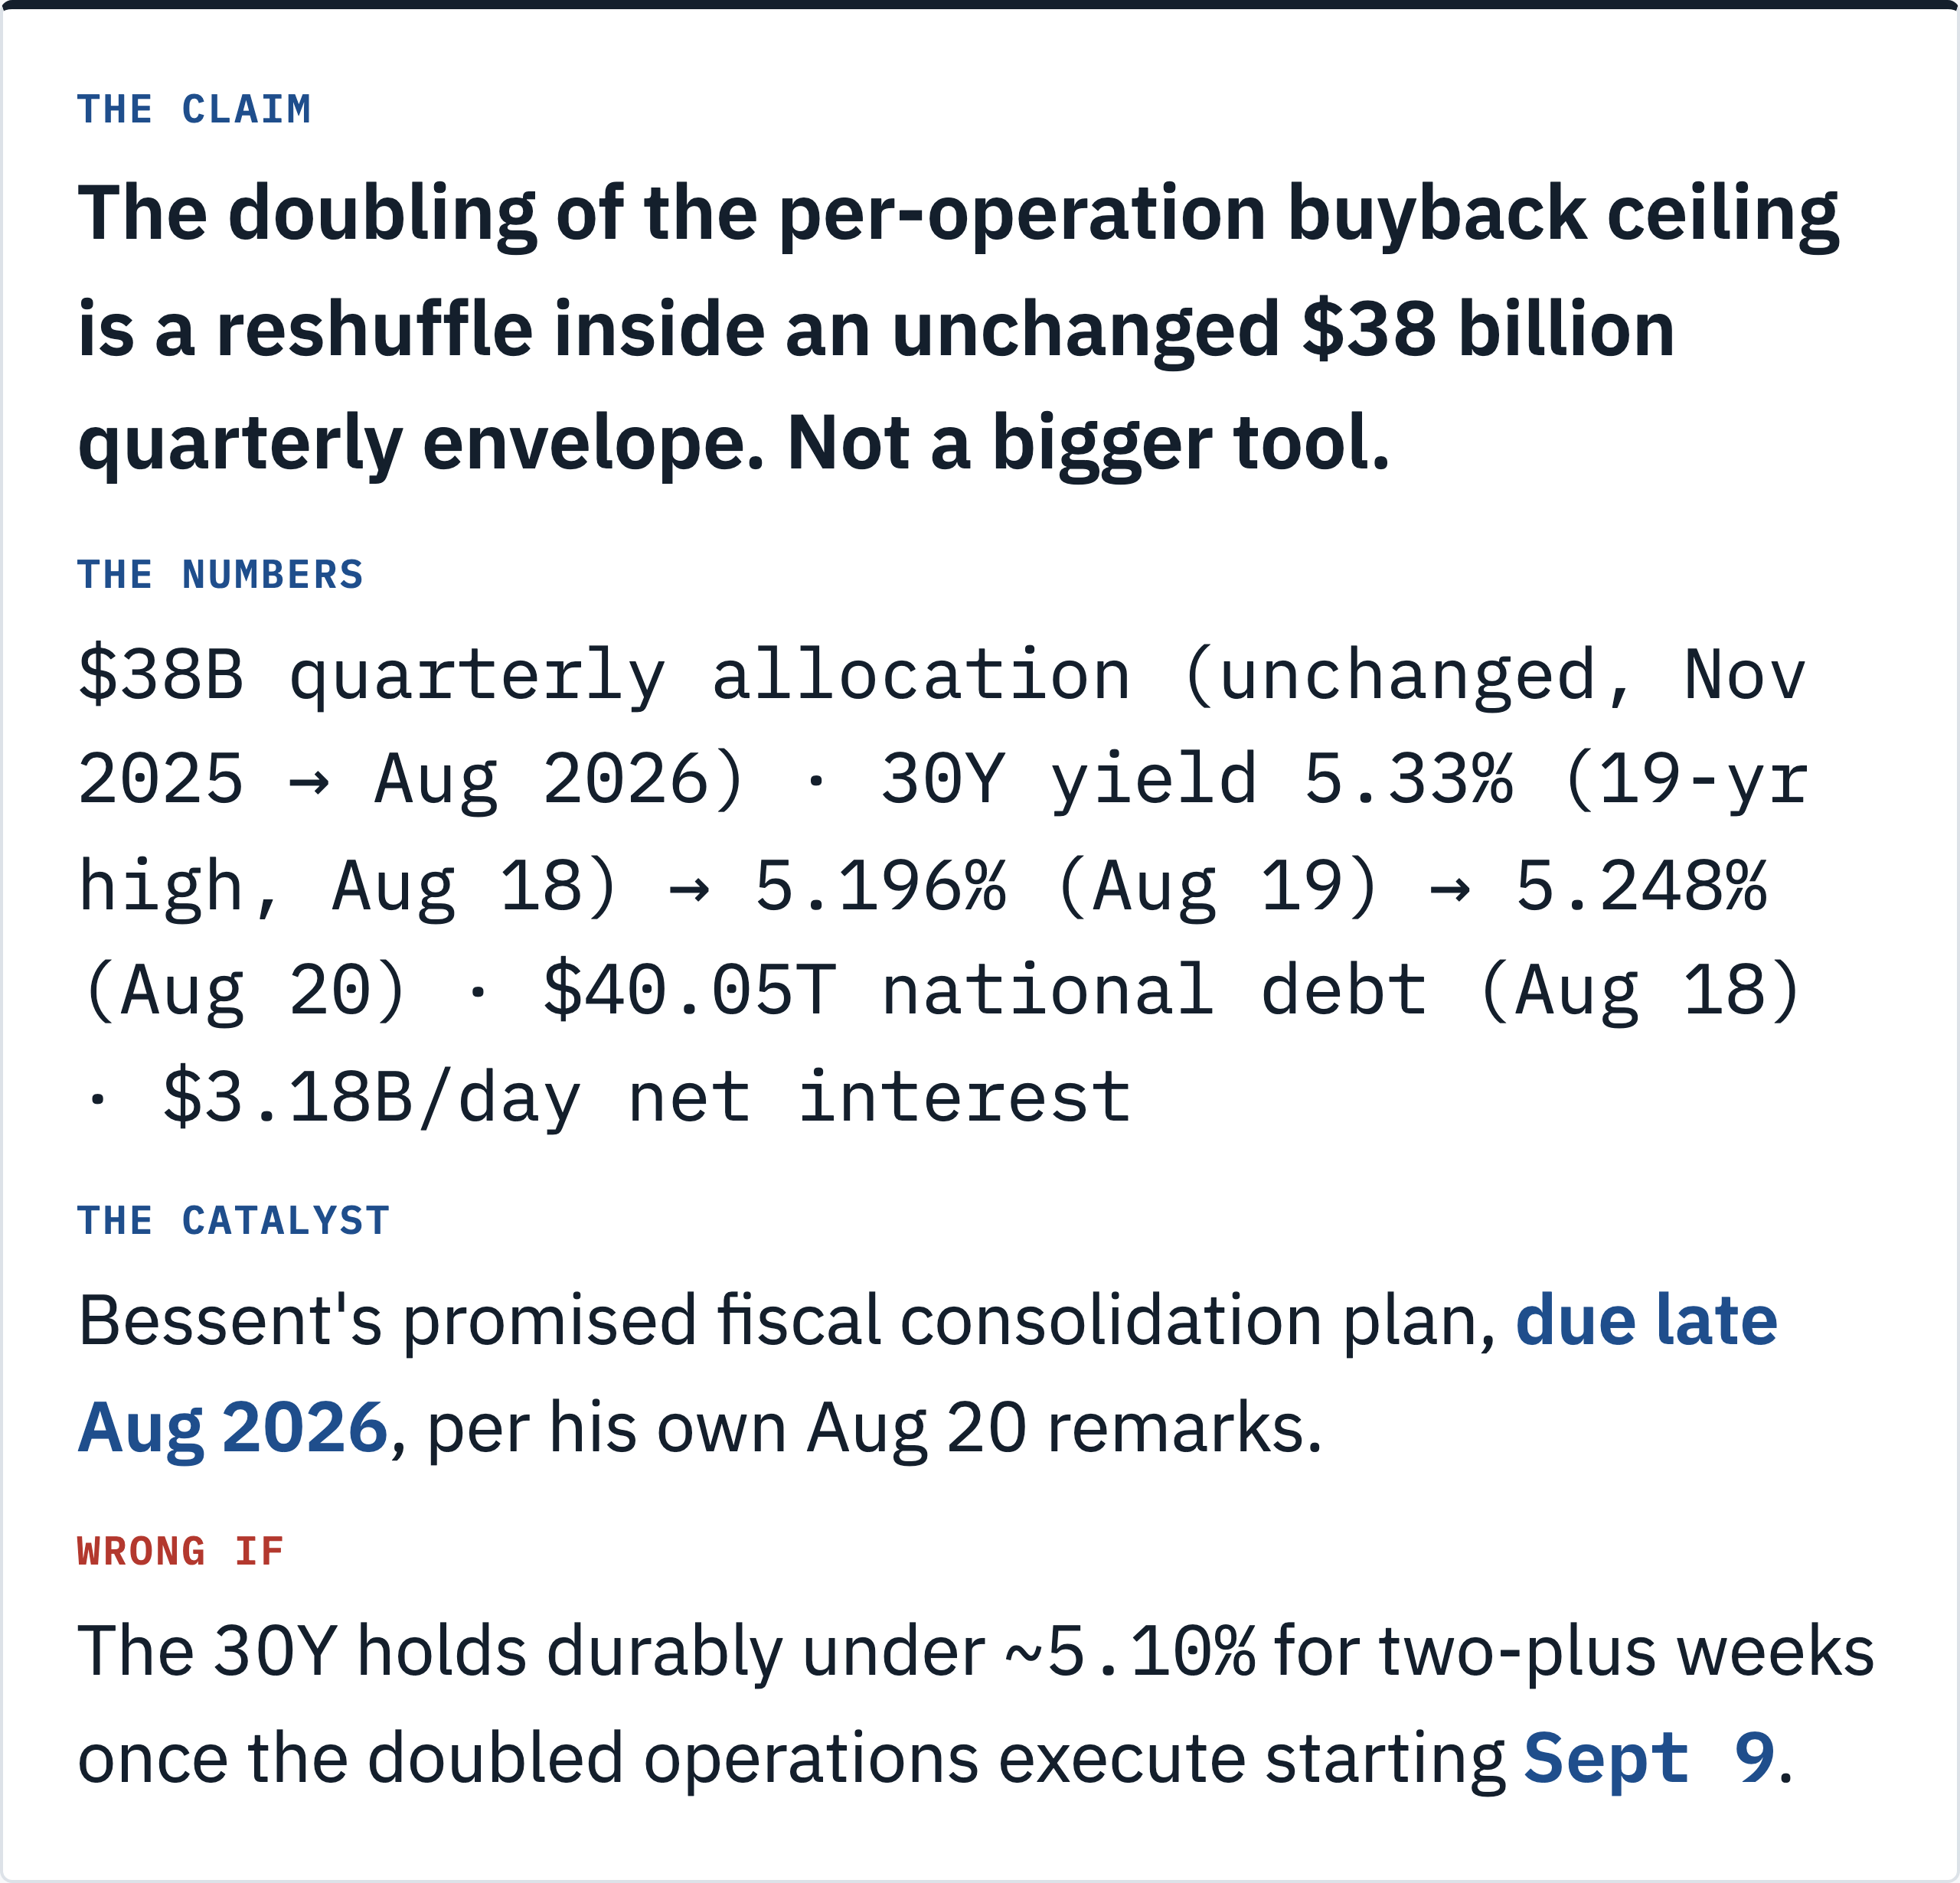
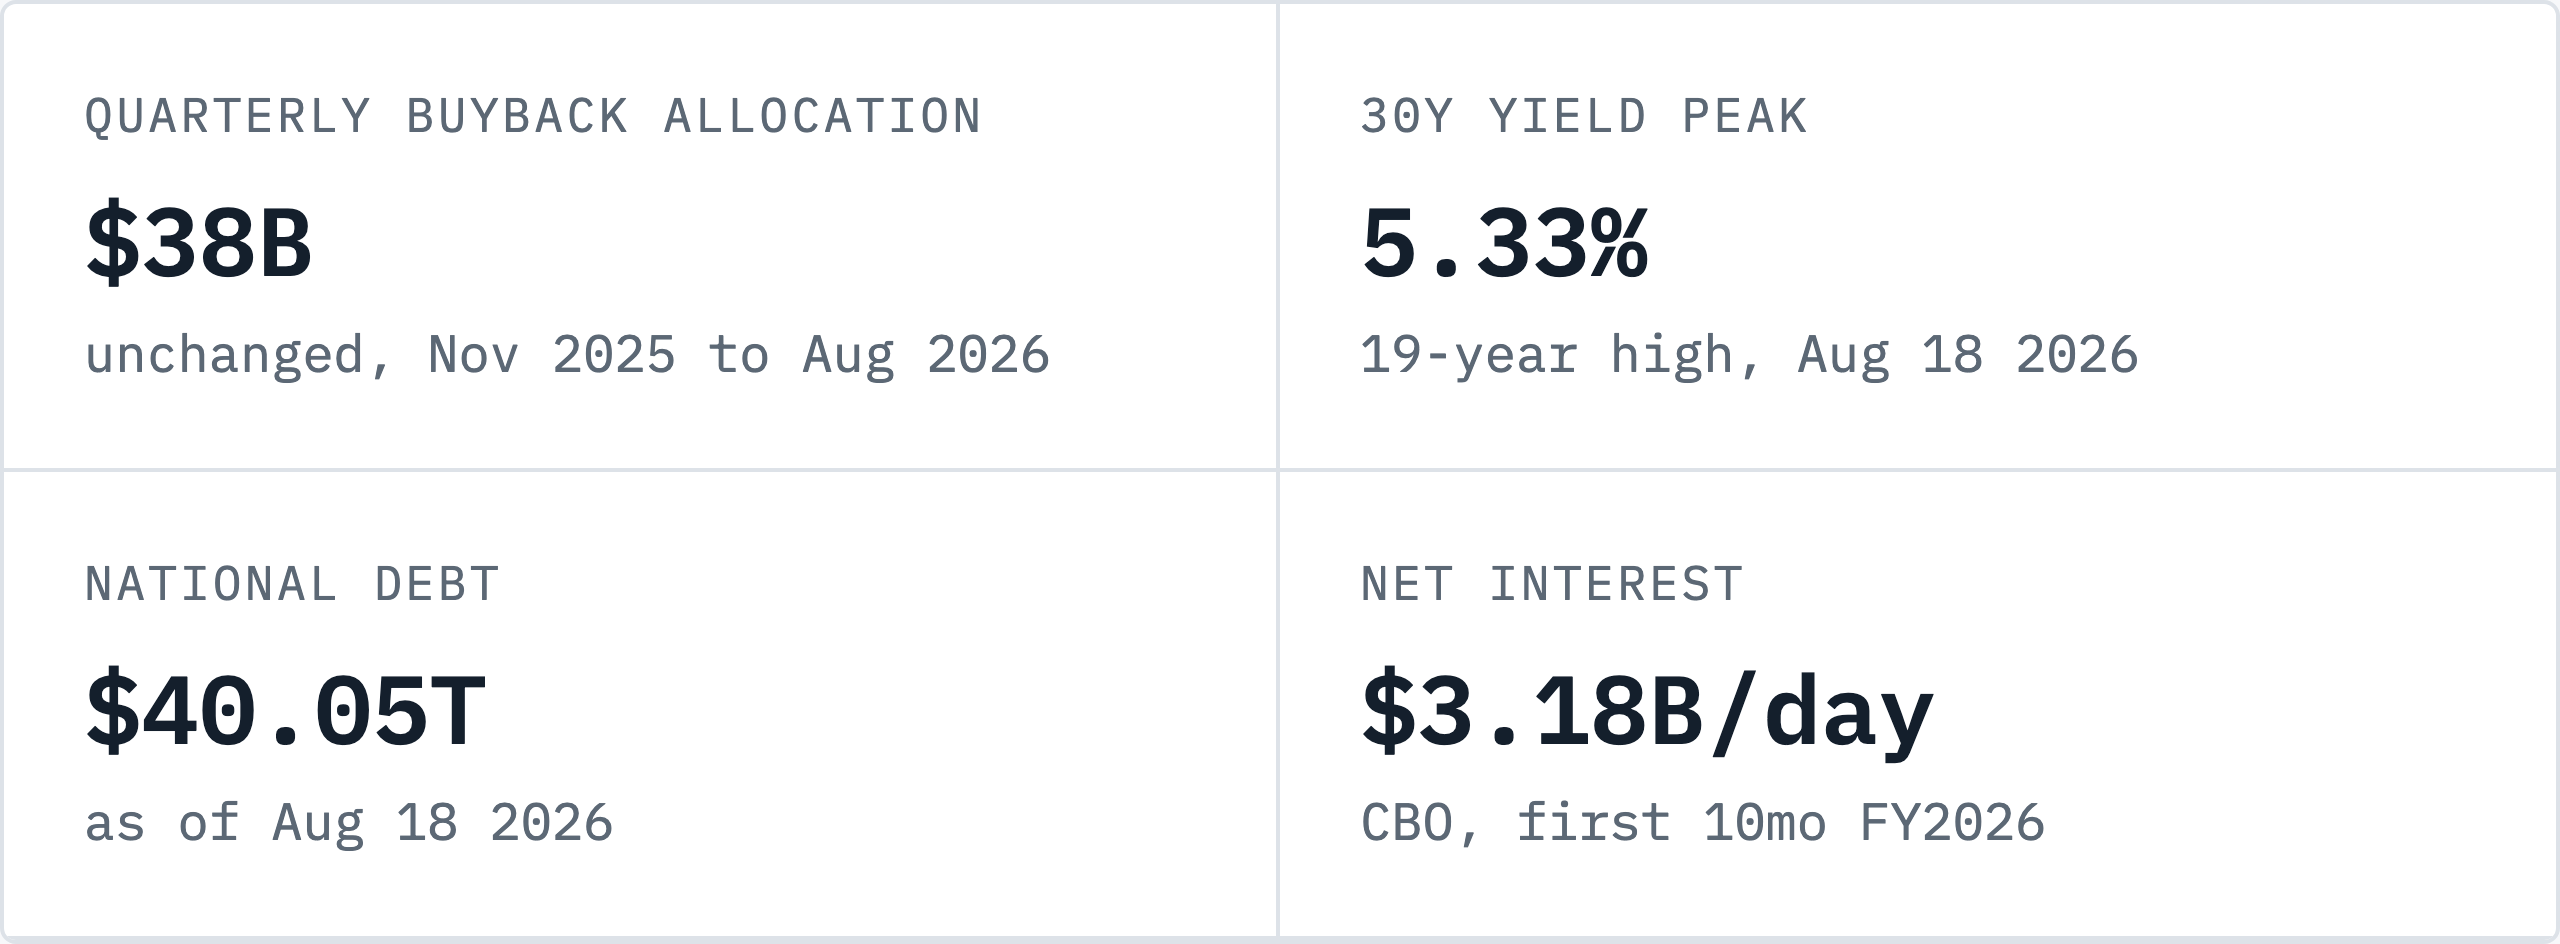
I want to start with the number most of this week’s coverage never printed. I went looking for the extra firepower everyone assumed came with “doubled.” It wasn’t there. Everyone caught that the 30 year hit a 19-year high above 5.33% on Tuesday. Everyone caught that Treasury “doubled” its buyback the next day. Almost nobody reported that the total quarterly dollars Treasury budgeted for liquidity support buybacks, $38 billion, never moved between the August 5 refunding statement, where Treasury said buybacks would continue at the existing size, and the August 19 announcement fourteen days later (Yahoo Finance / 24-7 Wall St.). What changed is the shape of the same envelope. Bigger operations at the long end, and more of them, inside the same total budget. That’s a real reallocation toward a sector under visible stress. It isn’t new firepower.
The consensus, stated at its strongest
I think its strongest believers would sign every line of the dominant read. Scott Bessent, a former Soros hedge fund manager who made his name on high stakes currency bets, is running Treasury debt management the way he ran a trading book: watching the tape, sizing up, stepping in when the market gets disorderly (Fortune). He told reporters plainly that “we believe that the yields don’t reflect the underlying fundamentals,” and he doubled the long end buyback ceiling from $2 billion to $4 billion per operation, covering the 10 to 30 year sector, effective September 9 through November 4 (Treasury SB0607). He has since said the real number “could be more than the $4 billion per issue” (Yahoo Finance). One strategist called it going against “regular and predictable, but that’s the world we live in” (Fortune). The market’s first reaction backed the read. The 30 year fell nine basis points the day of the announcement, from Tuesday’s close near 5.285% to 5.196% (CNBC).
The honest version of this case does not need to overreach. A Treasury Secretary with a trading background watched a benchmark yield blow through a nineteen year high. He pulled a real lever, and the tape moved his way, same day. He calls himself “the nation’s top bond salesman,” Fortune’s own profile of him notes, and Treasury yields “a strong barometer for measuring success.” That framing is not empty, in my read. It is a different way to run this desk than his predecessors ran it. Different is not the same as wrong.
The variant view: an unchanged budget wearing a bigger headline
Here is what forces a different read, and some of it comes straight from Bessent’s own mouth. Asked about the skepticism, he didn’t claim the buyback fixes the fundamentals. He called it signaling. His full quote: “Part of it is signaling here, to show that we believe that the yields don’t reflect the underlying fundamentals” (Yahoo Finance). That’s the Treasury Secretary drawing his own line between moving the level and signaling a view on the level. He said it himself. A message about yields, aimed more at sentiment than at the level itself. Every serious analyst who looked at the operation landed on his side of that line.
Adam Phillips, managing director at EP Wealth Advisors, put it in plain language: “This is not the cure to what ails the bond market. There are structural forces here at play that are really beyond the Treasury and the administration’s control” (Yahoo Finance). Maia Crook, a senior research analyst at JPMorgan Chase, wrote in a client note that the intervention “belie[s] the underlying structural challenges and do[es] nothing to address them,” warning that absent real fiscal consolidation, “we fear the markets will view this action as lacking credibility” (Bloomberg via Yahoo Finance). ABN Amro’s rates strategists made the capacity point directly: it’s “difficult to see the Treasury maintaining increasingly large buybacks on a sustained basis, particularly given the ongoing (and rising) financing needs” (CNBC). Three desks. Three angles. None of them call this a scam, and none of them thinks it works as advertised, either. Phillips and ABN Amro call it correctly sized, smaller than the headline suggests. JPMorgan goes further: done without real fiscal consolidation behind it, the move itself risks reading as a credibility problem, embedding a higher term premium and higher yields over time instead of lower ones.
The $38 billion figure is what turns that read from a hunch into arithmetic. Treasury’s own August 5 quarterly refunding statement said buybacks would continue at the existing size (Treasury quarterly refunding documents). Fourteen days later Bessent announced the per operation cap would double. Both statements can only be true together because the quarterly total never changed. What moved was the count, from two long end operations a quarter to four, and the size of each, from up to $2 billion to at least $4 billion, inside the same $38 billion box Treasury had already set in November and reconfirmed in August. I don’t read that as deception. I read it as a fast reallocation toward the sector under the most stress, done inside a budget that was already fixed. Four operations at up to $4 billion apiece comes to $16 billion at the ceiling. I make that well under half of $38 billion, with room left on the rest of the calendar. The arithmetic holds. That’s a smaller, more ordinary action than “Treasury doubled its firepower to fight the bond market.”
How a buyback actually moves the curve, and how big this one really is
Start with what the operation physically does, because “$4 billion” invites a scale error if it is not pinned down first. Treasury is not spending $4 billion of idle surplus cash. A liquidity support buyback works like refinancing a mortgage. Treasury raises the cash by issuing new debt elsewhere on the calendar, then uses it to retire older, harder to trade coupons in the 10 to 30 year sector. Total debt outstanding does not shrink. Old debt goes out. New debt comes in. Same size, different shape. Only the composition changes: more liquid on the run supply, less illiquid off the run overhang. I checked this against the mechanism papers themselves. Getting the funding chain wrong here would make the rest of this article’s math wrong too.
What that composition change buys is real, and it is narrow. The IMF’s 2025 working paper on this program, the only academic study I found that has actually measured the post-2024 relaunch rather than described it, finds that buybacks moderately narrow bid ask and off the run spreads, raise prices for both the listed securities and the ones actually purchased, and give primary dealers a reliable outlet to sell down illiquid long dated inventory they would otherwise have to warehouse (IMF Working Paper 2025/088). Dealers holding illiquid 20 to 30 year paper effectively see their exit liquidity for those positions double. That is a genuine improvement in market plumbing. It is a liquidity premium trade. It is not a valve on the risk free rate. The paper’s own framing concerns compressing the off the run discount. Where the on the run yield actually settles is a separate question the paper never claims to answer, and the compression it does measure runs in tenths of a basis point.
My own read on who actually captures that value is straightforward, and I think it survives scrutiny. A primary dealer sitting on illiquid 20 to 30 year paper it cannot easily move gets a guaranteed buyer at a predictable calendar date, which is worth real money in balance sheet and funding cost terms even before the spread compression itself is counted. Treasury, for its part, is effectively paying up for that certainty. It has to offer a price good enough to draw sellers into every operation, and the securities it buys back are, almost by definition, the ones the market already valued least. That does not make the program a bad trade for the taxpayer, in my view. Dealer balance sheet capacity is a real input into how efficiently the government can borrow at all, especially at the long end, where capacity has been visibly thin all year. It does mean the buyback’s first and clearest beneficiary is the dealer community’s inventory book. Not the government’s borrowing cost directly. The two connect only indirectly, through a liquidity premium measured in fractions of a basis point.
Scale the tool against its own history, then against the deficit
Scale it against its own history before scaling it against the deficit. This program sat effectively dormant for two decades, running just 17 operations total between 2002 and 2023, before Treasury relaunched it in May 2024. Since the relaunch it has repurchased $239 billion cumulatively: 41 operations in 2024, 57 in 2025 (Yahoo Finance / 24-7 Wall St.). This week’s change continues an acceleration that has been building since that May 2024 relaunch, 27 months ago. It does not break from one. Call it historic against two decades of near disuse, if the headline is what you’re grading. For a desk pricing September, I’d use the second reading instead: ordinary, a continuation of where the program was already heading, not a regime change.
The 2000 to 2002 version of this same tool moved yields by more than fractions of a basis point, and I want to name that directly before a sharp reader finds it first. A Journal of Banking and Finance paper on that earlier program found a cumulative effect closer to 95 basis points, roughly 7.8 basis points for every $10 billion purchased, an order of magnitude larger than what the IMF measures on the version running today (Connolly and Struby, Journal of Banking and Finance, 2024). The mechanism explains the gap. It doesn’t undercut my point. That earlier program was funded out of budget surpluses. Retiring debt with surplus cash is a genuine reduction in the stock of Treasuries outstanding. Today’s program is revenue neutral by design, funded by issuing elsewhere on the same calendar, so the composition of the debt changes and the total does not. A tool that actually shrinks supply and a tool that reshuffles it are not the same tool wearing different sizes. That distinction is what explains the smaller effect size on the version Bessent is running now, more than the dollar figure does.
Now size the tool against the problem it is supposed to fix. The federal government is running a budget deficit approaching $2 trillion for the year, and it has to auction the difference no matter how much old stock it retires on the side. National debt crossed $40.05 trillion at the close of business on August 18, doubling in under a decade (Washington Post; CBS News). $963 billion over the first ten months of the fiscal year, roughly 303 days. I make that $3.18 billion a day, up 14% year over year on the CBO’s own numbers (CBO via Yahoo Finance). That figure is meaningfully higher than the $2.7 billion some retellings of this story are using. I trust the CBO’s own division over a rounded secondhand number. A $38 billion quarterly tool, moving tenths of a basis point of liquidity premium, is not built to offset a financing gap well over an order of magnitude larger. Nobody at Treasury has claimed otherwise on the record. That gap, between what the buyback can do and what the headlines imply it is doing, is where I think this whole story actually lives.
What separates a real cap from a liquidity bridge, and Thursday already told you
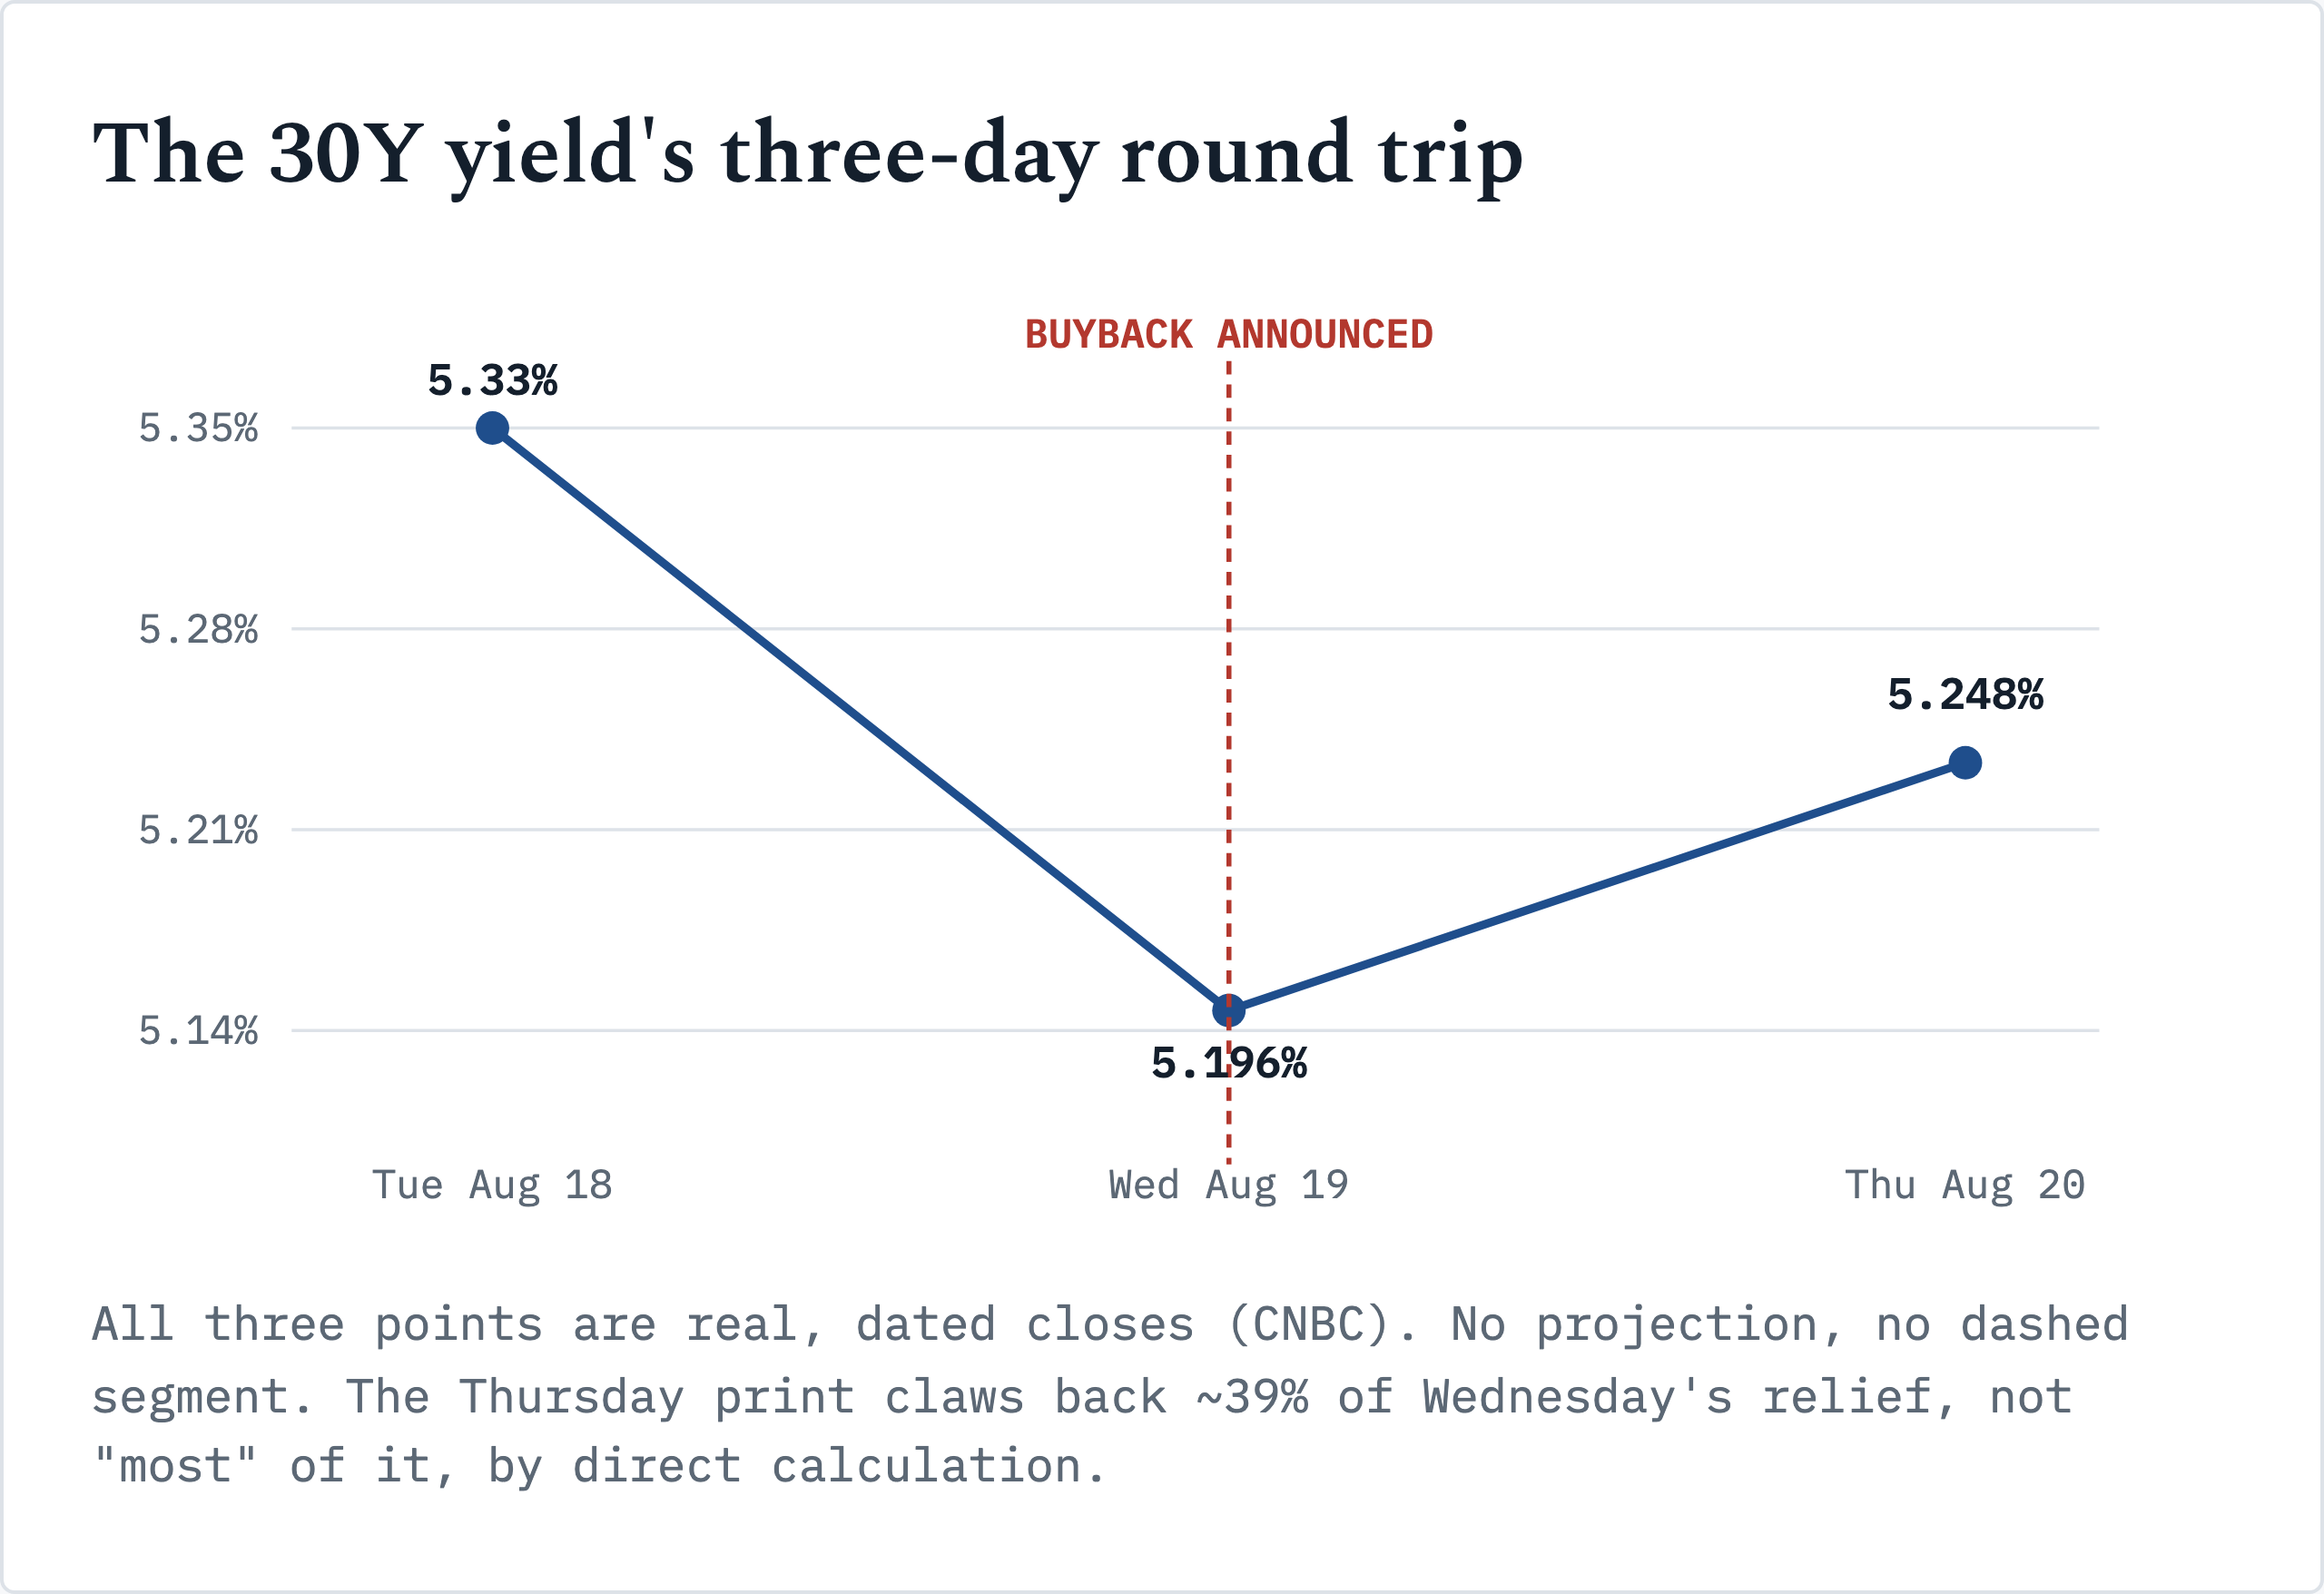
Here’s the discriminator, and it isn’t hypothetical. The market ran the test inside a single day. If the buyback truly capped the risk free rate at a new, lower level, the relief should have held or built as the initial shock absorbed. Instead the 30 year gave essentially all of it back. It closed at 5.196% Wednesday, the day of the announcement, then traded back above 5.248% by Thursday, more than five basis points above Wednesday’s close (CNBC). 5.2 of the 13.4 basis points Wednesday gave up. I make that just under 39 percent clawed back in one session. A structural cap doesn’t evaporate in one session. A liquidity premium trade, whose whole measured effect is a fraction of a basis point, gets swamped by the next day’s ordinary volatility. Small effect. Small survival time. That’s exactly the shape the IMF’s own effect size predicts. It’s exactly the shape the tape delivered.
One line from Thursday’s coverage is worth sitting with alone: “The bottom line is that deficits are not going away” (Yahoo Finance). I’d add the corollary the same reporting points toward. Bessent’s own next move confirms the read. He isn’t waiting to see if the buyback works. He’s promising a separate fiscal consolidation plan, addressing spending and revenue both, with President Trump and OMB Director Russell Vought involved, due within days of the buyback announcement itself. You don’t reach for a second, bigger tool three days after deploying the first one if the first one solved the problem. The buyback bought roughly one trading session of headline relief and a talking point. The fiscal plan is the actual bet on the level.
Where this argument is weakest
I want to name the honest gap before a skeptical reader finds it alone. The IMF paper I’m leaning on studied the original, smaller version of this program, the one Treasury has run since the May 2024 relaunch at up to $2 billion per operation. It didn’t study this week’s doubled version, because that version is one day old as I write this. I’m extrapolating an effect size from the old program to the new one. I’m not citing a direct measurement of the new one. That’s a reasonable extrapolation. The mechanism, the sector, and the dealer base are unchanged, and only the per operation size roughly doubled inside a flat quarterly budget. But I can’t rule out a real nonlinear effect at the larger operation size from the data I have. Untested is not the same as wrong. If Treasury’s September results move spreads by more than double the old program’s measured effect, that would weaken this argument.
Second, Thursday’s reversal isn’t a clean natural experiment. I can’t fully separate the buyback’s effect fading from other news that same day pushing yields higher regardless. The Fed released its July 28-29 FOMC minutes that same Wednesday afternoon, and they ran hawkish beyond the three known dissents, with participants telling the committee “policy tightening would likely be necessary if inflation did not decline” (Federal Reserve). That’s a same day, rates mechanistic confound sitting right on top of my own evidence, and it deserves its own sentence instead of hiding inside a general disclaimer. The Iran war remains an active, six month conflict disrupting Strait of Hormuz traffic, with Brent trading above $91 a barrel on supply disruption fear the IEA has called the largest in the history of the global oil market (Bloomberg). Any one day’s yield move mixes the FOMC minutes, that war premium, the deficit headlines, and ordinary auction cycle noise together. I read Thursday’s reversal as consistent with my thesis. Not as sole proof of it.
Third, on the inflation framing itself: headline CPI ran 3.4% for the twelve months through July. Core CPI, which strips out the energy prices the Iran war is directly distorting, ran 2.5%, only half a point above the Fed’s target (U.S. Inflation Calculator, citing BLS data). The persistent inflation in most of this week’s coverage is doing more work in headline than in core. That matters for how you read the Fed side of the story. The July 29 FOMC held rates at 3.5% to 3.75%, and three regional presidents, Beth Hammack, Neel Kashkari, and Lorie Logan, dissented because they wanted rates higher still (CNBC). CME’s own FedWatch pricing as of August 20 put roughly two thirds odds, 68.4% in one read, on the Fed simply holding at its next meeting, with cut odds close to zero (CME FedWatch via MacroMicro). Calling this a Fed divided on rate cuts overstates how close a cut actually is. The live division sits between holding and hiking. That’s a tighter, less friendly backdrop for the long end than a cut debate would be, because a hiking Fed and a Treasury trying to talk down long yields are pulling on opposite ends of the same curve. Two institutions, two directions.
What would change this view
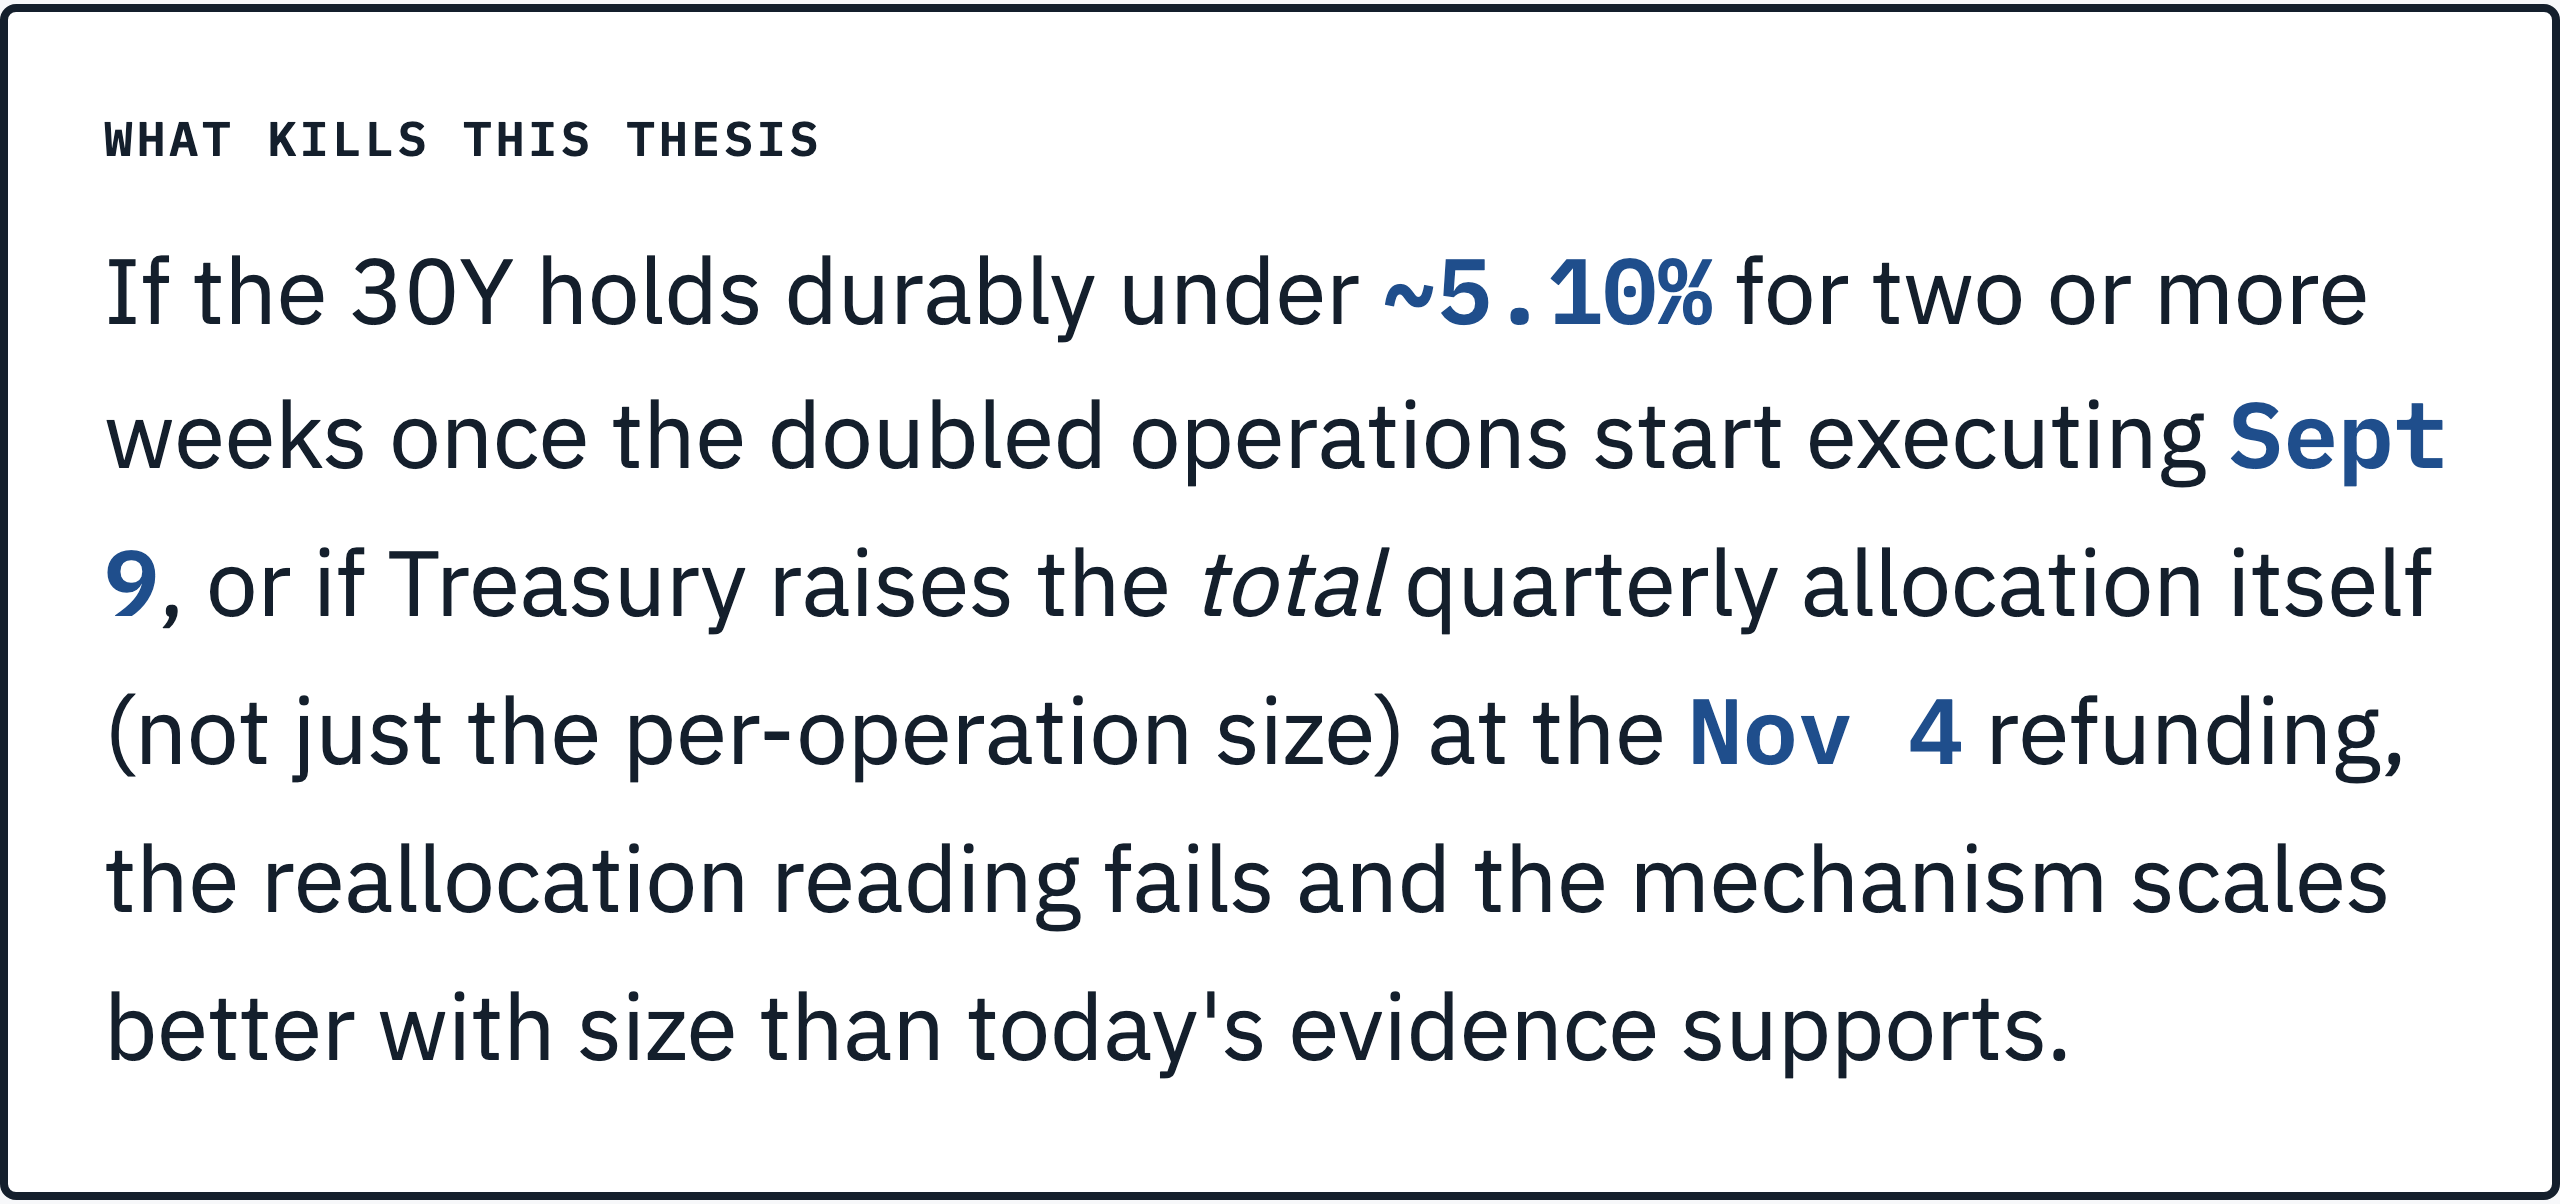
I want a falsifier a reader could check without me. If the 30 year holds durably under roughly 5.10%, sustained for two weeks or more, once the doubled operations actually start executing on September 9 rather than just on the announcement date, that beats what a liquidity premium mechanism this size should deliver on its own. I’d need to revisit whether Bessent’s tool carries more structural weight than the IMF’s effect size estimate suggests. I’d also update if Treasury’s own operation results, published after each buyback, show spread compression meaningfully larger than the roughly 0.2 basis point the smaller program produced. A third way this reading fails: if Treasury raises the total quarterly liquidity support allocation itself at the November 4 refunding, beyond the per operation size alone. That would mean the envelope was never really fixed, and the reshuffle argument would need to become an escalation argument. Either result would say the mechanism scales better with size than today’s evidence supports. One clean counterexample wouldn’t settle it. A pattern across the eight week window would. Eight weeks. One test.
What to watch instead of the headline number
Here’s what I’d actually do with this, for a desk that has to underwrite a view on long end rates over the next quarter and survive well past one week’s headlines. Don’t trade the announcement itself. That edge, if it ever existed, decayed inside one session, visible on the public tape with no proprietary data required. I’d watch the September 9 operation results first, directly. Treasury publishes accepted amounts and the securities purchased after each buyback, and a widening offered to accepted ratio would be the first real sign the tool is losing potency instead of compounding it. I turn that ratio into an actual screen, with the bands and the worked example, in the companion research note: The IMF Measured Bessent’s Buyback at 0.2 Basis Points. Watch auction tails and bid to cover ratios at the regular 10 year and 30 year refundings across the same window. Those tell you whether underlying demand for the debt Treasury still has to issue to fund the deficit, buyback or no buyback, is actually improving or just quiet for a week. And watch the fiscal consolidation plan Bessent has already promised for the days right after this piece goes up. That’s the real attempt at a structural fix, built from tariff revenue and expensing driven tax base growth on his own account, and it’s a fair, checkable test of whether this administration has a plan for the $3.18 billion a day problem beyond signaling.
I’d size any long end rate view around the fiscal plan and the auction calendar. The buyback ceiling is a secondary input at best. The buyback is real. It isn’t nothing. Dealers holding illiquid inventory are meaningfully better off with it than without it. Real, but small. It was never going to cap a 5.33% yield by itself, and by Thursday afternoon the market had already told you so.
So here’s the question I’d actually want a room of portfolio managers arguing about. If Bessent’s fiscal plan lands within days and still leaves the deficit anywhere near $2 trillion, does a Treasury Secretary with a trading book’s instincts have any tool left that isn’t, in the end, another liquidity operation wearing a bigger number?
Related reading, and where to go next
I’ve written about crowding and forced flows in this same market before, from different angles: Moderna’s record squeeze the same week the buyback landed, and on the mechanics behind the yield itself, The Federal Reserve Publishes Two Term Premium Estimates. Same curve, different pressure points.
📊 The Decision-Grade Version
This piece is complete on its own. The thesis, the evidence, and what would kill the view are all above, and nothing was held back to sell you a next step.
The Patreon note is a separate piece of work rather than a deeper cut of this article. It takes one trade from inside this story, i.e. the oversubscription ratio Treasury’s own buyback data already publishes, and writes it the way a desk would act on it: the position, the levels, the sizing, and the risk that would take it off. Written for people who put capital behind a view.
→ Read the Bessent buyback screen trade note
→ Or join the Patreon community for every note
Follow along on YouTube and LinkedIn for more of this.
Cover photograph: Mathias Beinling, CC BY-SA 4.0, via Wikimedia Commons.