


This is a detailed research piece. If you find value in institutional-quality hedge fund analysis, support this work on Patreon.

Man AHL converts persistent market anomalies into $1.5 billion annual revenue through systematic trend-following, disciplined execution, and structural moats built over 37 years. With $168.6 billion AUM (as of FY2024) and operations across hundreds of liquid markets globally, the firm demonstrates that scale, far from eroding returns, amplifies edge when execution infrastructure is sufficiently sophisticated.
Revenue Architecture: Fee Crystallization at Scale
Core Economics (FY2024, as of December 31, 2024)
Management fees: $1,097M (1.5–3% of AUM, accrued daily)
Performance fees: $310M (20% above high-water mark)
Total revenue: $1,459M
AUM: $168.6B
Performance fees surged 72% year-over-year despite $3.3B net outflows. This proves alpha generation, not asset gathering, drives marginal profitability. The fee structure ensures base profitability independent of performance while crystallizing gains above investor hurdles.
Source: Man Group FY2024 Results
The Alpha Engine: Behavioral Arbitrage at Institutional Scale
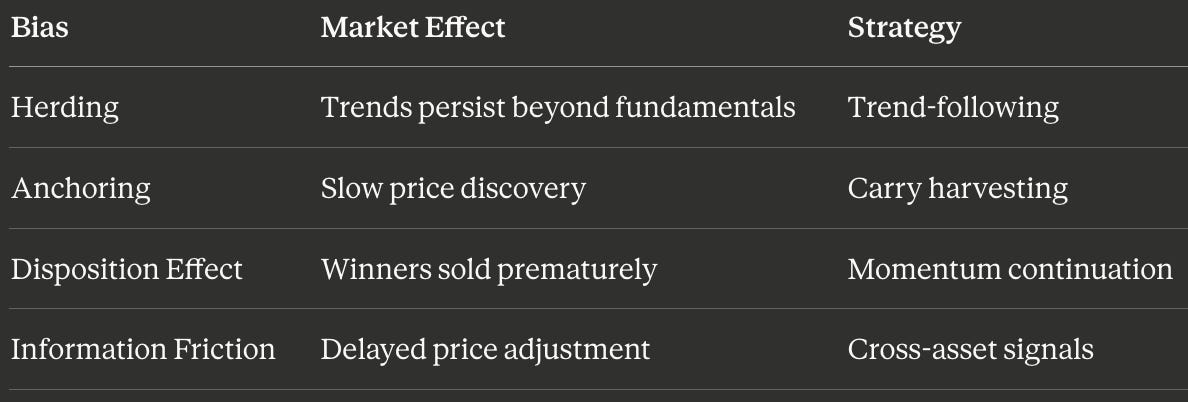
Man AHL’s thesis: human behavioral biases create tradeable inefficiencies that persist because they’re structural, not informational.
Primary Signal Architecture: EWMA Crossovers
The foundation remains double exponentially-weighted moving average (EWMA) systems. These have held the greatest risk allocation since 1987:
Signal_t = EWMA_fast(P_t) - EWMA_slow(P_t)
Position = Signal_t / σ_target × Risk_weight
Man AHL operates a suite of EWMA models at multiple speeds:
Fast models: Capture trend emergence, higher turnover, elevated transaction costs
Slow models: Reduce whipsaws but lag reversals
The critical insight: faster speeds generate superior crisis alpha despite higher costs. During the worst S&P 500 quintiles, fast trend systems deliver maximum convexity. This provides portfolio insurance when it matters most.
Source: Man AHL Research — The Need for Speed
Behavioral Exploitation Framework
Investment Programs: Tiered Strategy Deployment
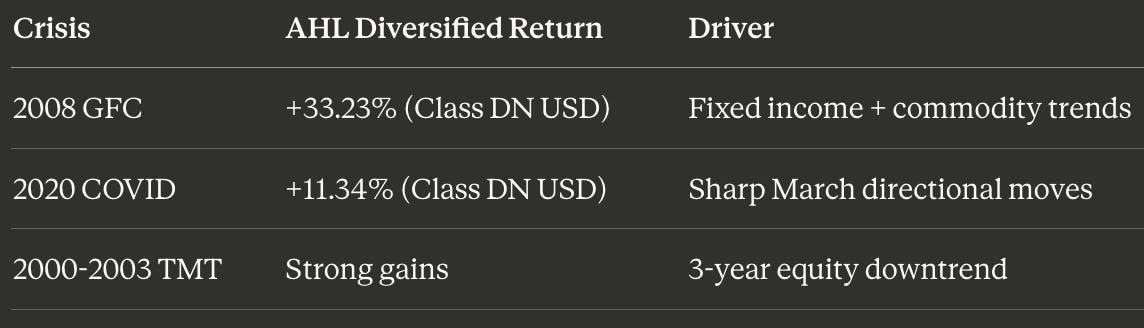
AHL Diversified: Pure momentum across approximately 400 liquid futures and FX markets. Returned 33.23% in 2008 during GFC (Class DN USD), 11.34% in 2020 during COVID (Class DN USD). Historical Sharpe 0.86 with -17.9% maximum drawdown (1996–2009).
AHL Evolution: Non-traditional market specialist. Returned 374% from September 2005 to September 2017 vs. 28% for BTOP50 index by expanding into corporate credit, EM debt, European electricity, and volatility indices. 2012 alone: 23.6% return.
AHL Dimension: Multi-strategy combining technical (short-term seasonality), fundamental (FX/fixed income carry), and momentum (2–3 month persistence) signals. Holding periods: days to 6 months.
Sources:
Portfolio Construction: Risk Parity + Volatility Targeting
Man AHL integrates three layers:
Risk Parity: Equal risk contribution per asset (Position ∝ 1/σ_asset)
Volatility Targeting: Constant portfolio volatility via dynamic leverage
Regime Adjustment: Scale exposure inversely to realized volatility
Volatility targeting increases Sharpe ratios by 10% (1.62 → 1.79) while reducing negative skewness, according to Man AHL’s framework. The mechanism: lever up in low-volatility regimes, de-risk in high-volatility periods.
Source: Man Group Risk Management Research
Market Expansion: The Primary Alpha Source
Man AHL trades across hundreds of markets spanning:
Traditional futures (equity indices, rates, commodities)
FX (G10 + EM currencies)
OTC (swaps, credit indices, EM debt)
Cash equities (sector baskets)
Alternative assets (European electricity, volatility indices, iron ore, coal)
AHL Diversified alone accesses approximately 400 liquid markets. Across all Man AHL programs (Evolution, Dimension, Alpha), the firm’s market universe extends to additional non-traditional venues not accessible via standard futures exchanges.
Critical Insight: Man AHL prioritizes market expansion over model optimization. New markets provide low-correlation exposures that traditional CTAs cannot access. Evolution’s 374% return (2005–2017) demonstrates this edge: exploiting trends in Brazilian interest rates, Korean won, and credit indices while competitors remained constrained to liquid futures.
Execution: From Cost Center to Profit Driver
Man AHL’s execution infrastructure:
Proprietary + third-party algorithms: Multiple routes compete for order flow
Dynamic algo selection: ML-based routing adapts to real-time market conditions
Massive data processing: According to firm interviews, processes billions of market data ticks daily for order book modeling
Competitive benchmarking: Winning routes earn larger allocations
Transaction Cost Edge: Illustrative math: at $168B AUM, even a 2–5bps improvement yields $35–85M annual savings. Man reports materially lower transaction costs versus typical bank algorithms (firm internal analysis). This execution advantage compounds across:
Algorithms tuned to systematic trading patterns
Flow disguising to minimize high-frequency predation
Cross-asset execution optimization
Advanced Research: Expected Future Flow Shortfall (EFFS)
Man AHL developed EFFS to quantify “hidden slippage”: the impact of previous trades on subsequent decision prices. Traditional metrics understate costs when sequential orders are correlated. Strategic execution trajectories optimize trade sequences, not just individual orders.
Sources:
The Oxford-Man Institute Edge
Since 2007, Man Group has committed £30M+ to the Oxford-Man Institute (OMI), creating a research pipeline unavailable to competitors.
Physical Advantage: OMI and Man AHL’s Oxford Research Lab share Eagle House. This enables direct research-to-production pipelines with 20+ machine learning researchers.
Research Applications:
Deep learning for time-series forecasting
NLP for central bank speech sentiment extraction
Reinforcement learning for optimal execution
Graph ML for lead-lag detection
Bayesian ML for uncertainty quantification
Recent publications include “Deep Learning for Options Trading,” “Detecting Lead-Lag Relationships in Stock Returns,” and “Correlation Matrix Clustering for Statistical Arbitrage.”
Sources:
Crisis Alpha: The Convexity Premium
Man AHL strategies exhibit positive skew during equity drawdowns:
2024–2025 Challenges: Rapid trend reversals devastated returns:
AHL Trend Alternative: -12.77% (YTD through October 2024)
AHL Evolution: -6.1% (2024 full year)
Industry-wide trend-following headwinds from bond market whipsaws
The mechanism: trend-following profits from sustained directional moves. Crises produce persistent trends as capital flees risk assets. This generates negative equity correlation, effectively providing portfolio insurance that allocators pay for through management fees even during flat periods.
Sources:
Risk Management: Independent Infrastructure
Man AHL’s risk architecture (operational since 1987):
Independent risk team: Separate from portfolio management
Darrel Yawitch (CRO): Oversees Man AHL + Man GLG risk
Proprietary systems: 37 years of analytics development
Drawdown modeling: Probability-based risk reduction triggers
Rosa platform: Central operational system for trade execution and risk monitoring
Source: Man AHL Official Risk Management
Why the Edge Persists
Structural Moats:
Behavioral persistence: Herding and anchoring are hardwired human biases
Infrastructure moat: 37 years of execution optimization cannot be replicated overnight
Capacity constraints: Finite capacity before market impact erodes returns
Oxford partnership: Proprietary academic research pipeline
Risk tolerance mismatch: Most allocators cannot endure 15–20% drawdowns
Market expansion: Continuous access to non-traditional venues
The managed futures industry ($300B AUM) remains small versus financial markets. This means insufficient scale to arbitrage away opportunities. Man AHL’s continuous market expansion (iron ore, coal, EM interest rate swaps, European electricity) creates new alpha sources faster than existing ones decay.
The Business Model Verdict
Man AHL monetizes behavioral finance at institutional scale through:
Management fees ($1.1B) ensuring base profitability
Performance fees ($310M) capturing alpha generation
Crisis convexity creating institutional demand
Execution edge compounding small advantages across $168B
Key Insight: The 2024 performance challenges (-12.77% YTD for Trend Alternative) didn’t prevent profitability. The fee structure crystallizes gains during winning periods while maintaining revenue during drawdowns. This creates asymmetric capture for the manager with symmetric risk for the investor.
For quantitative researchers: edge = (signal × execution × risk tolerance) — behavioral decay. Man AHL’s 37 years of systematic infrastructure creates compounding advantages that new entrants cannot easily replicate, even as path-dependent risk proves irreducible.
Working Sources
Man Group FY2024 Financial Results: https://www.research-tree.com/newsfeed/article/man-group-plc-final-results-2746060
Man AHL 30-Year History: https://thehedgefundjournal.com/man-ahl-marks-30-years/
AHL Evolution Performance: https://thehedgefundjournal.com/ahl-evolution/
Trend-Following Speed Research: https://hedgenordic.com/2023/03/the-need-for-speed-in-trend-following-strategies/
Oxford-Man Institute Partnership: https://oxford-man.ox.ac.uk/who-we-are/man-group/
OMI Machine Learning Focus: https://eng.ox.ac.uk/news/man-group-extends-oxford-man-institute-funding/
Man AHL Execution Infrastructure: https://www.globaltrading.net/the-fastest-man-at-man-2/
2024 Performance Challenges: https://www.hedgeweek.com/man-groups-trend-tracker-facing-one-of-its-toughest-years-on-record/
Historical Performance Data: https://finance.yahoo.com/quote/0P0000141X/performance/
Man Group Earnings Call: https://ca.finance.yahoo.com/news/man-group-plc-mngpf-q4-210323738.html
Man AHL Official Page: https://www.man.com/ahl
Man Institute Research: https://www.man.com/maninstitute
AHL Diversified Product Documentation: https://tisegroup.com/(Market count varies by program: AHL Diversified ~400 markets)
📊 Support this research: https://www.patreon.com/c/NavnoorBawa
Cover photograph: Robert Lamb, CC BY-SA 2.0, via Wikimedia Commons.