



Hudson River Trading’s London company stopped saying where it trades in 2025, the year its trading income doubled. Its 2024 accounts said it “trades securities in the United Kingdom and European markets”; its 2025 accounts say “trades securities.” That deletion surprised me, in the year trading income went from £50.9m to £106.6m, and the filing gives no reason.
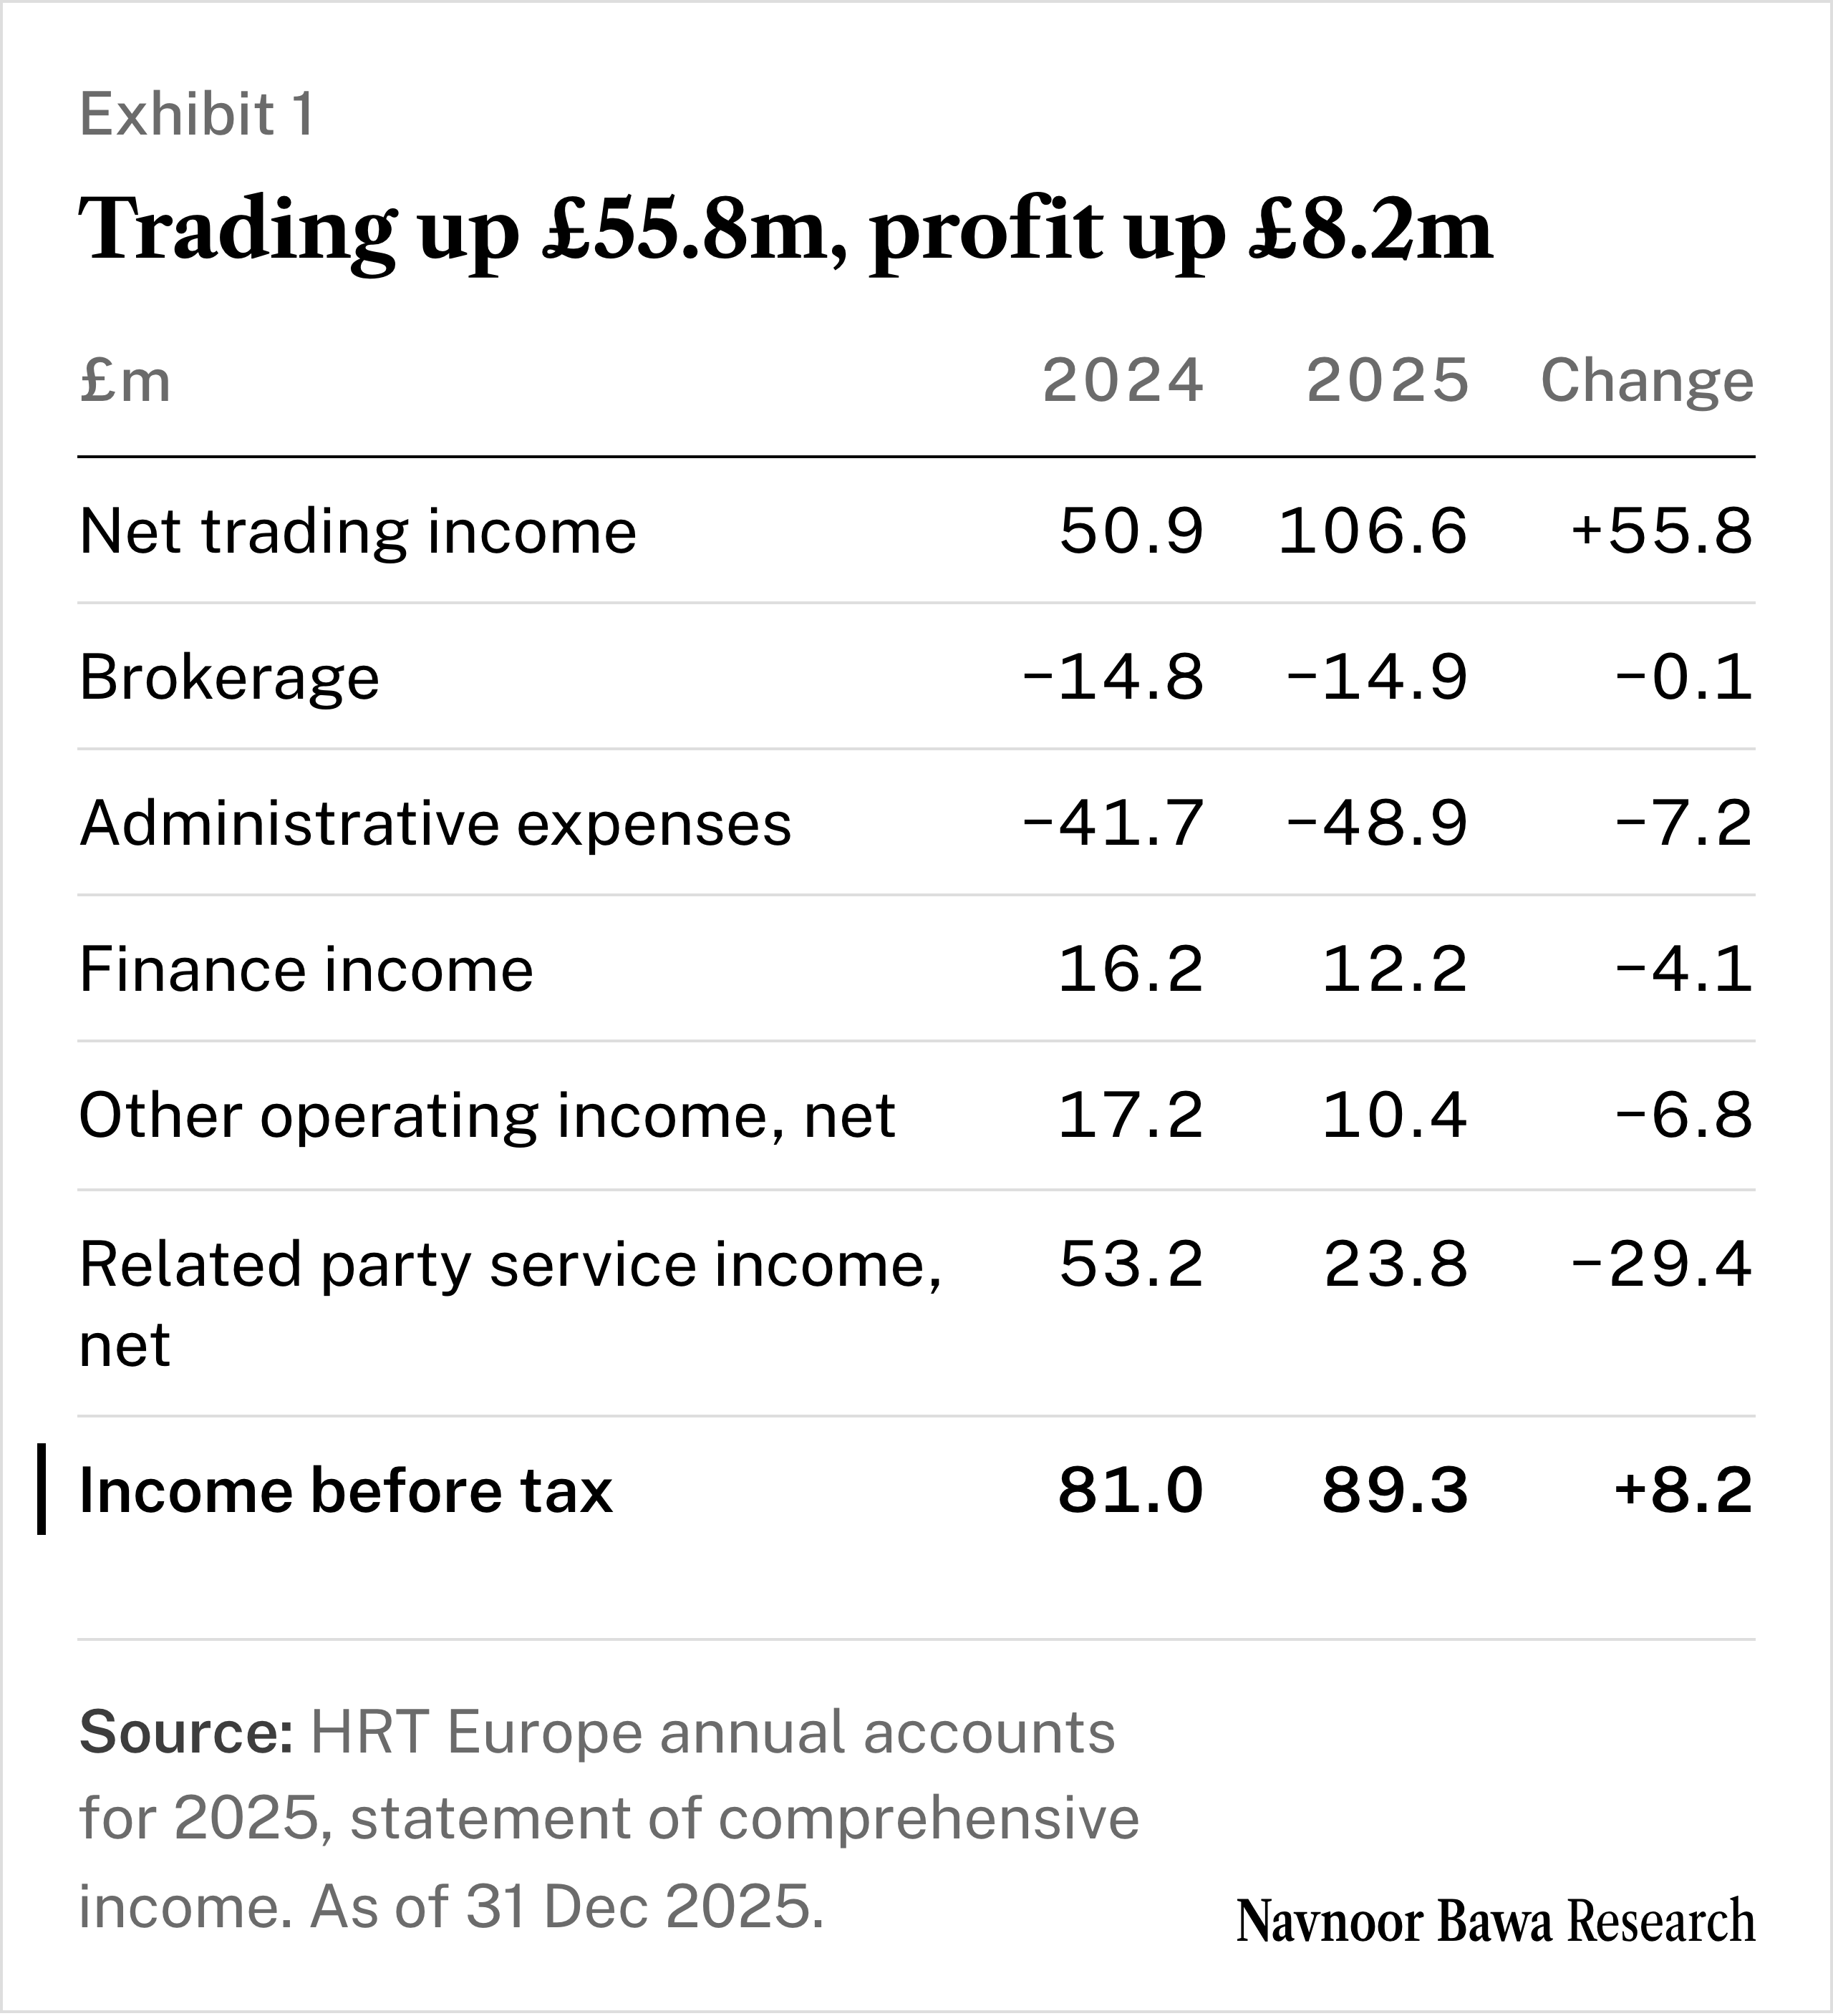
Trading did double, to £106.6m, yet income before tax rose only a tenth, to £89.3m. I read the largest piece of the gap as net related party service income, which fell £29.4m. It is the net of fees Hudson River Trading Europe Ltd (HRT Europe) and its affiliates charge each other, and its 2026 accounts will show whether it stays down.
The paid half settles whether to weigh HRT Europe’s profit at its printed size or at the remainder, what is left once that net service line and the interest on the loan to its parent are set aside. The paid half gives my odds and the remainder.
Trading doubled, profit rose a tenth
I rebuilt HRT Europe’s income statement for 2023, 2024 and 2025 as a stack that ties to its printed income before tax to the pound; no filing prints that split. The obvious reading of a market maker, a firm that quotes both buy and sell prices, is that its profit is its trading, and it has a real point, because the trading line did double. Here is where the doubling went.
Source: HRT Europe annual accounts for 2025, statement of comprehensive income · as of 31 December 2025
Trading gave £55.8m, and the fall in the service line offset more than half of it. Profit’s rise fell £47.5m short of trading’s, and that line is 62% of the shortfall.
Hudson River Trading’s London company doubled its trading income and its profit rose a tenth, while its net related party service income fell by £29.4m.
The directors measure the business on trading too: their key indicator, net trading income less brokerage (commissions and the dealing fees third parties charge), rose from about £36m to about £92m. Their account of the year is brief: “The year-over-year changes are driven by existing market conditions and operations. The directors are satisfied with the results for the year.” It does not mention the services agreements, the contracts under which group companies sell each other services and which price the line that moved second most.
That line is a net. HRT Europe both provides services to its affiliates and receives services from them, so a fall can mean less income from the group or larger charges from it, and the accounts print only the result. The line, which its 2022 accounts called service revenue, ran between £39.6m and £65.0m from 2021 to 2024, then fell 55.2% in 2025.
The reading that the doubling is the profit predicts income before tax rising about as much as trading. It kept about 15 pence of each extra pound of trading income, so the walk refutes it.
Trading and the line also move against each other. In each of the four filed steps from one year to the next, they moved in opposite directions, with a correlation of −0.83 over the five yearly levels and −0.31 with 2025 left out. In 2024 the line moved by only £2.0m, so that step is opposite in sign alone.
Four steps and five points are thin, though: if the five service line values were shuffled across the five years, 9 of the 120 possible orders, the observed one included, would show a correlation at least as negative as −0.83. So a fall in the line may be the fee balancing trading instead of a repricing.
The trading line itself carries market risk: note 14 prints £16.1m as the net price risk from a 10% move in market prices, 18% of 2025 income before tax; the directors call that risk immaterial.
Anyone sizing HRT’s European business off this company is sizing, in part, a figure that rests on services agreements with its parent and affiliates.
The service line: 21 staff, a flagged estimate, no named payer
Note 8 of the 2025 accounts says HRT Europe employed an average of 21 people in 2025, down from the 96 its 2022 accounts print for that year. Wages came to £30.8m, about £1.47m a head on the company’s own count, the figure a pay story on efinancialcareers of 23 September 2026 also printed for HRT Europe.
A sister company, HRTSVC Ltd, the group’s services company at the same London address, reports 122 average employees on its group accounts, up from 102. Payroll fell from 96 to 21 in three years while trading income doubled in the last of them. Either HRT Europe relies on affiliates for labour, does the work with fewer people or pays those it keeps more; the accounts do not say which.
The £7.2m rise in administrative expenses is more than accounted for by payroll: employee benefits, which sit inside that line, rose £7.9m. A company leaning on another company’s staff would pay for them through the net service line, and that line is where the London accounts are hardest to read.
Note 23 describes it in one sentence: the company “provides and receives trade execution, facilitation and operational and other support services to and from affiliate companies.” Most of the £23.8m is service fees; the rest is not itemised.
The directors flag the line themselves. Note 4 says they “consider the fair value measurement and valuation processes, and the application of services agreements with the Company’s parent and affiliates to be material estimates”. The strategic report names market conditions; the accounting estimates note names the agreements.
A London peer prints a sharper warning. Transfer pricing is the setting of prices between companies of one group. At Jane Street Europe Ltd, whose accounts we read in how Jane Street pays its London market, the auditor KPMG wrote for 2025: “On this audit we do not believe there is a fraud risk related to trading revenue because of the nature of the transfer pricing arrangements used by the Company, as well as the systemised nature of trading revenue streams … we have identified a fraud risk over the transfer pricing arrangements.”
HRT Europe’s auditor, Ernst & Young in Dublin, names no such risk. That is not evidence either way: these are different companies with different auditors. On the units both print, HRT Europe’s income before tax was 37.8% of closing equity in 2025, against 19.3% for Jane Street Europe’s group, which reports in dollars. The comparison tests units across two currencies and two bases and says nothing about skill.
One more pair of lines bears on the fall. HRTSVC’s group net service revenue rose £74.4m, to £158.9m, and HRT Europe’s payables to group companies rose from £0.13m to £2.68m. Both are consistent with the fall, but both are net and name no counterparty, so the accounts do not say which flow moved or who paid whom.
Who is on the other side of the service line? Note 23 gives the nearest answer. Income from the services agreements makes up the majority of the £9.5m HRT Europe is owed by its parent, Hudson River Trading LLC, and of the £2.6m that group undertakings it does not name owe it, at 31 December 2025. A year earlier the balances were £11.1m and £7.5m. Those are year-end balances against a year’s flow, and no filing splits the £23.8m by payer.
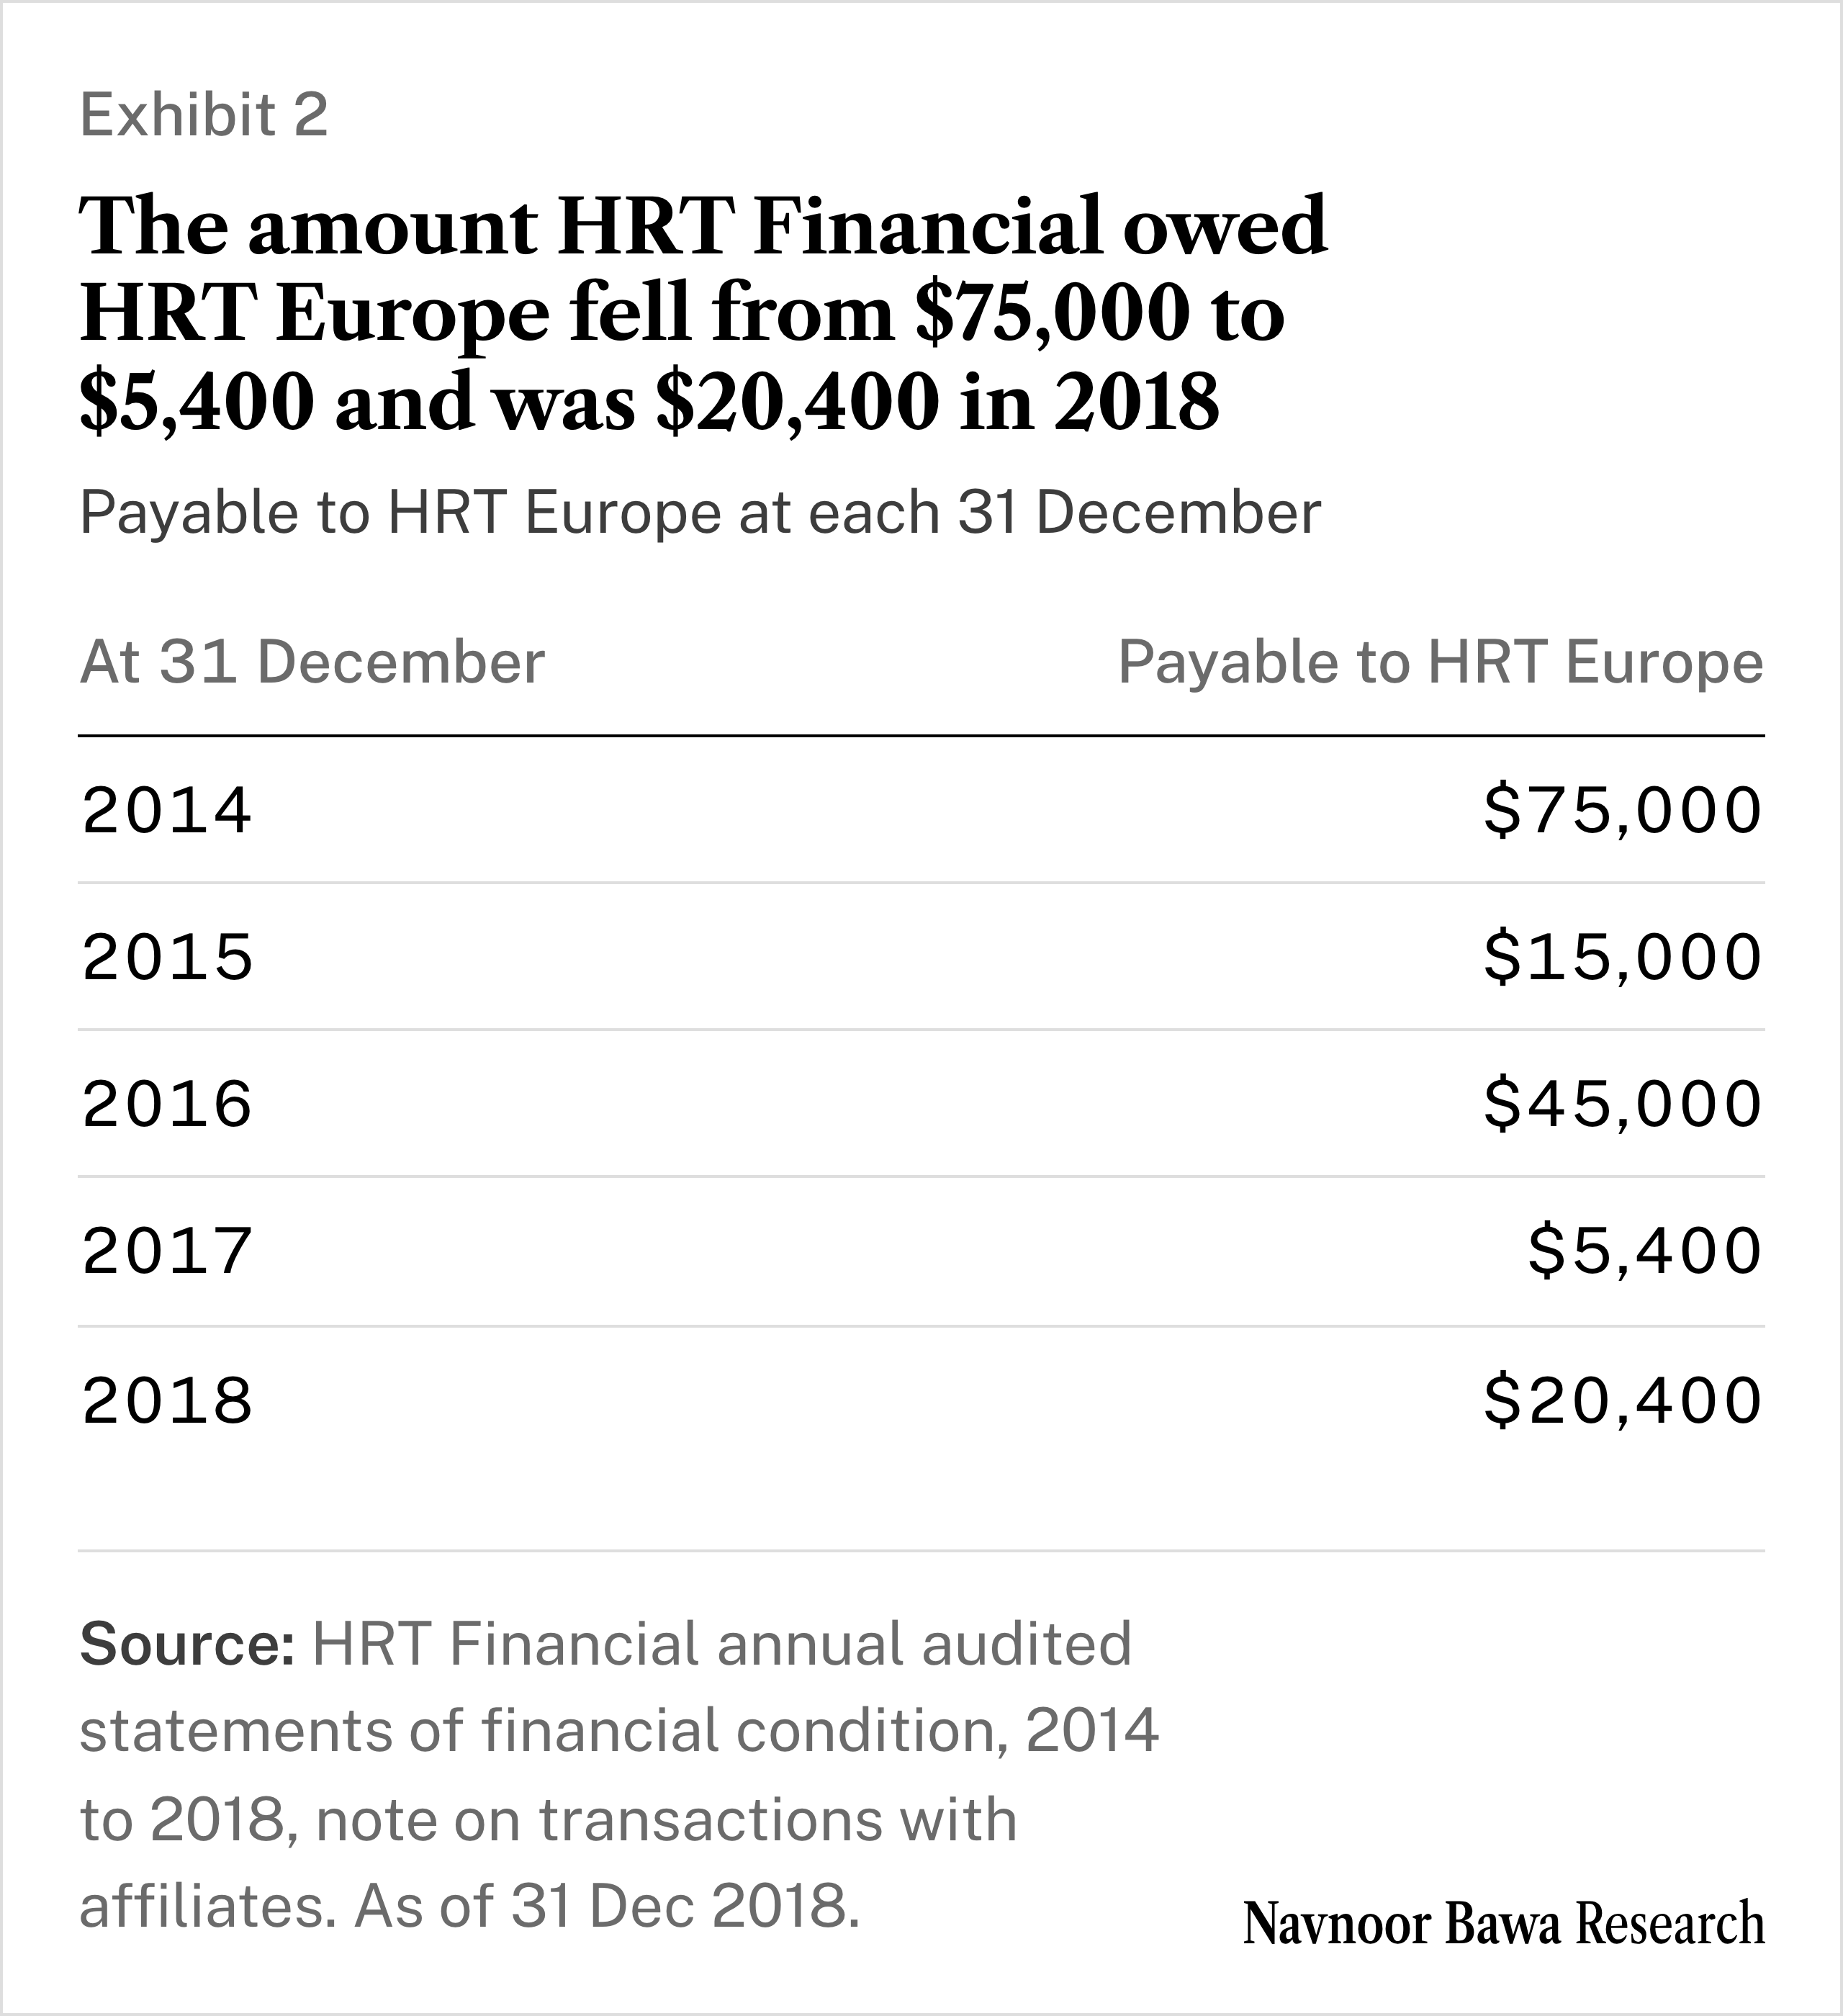
The US dealer is the one affiliate the filings name. HRT Financial LLC, now HRT Financial LP, is the group’s US dealer and the subject of our read of how Hudson River Trading beat Goldman’s. Its audited statements for 2014 to 2018 name HRT Europe as an affiliate under a services and expense agreement that “covers support services provided by HRTE employees”. Exhibit 2 sets out the amount payable to HRT Europe at each year end.
Source: HRT Financial annual audited statements of financial condition, 2014, 2015, 2016, 2017 and 2018, note on transactions with affiliates
The dealer’s statements for 2021 to 2025 do not name HRT Europe, and its 2025 statement describes agreements only with Hudson River Trading LLC, its 98% owner, and a loan from its parent. Its 2019 and 2020 filings are single pages with no notes. Balances of tens of thousands of dollars say nothing about a £23.8m flow, so the filings name no counterparty for the 2025 line beyond the parent and unnamed affiliates, and no document says why it fell. The board that signs HRT Europe’s estimates has three directors, meets quarterly and approved the 2025 report on 21 April 2026.
Owners took £294.6m out and put £173.9m in
HRT Europe has sent money to its owners in four of the last five years. Three times it handed back share capital, money the owners had paid in: £36.9m in 2021, £102.7m in 2023 and £100.0m in 2024. The 2025 accounts show its first dividend in five years of accounts, a payout from profit of £55.0m or 220 pence a share, 81.6% of net income. The total, £294.6m, is 1.25 times the £236.4m of equity left at the end of 2025.
Owners also paid in £173.9m of share capital, £144.2m in 2021 and £29.7m in 2022, so net of that £120.7m went out, 0.51 times the equity left.
The accounts state no dividend restriction; the only related text is the Financial Conduct Authority’s requirement that the company keep adequate financial resources, so the payout’s size is a group choice as much as a measure of earnings.
Money also goes the other way. HRT Europe holds a note from its parent, Hudson River Trading LLC, paying SOFR, the US overnight secured rate, plus 1.25%, repayable on demand and renewed each year. The interest is booked in finance income and disclosed in note 23; it is a return on London’s own cash.
In 2024 London withdrew £100.0m; the parent note returned a net £29.6m that year, and the company’s cash fell £56.2m. In 2025 the parent returned a net £2.2m. HRTSVC took in £539.4m of new share capital in 2025, and its accounts do not say who subscribed it. HRT Europe’s £55.0m dividend went to its own parent, so the filings show no net direction of capital across the UK companies.
Cash moves both ways, then: net of what owners paid in, £120.7m has gone out. Part of what stays is lent back to the parent, so I weigh London’s profit by what remains once the group’s own lines are set aside.
→ Hudson River Trading Europe’s equity book at each of five year ends, rebuilt from its filed accounts with the data in a spreadsheet, Trade File No. 18 on Patreon.
How much of HRT Europe’s £89.3m is left once the group’s two disclosed lines are set aside?
Below the paid line:
The verdict, with my odds on whether the remainder repeats, and the model that prices London’s 2026 profit.
The book of record: three filed income statements in one stack, tied to each printed profit.
What this changes: a three-step test for any other firm, and the three dated checks that would prove me wrong.