


On 19 August the Treasury said it would increase, “by at least double,” the size of its liquidity support buybacks in the ten to twenty and twenty to thirty year sectors, from $2 billion per operation to “at least $4 billion.” A liquidity support buyback is Treasury paying cash to dealers for old, illiquid bonds it already owes on, at prices the dealers name and Treasury can refuse. The change is effective 9 September and runs through the 4 November refunding (Treasury). Within five days two of the most serious people in this market had called it a mistake.
They’re both right about the intent. I think they’re both looking at the wrong side of the trade, and there’s a paper that says the mechanism is a third thing again.
Below the paid line: the full 22 operation table for 2026 printed row by row · the constant cap experiment, five sectors at an identical $4bn ceiling with cover from 1.3x to 11.0x · Nohshad Shah’s 13% recomputed against Treasury’s own auction table, and the IMF paper underneath the argument · the three readings of the 10 September print, each with the offer number that distinguishes it · the two operations where Treasury refused to fill, and what the curve did the next morning.
Druckenmiller argues dysfunction. Shah argues duration.
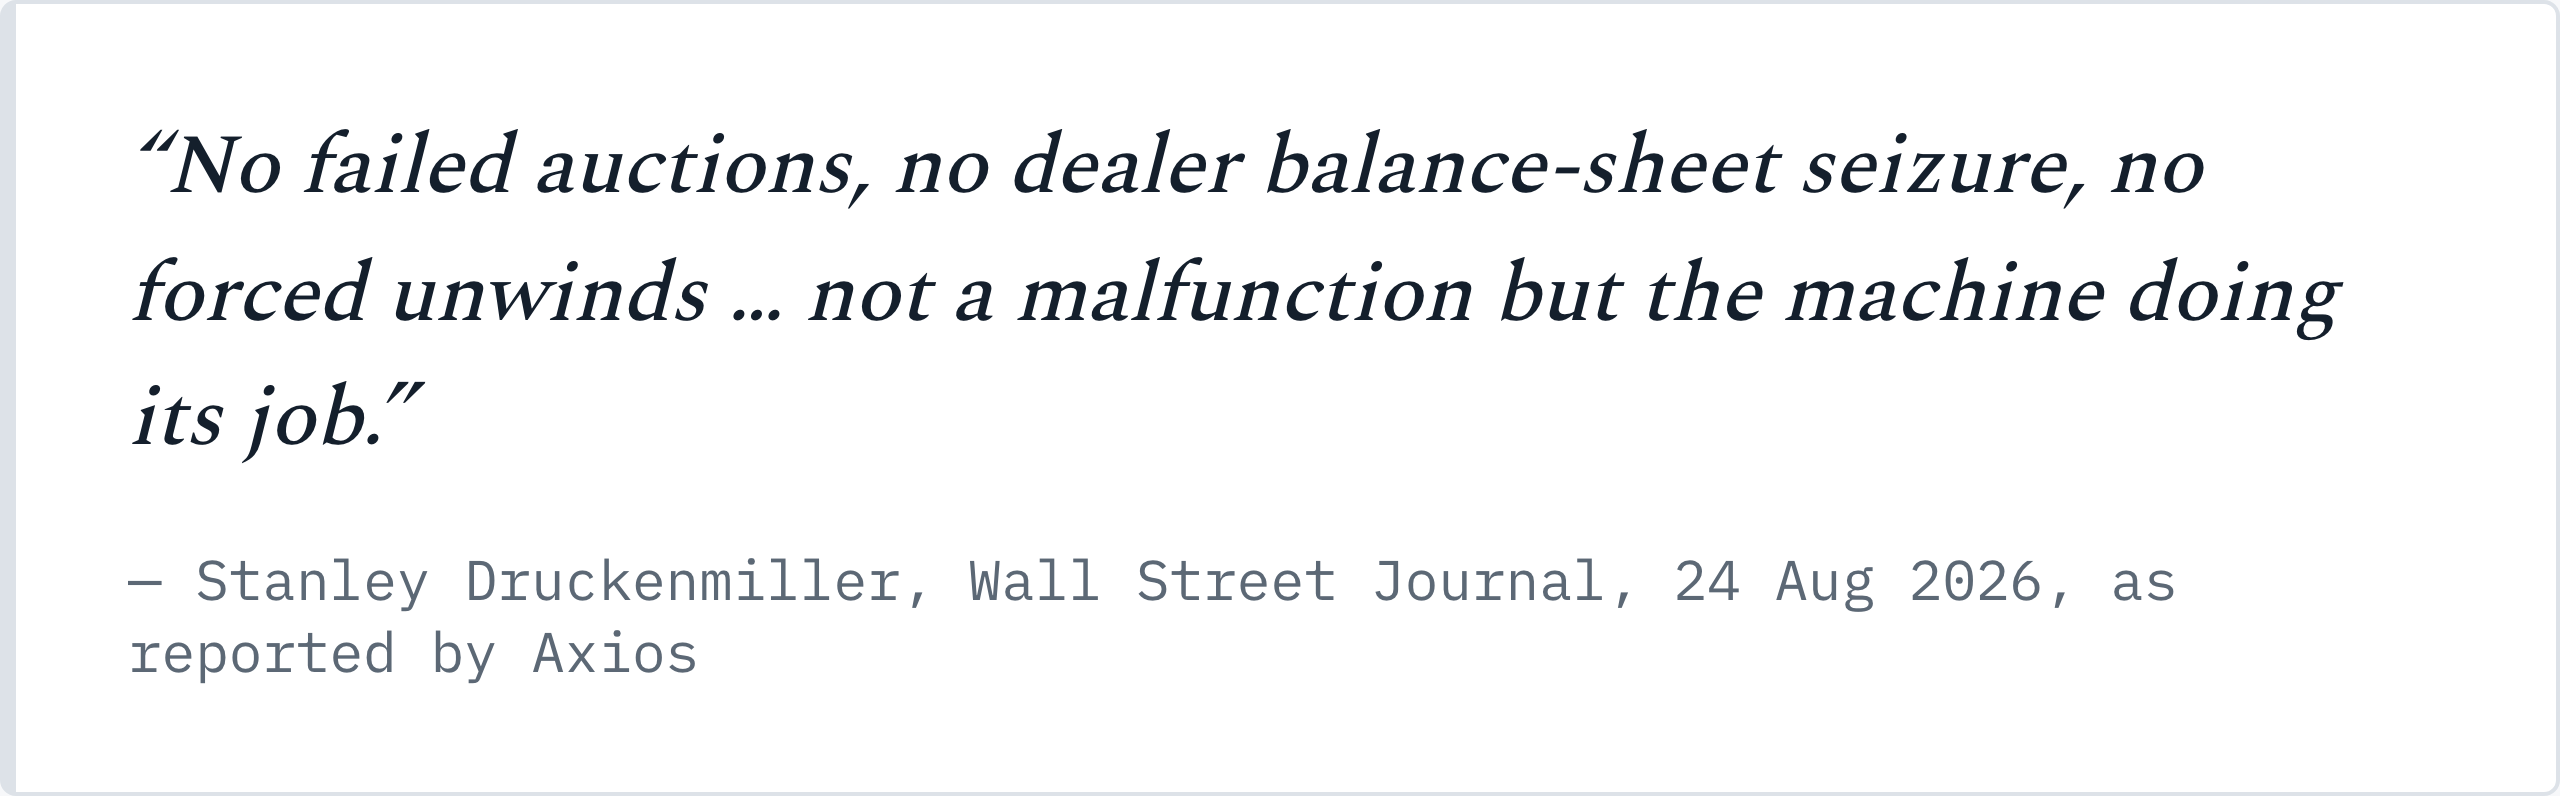
Stanley Druckenmiller ran the argument from dysfunction. His Wall Street Journal opinion piece of 24 August, behind that paper’s paywall, says there were “no failed auctions, no dealer balance-sheet seizure, no forced unwinds,” and that trading was orderly, “not a malfunction but the machine doing its job.” I’m quoting it as reported (Axios), not from the original. His conclusion follows cleanly. With no dysfunction to fix, the operation was price management wearing a liquidity label.
Nohshad Shah at Citadel Securities ran it from duration. His note is public and worth reading in full (Citadel Securities). One thing worth clearing up, since the obvious cheap shot is wrong: Citadel Securities is not among the twenty five firms on the New York Fed’s primary dealer list, so it cannot offer into these operations at all. Whatever else his note is, it isn’t a man talking his book into a window he stands at.
I wrote up the doubling itself when it was announced, and that arithmetic still holds (Bessent Doubled the Buyback).
Shah counted seven operations left on the schedule, put the incremental capacity at “at least $14bn,” and called that “around 13% of expected quarterly 20y and 30y issuance.” He declined the easy QE framing, because purchases financed by bills leave the debt stock where it was. “The cleanest framing is a Treasury-led Operation Twist, broadly liquidity neutral, but nowhere close to duration neutral.” Financial repression, in his phrase, “at the margin.”
I recomputed both halves before leaning on them. Treasury’s August refunding statement sets twenty and thirty year auction sizes at $16bn and $25bn for August, then $13bn and $22bn for September and October. That totals $111bn, and fourteen over 111 is 12.6%. His 13% holds, and the tentative schedule gives exactly the seven operations he counted.
Both men did the work. My problem is that neither opened the file that answers the question they were arguing about.
The offer column: $520 billion submitted, $42 billion accepted
I expected the interesting number to sit on Treasury’s side of the ledger, because that is the side both critiques argue about. It isn’t there. The number I wanted sits one column to the left.
Every buyback is two sided and Treasury publishes both sides. Dealers submit the par they wish to sell, at prices they choose; Treasury announces what it took. That offer number costs nothing, publishes the same day, and runs back to 2024.
Here is every long end operation of 2026. Twenty two of them, offered against accepted, with cover as a multiple of the cap Treasury set itself.
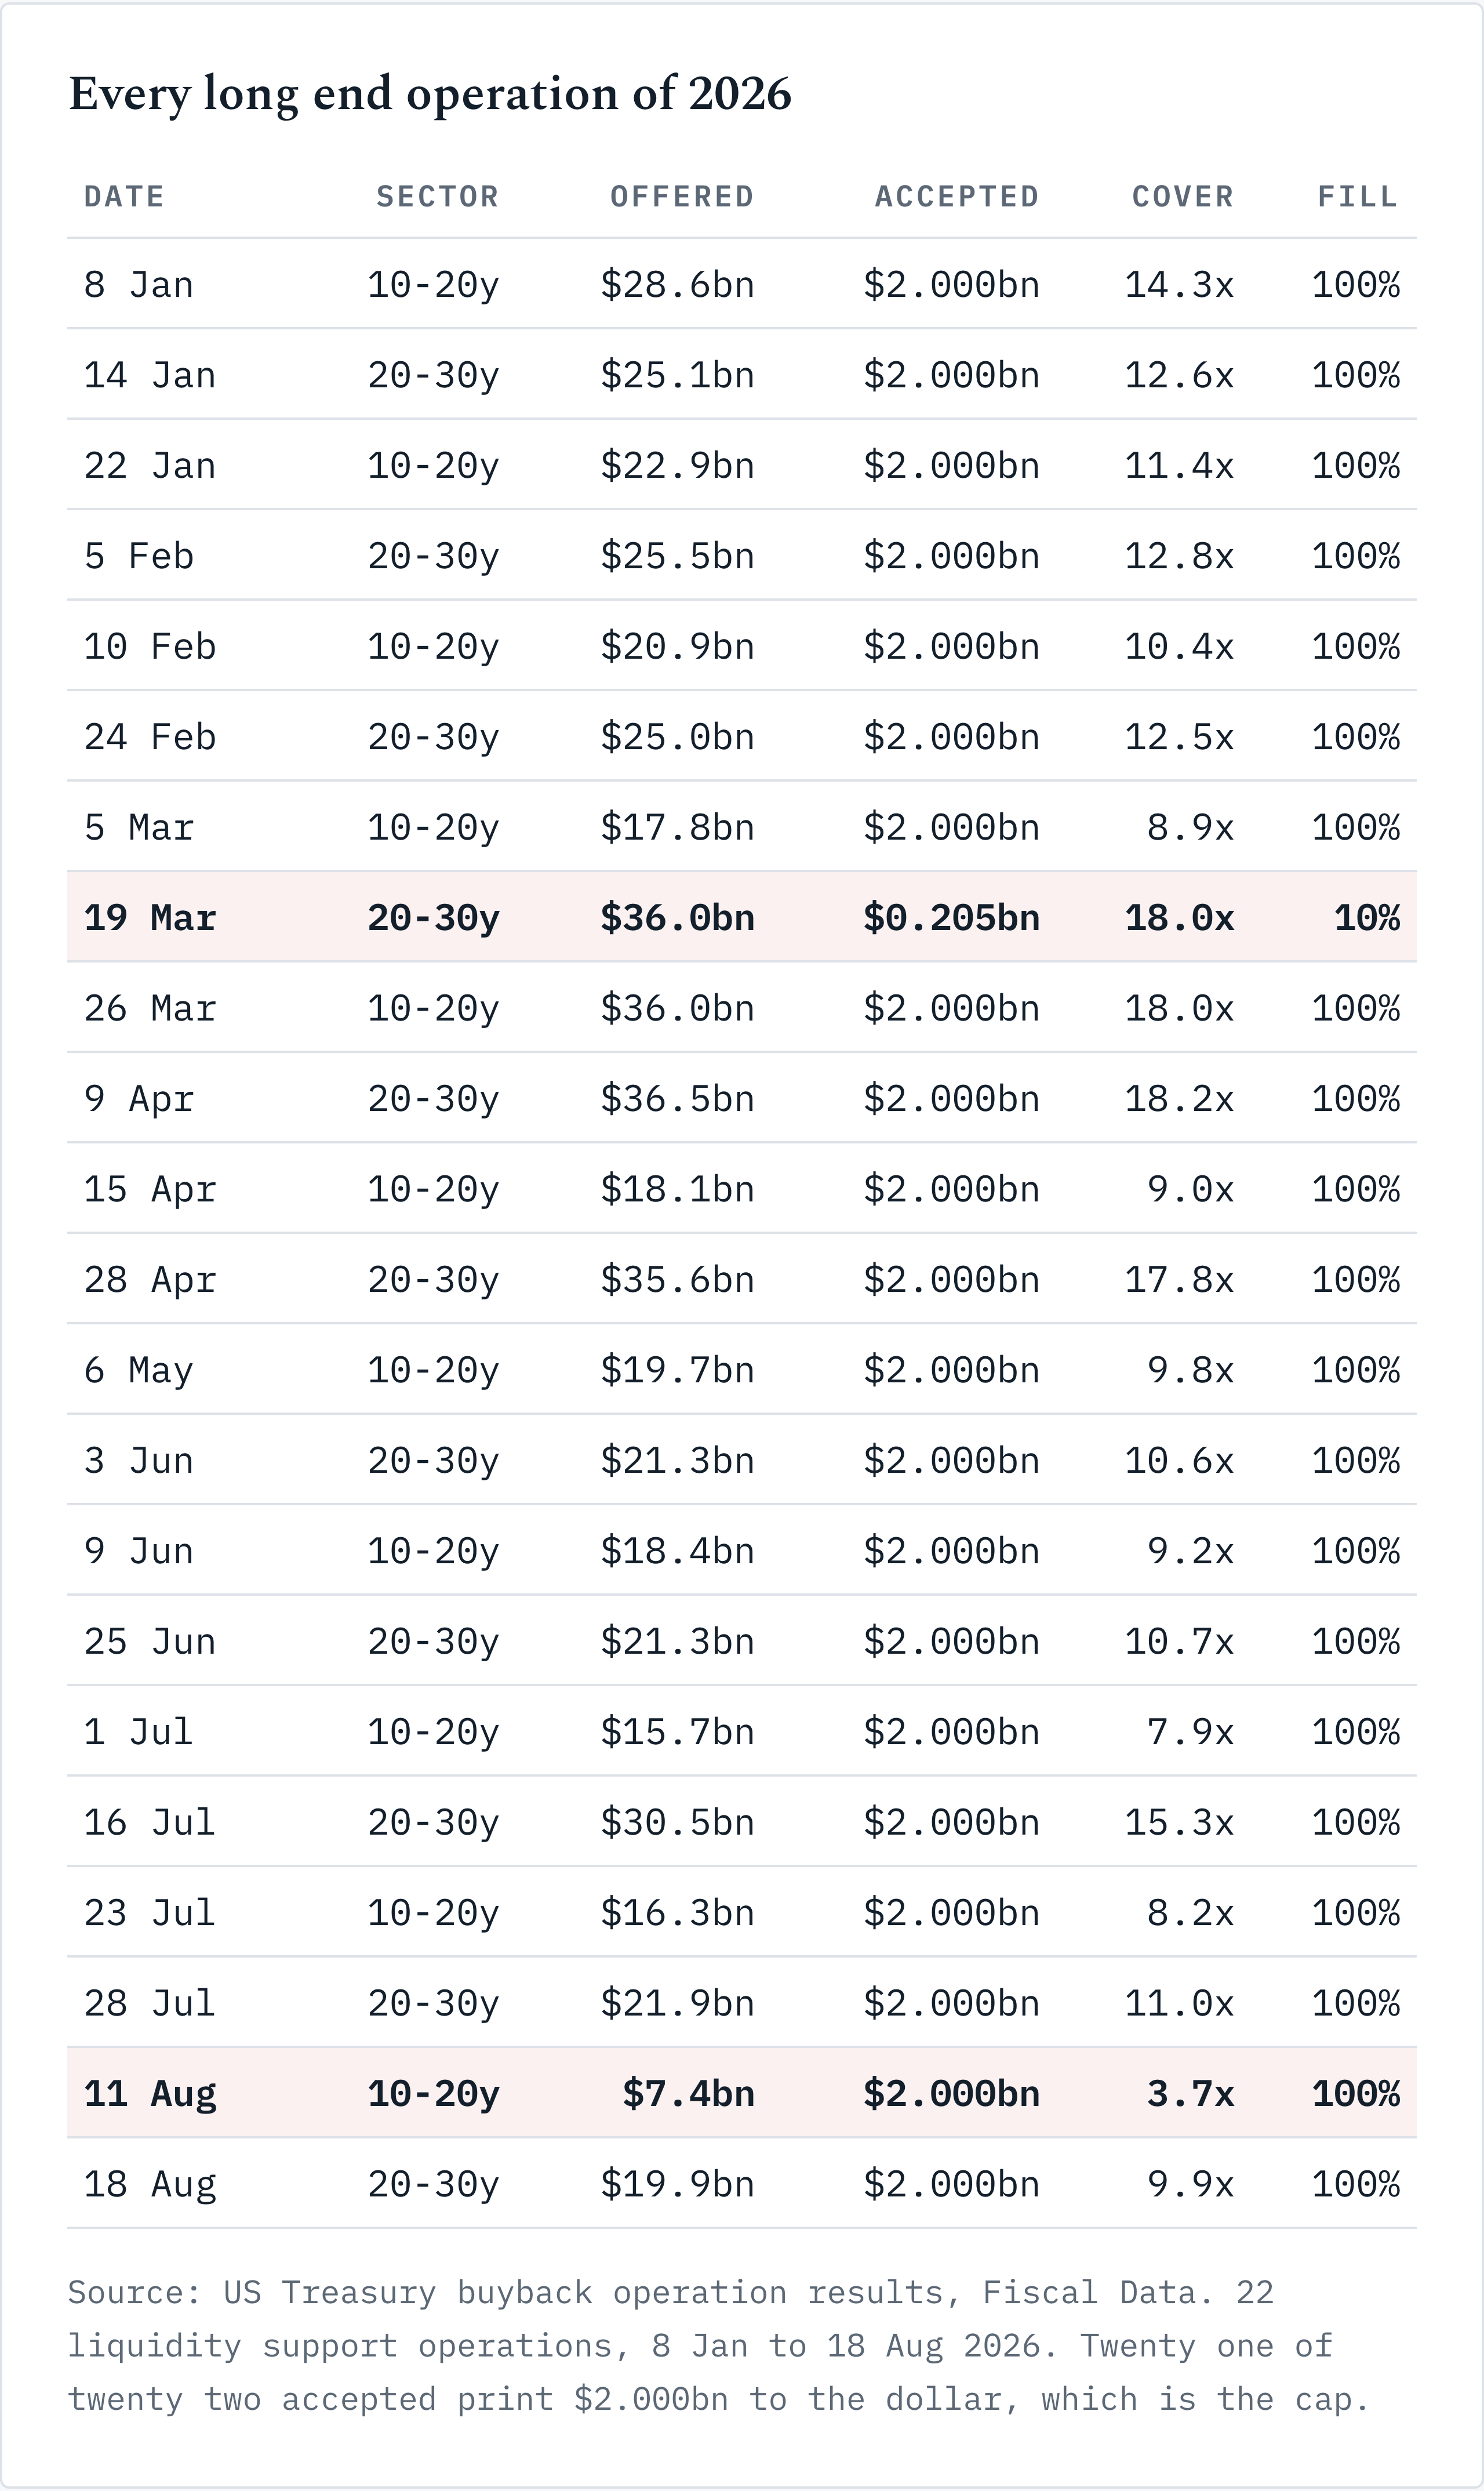
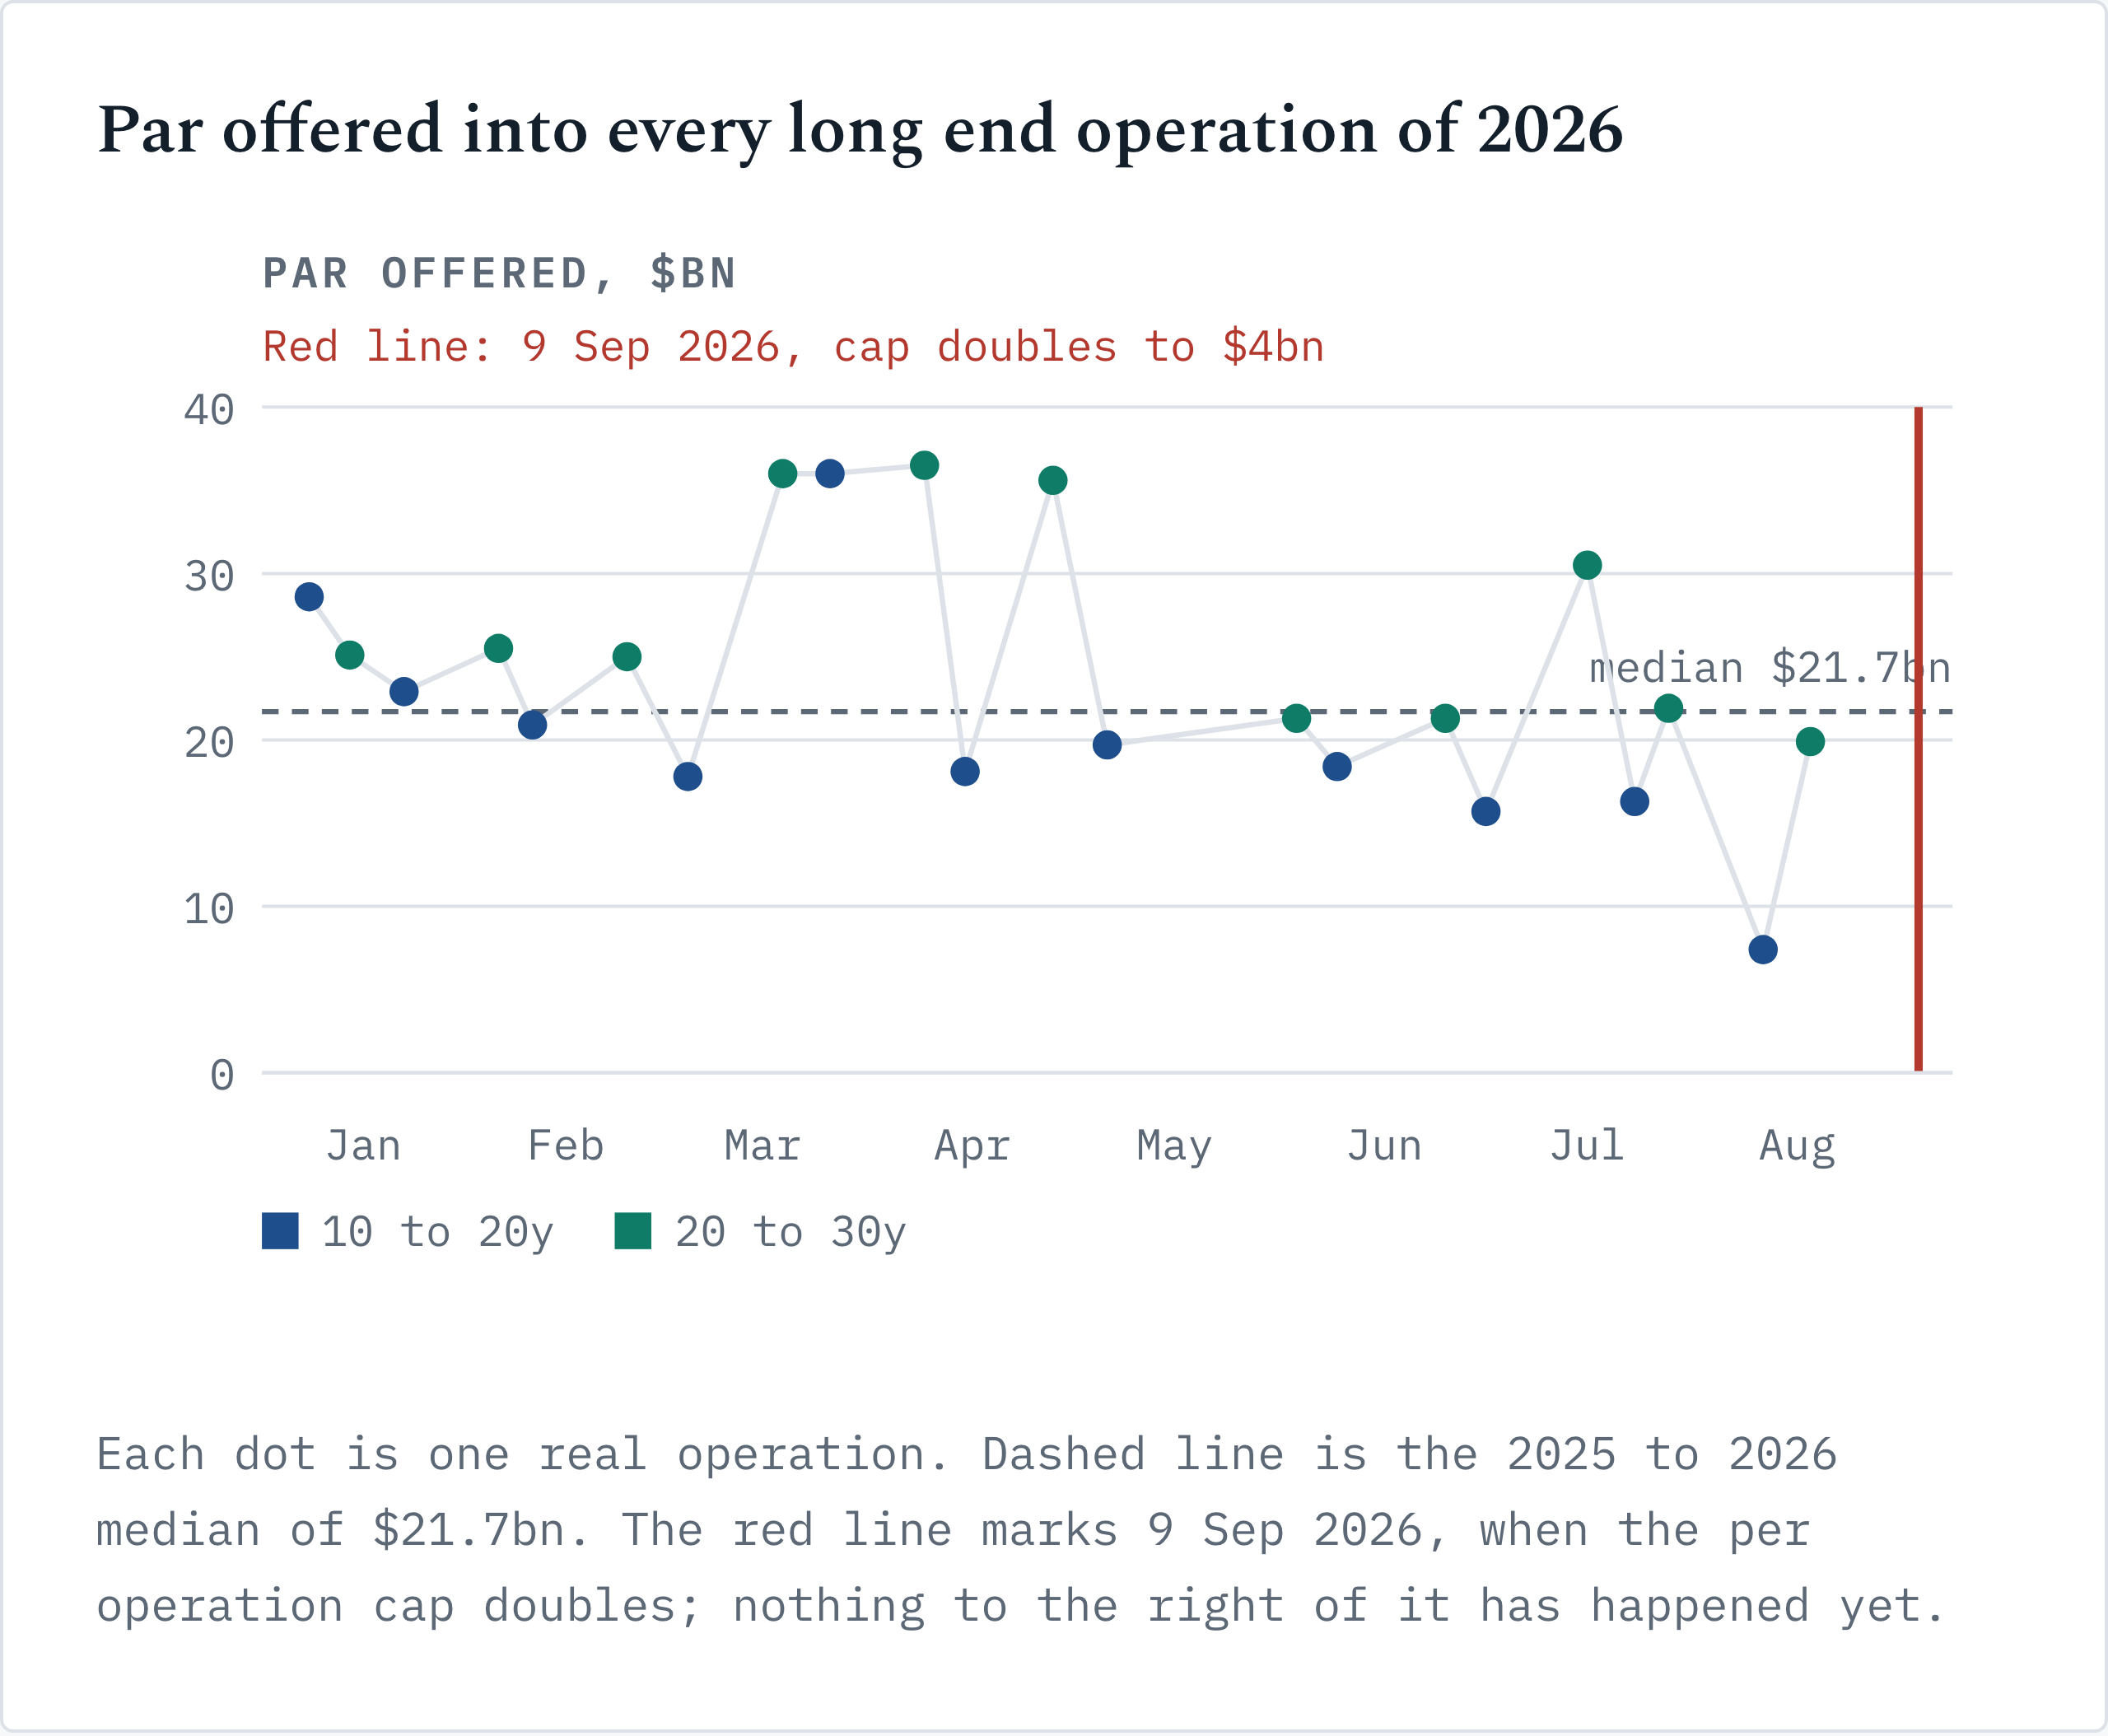
Read the accepted column first. Twenty one of twenty two print $2.000 billion, to the dollar, which is the cap. The exception is 19 March and I come back to it.
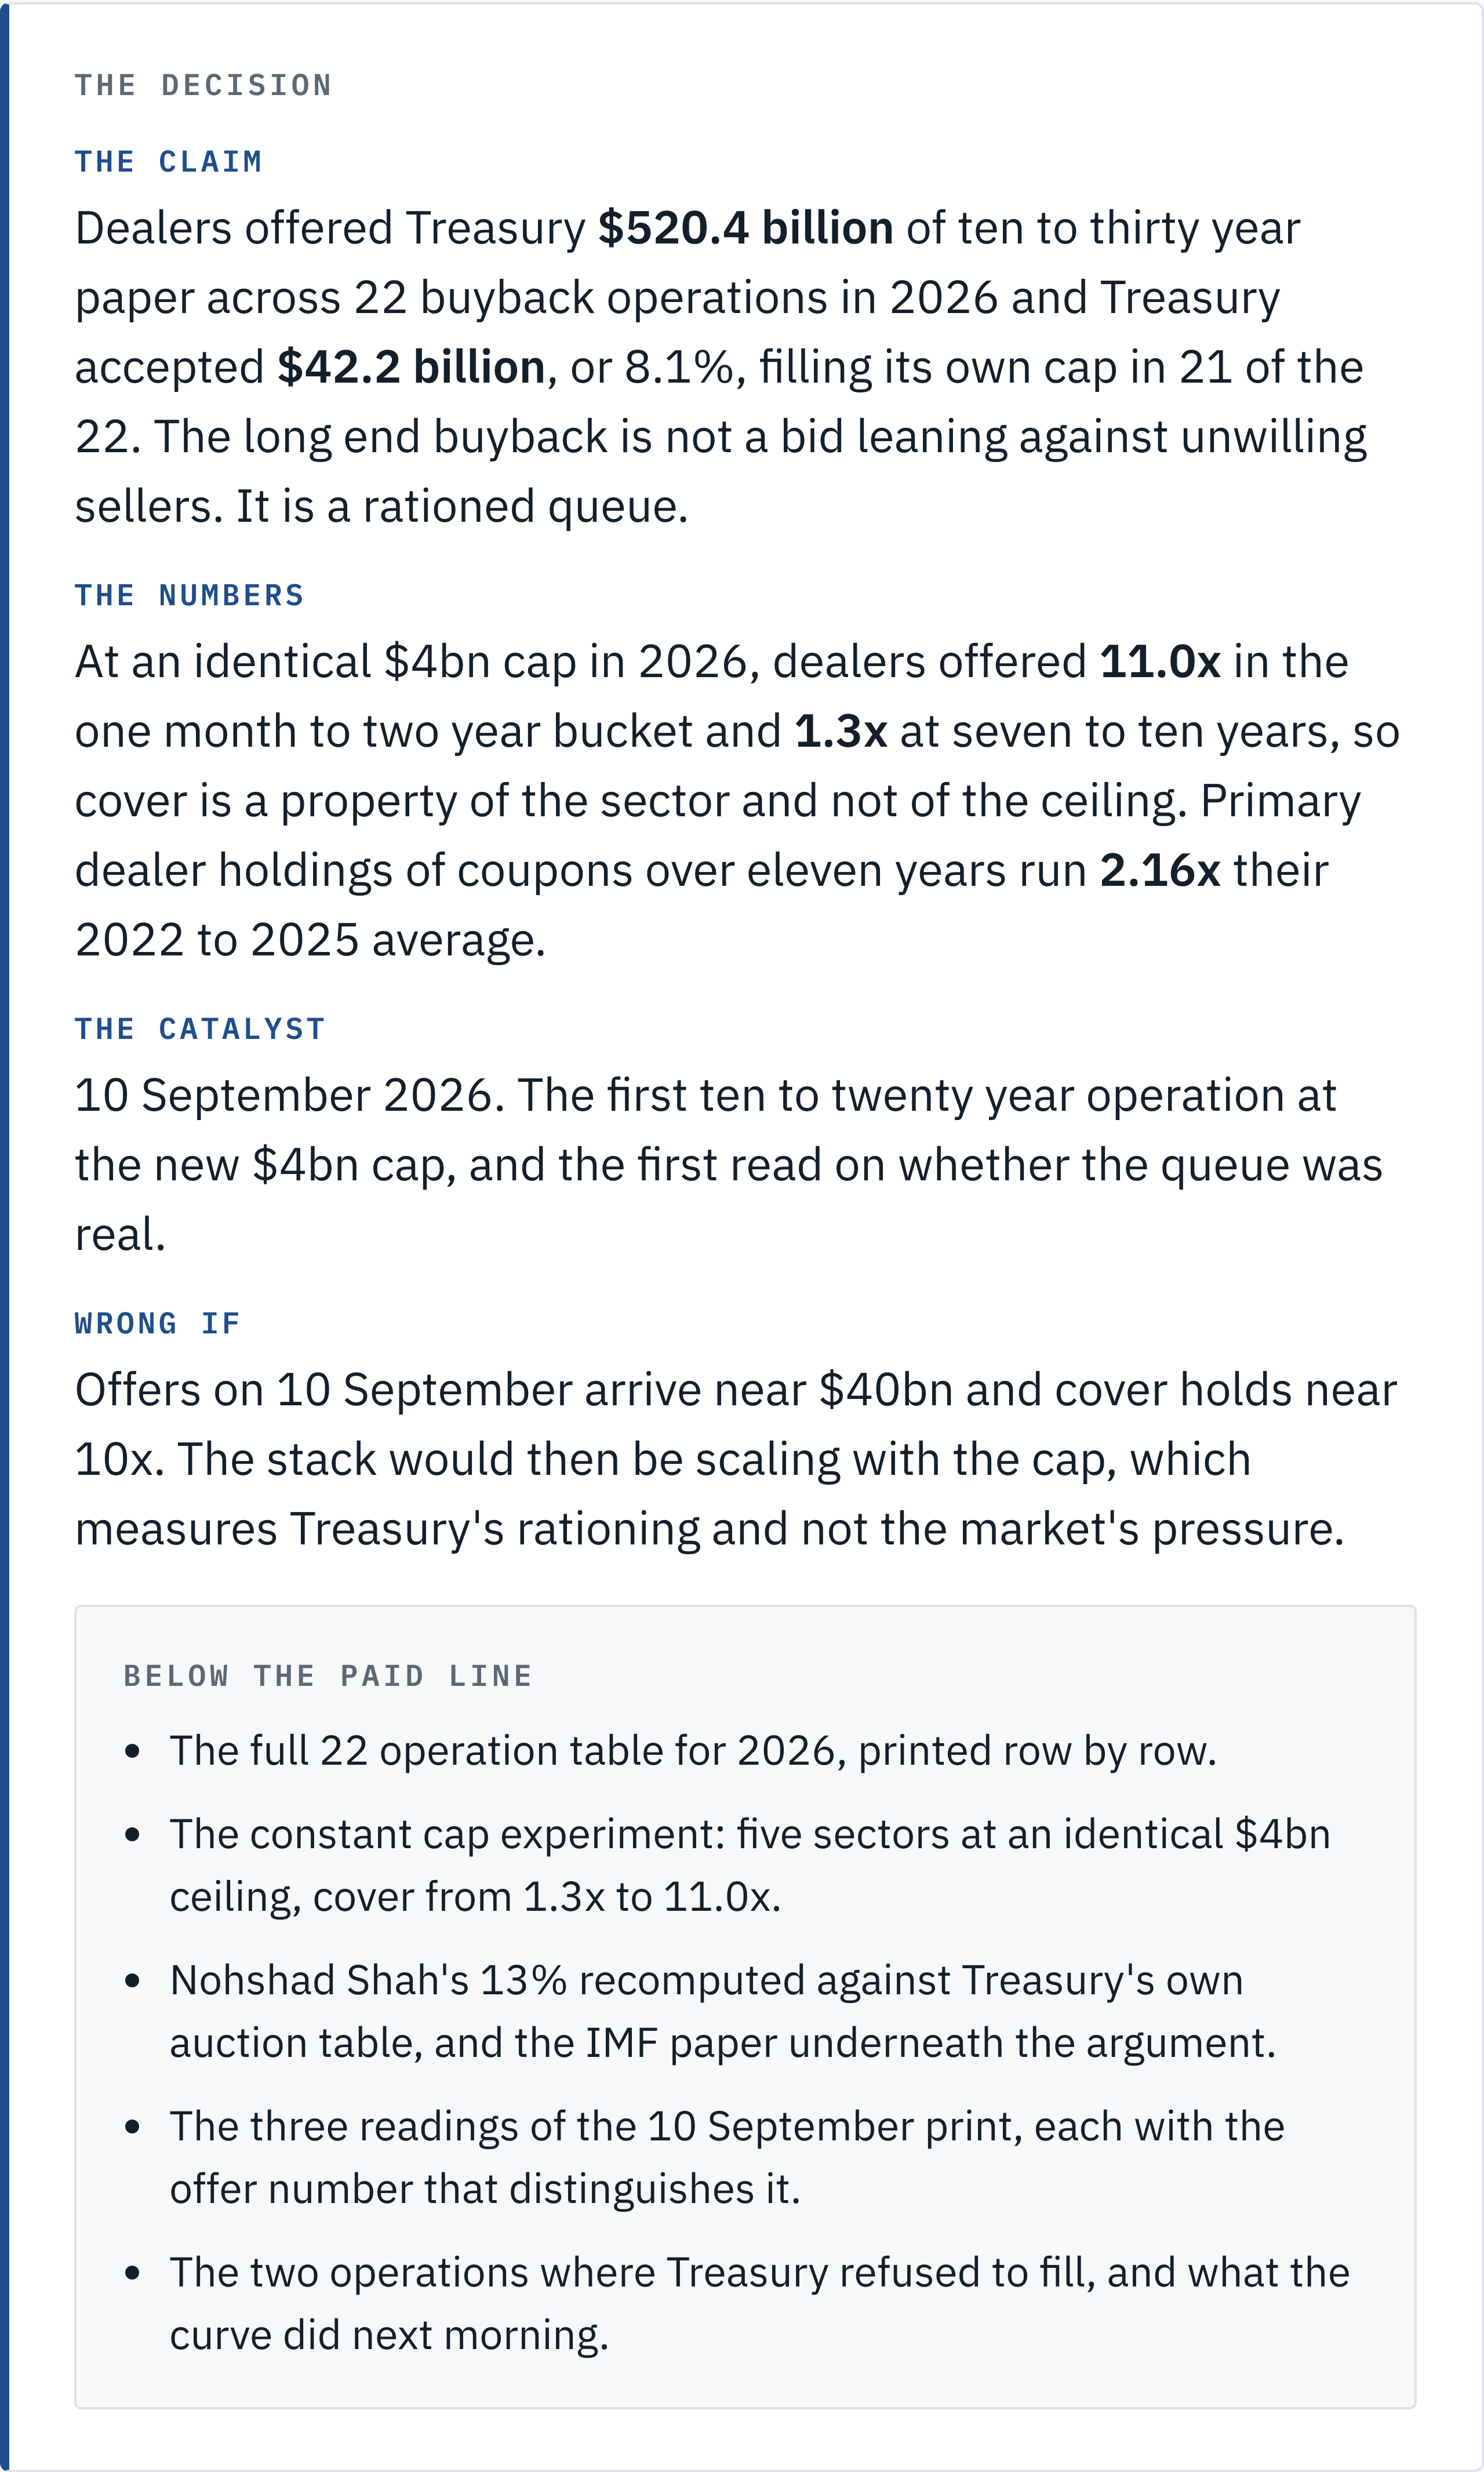
Across the twenty two, dealers offered $520.4 billion and Treasury took $42.2 billion (Treasury buyback operation results). I make that 8.1%. Be careful what you take that number to be. It measures what dealers wanted off their books, at prices they named themselves, and Treasury’s role is to decline 92% of it. That’s the whole finding.
This data is not a secret. Specialists who follow buyback plumbing track it, and one shop publishes a live dashboard whose headline metric is the offer to cover ratio. It appears in neither critique.
Druckenmiller picked the right test and this is where it gets answered. He went looking for a seizure and was correct that there wasn’t one. A full dealer balance sheet and a broken one are different conditions, and only the second shows up in auction tails and realised volatility. The first shows up here.
The one month bucket draws 11.0x, and it killed my duration story
My first draft said dealers offer where duration hurts. Then I read my own table.
Treasury ran liquidity support operations in five other coupon sectors this year at a cap of $4 billion, twice the long end ceiling. Same mechanism, same counterparties, same pricing discipline on Treasury’s side.
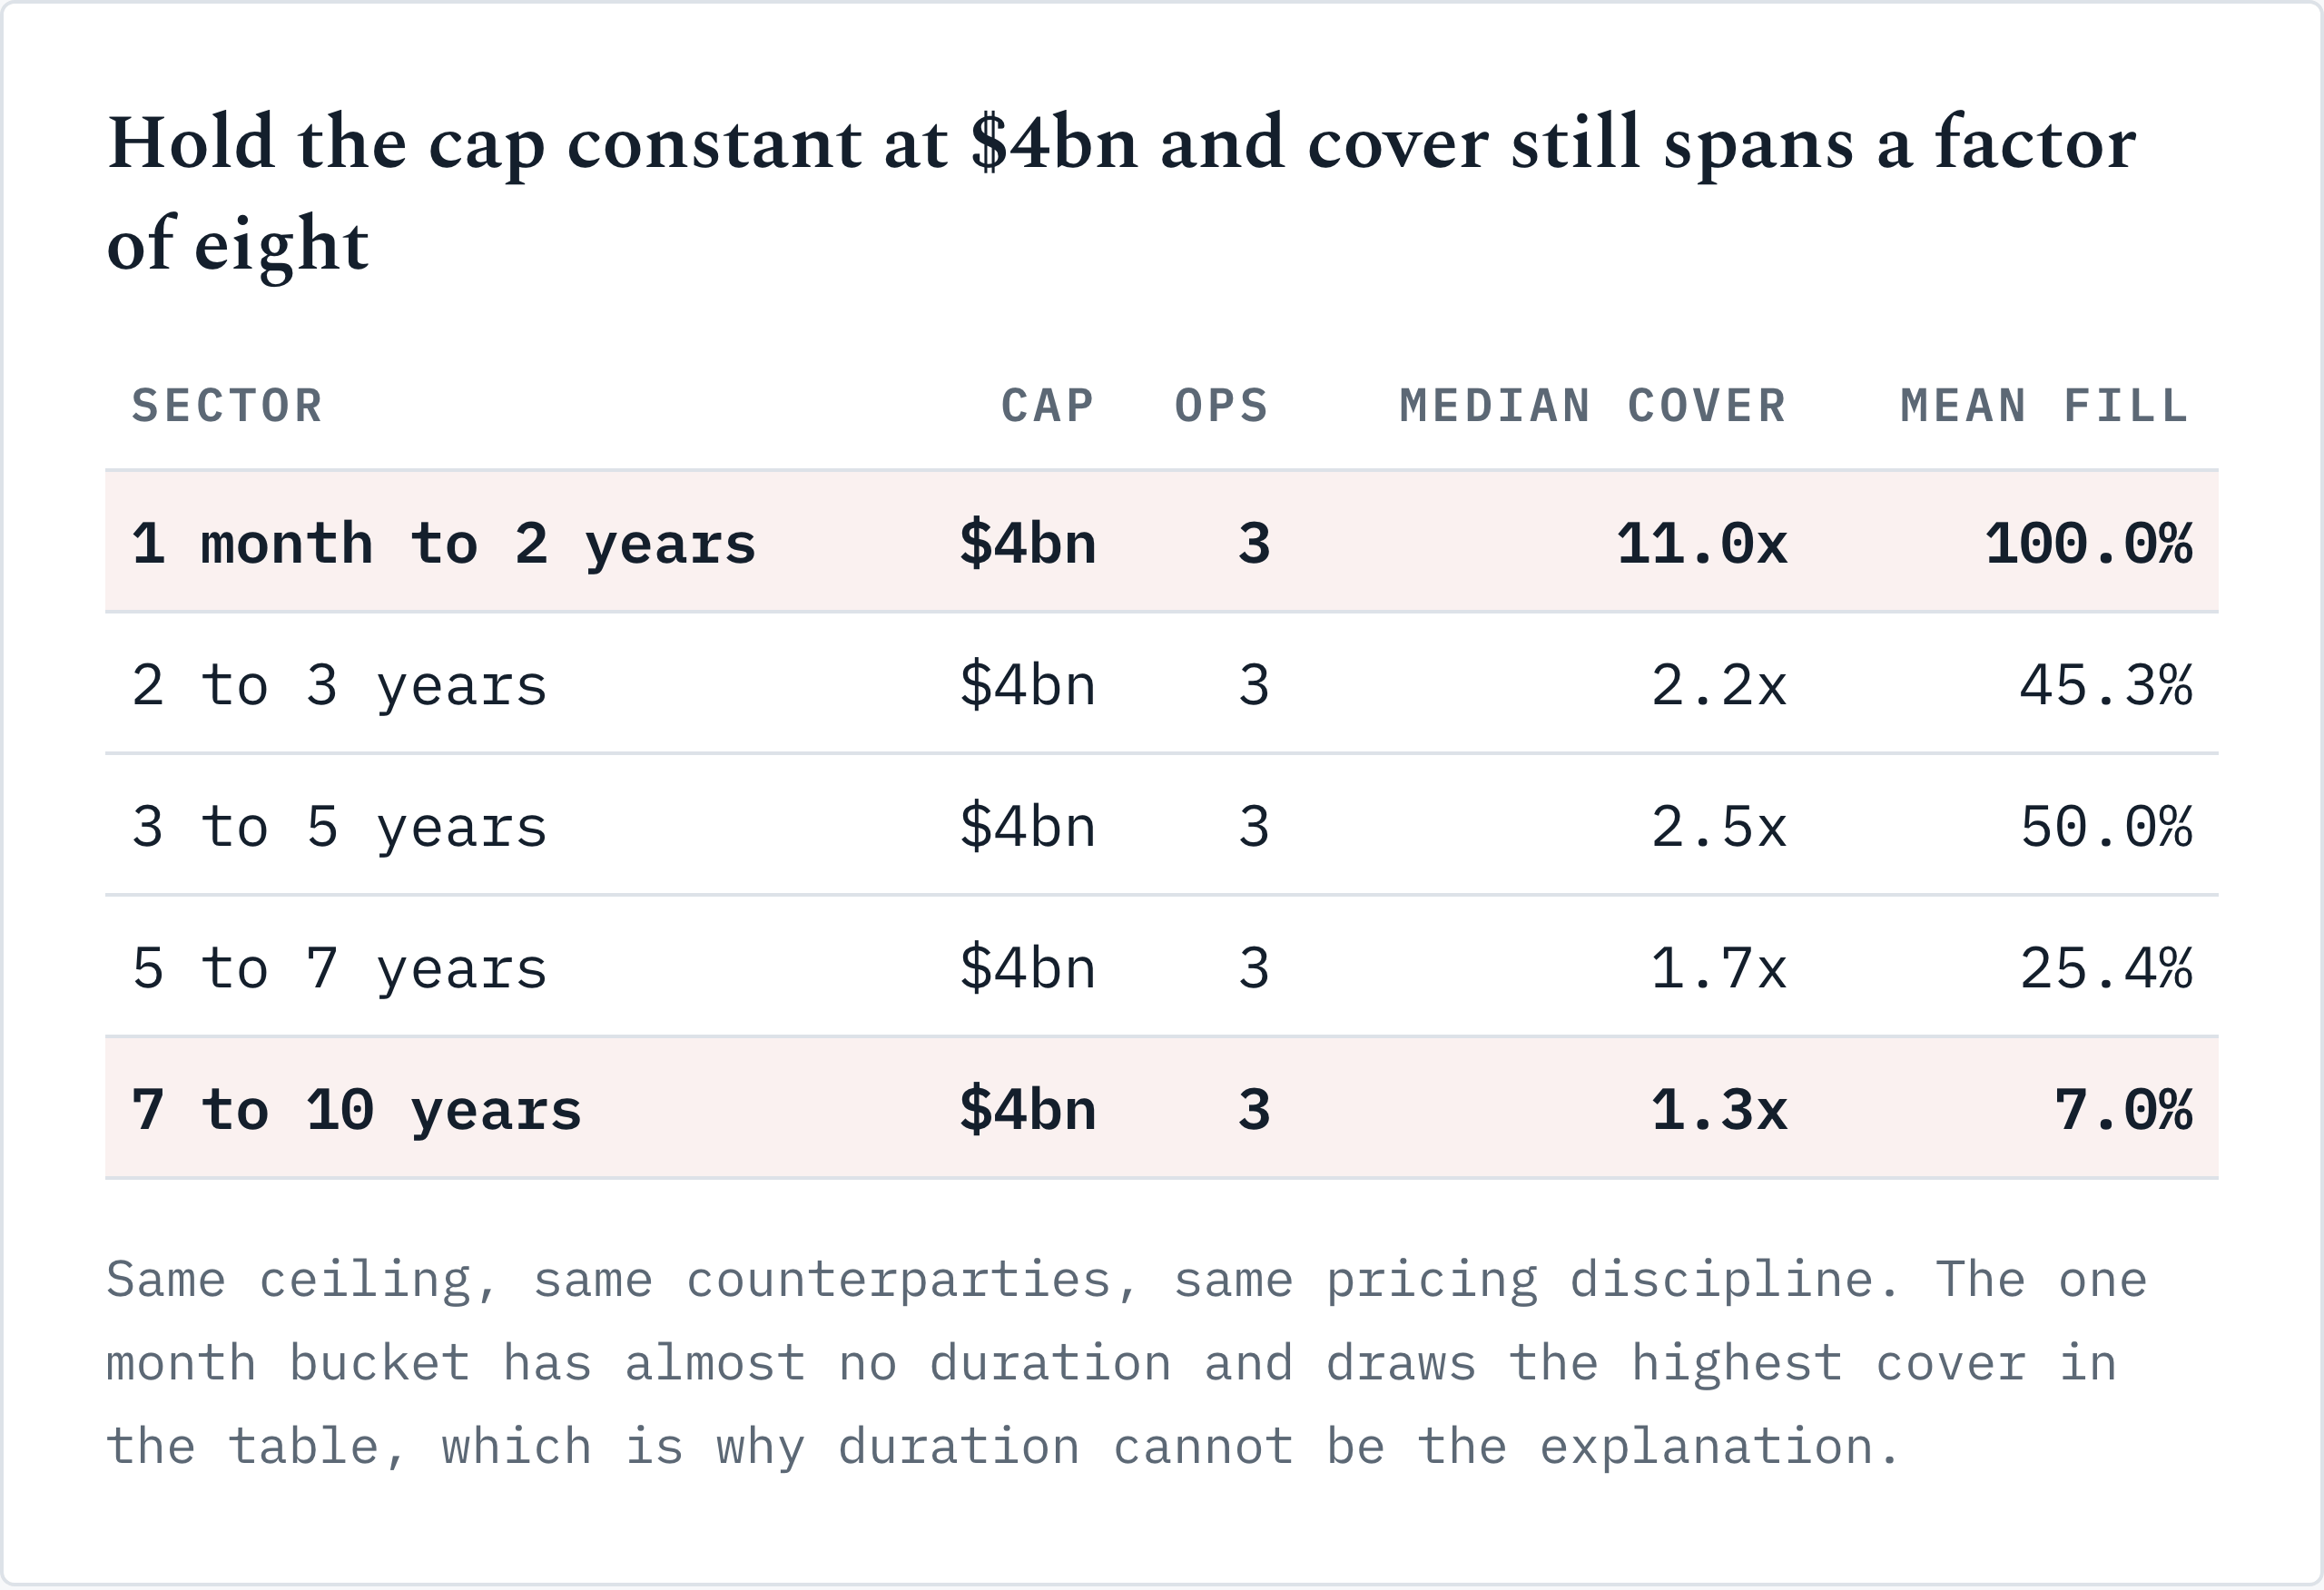
Look at the top row. The one month to two year bucket has almost no duration and it draws the highest cover in the table. Duration cannot be the explanation. A reader would have caught that in four seconds. I nearly didn’t.
The variable that fits all six rows is illiquidity and carry cost. At the front, off the run paper near maturity is odd lot inventory nobody wants to warehouse. At the back it’s off the run long bonds with thin two way flow and heavy balance sheet cost. Two different reasons. One behaviour. Dealers offer where holding hurts.
I’d have written that as my own inference, except somebody already proved it. Jing Zhou’s IMF working paper Testing the Liquidity Support Effects of the U.S. Treasury Buyback Program instruments Treasury’s own selection rule and finds buybacks “reduce primary dealers’ net holdings of Treasury bills and coupons,” modelled as “predictable demand for dealers facing inventory constraints and holding costs.” That is the mechanism, identified properly, a year before this argument started. Somebody got there first.
One more tell sits in the same file: Treasury accepts a median of three CUSIPs out of thirty six eligible, picking the cheapest against its own internal value and sending the rest home. Three of thirty six.
