



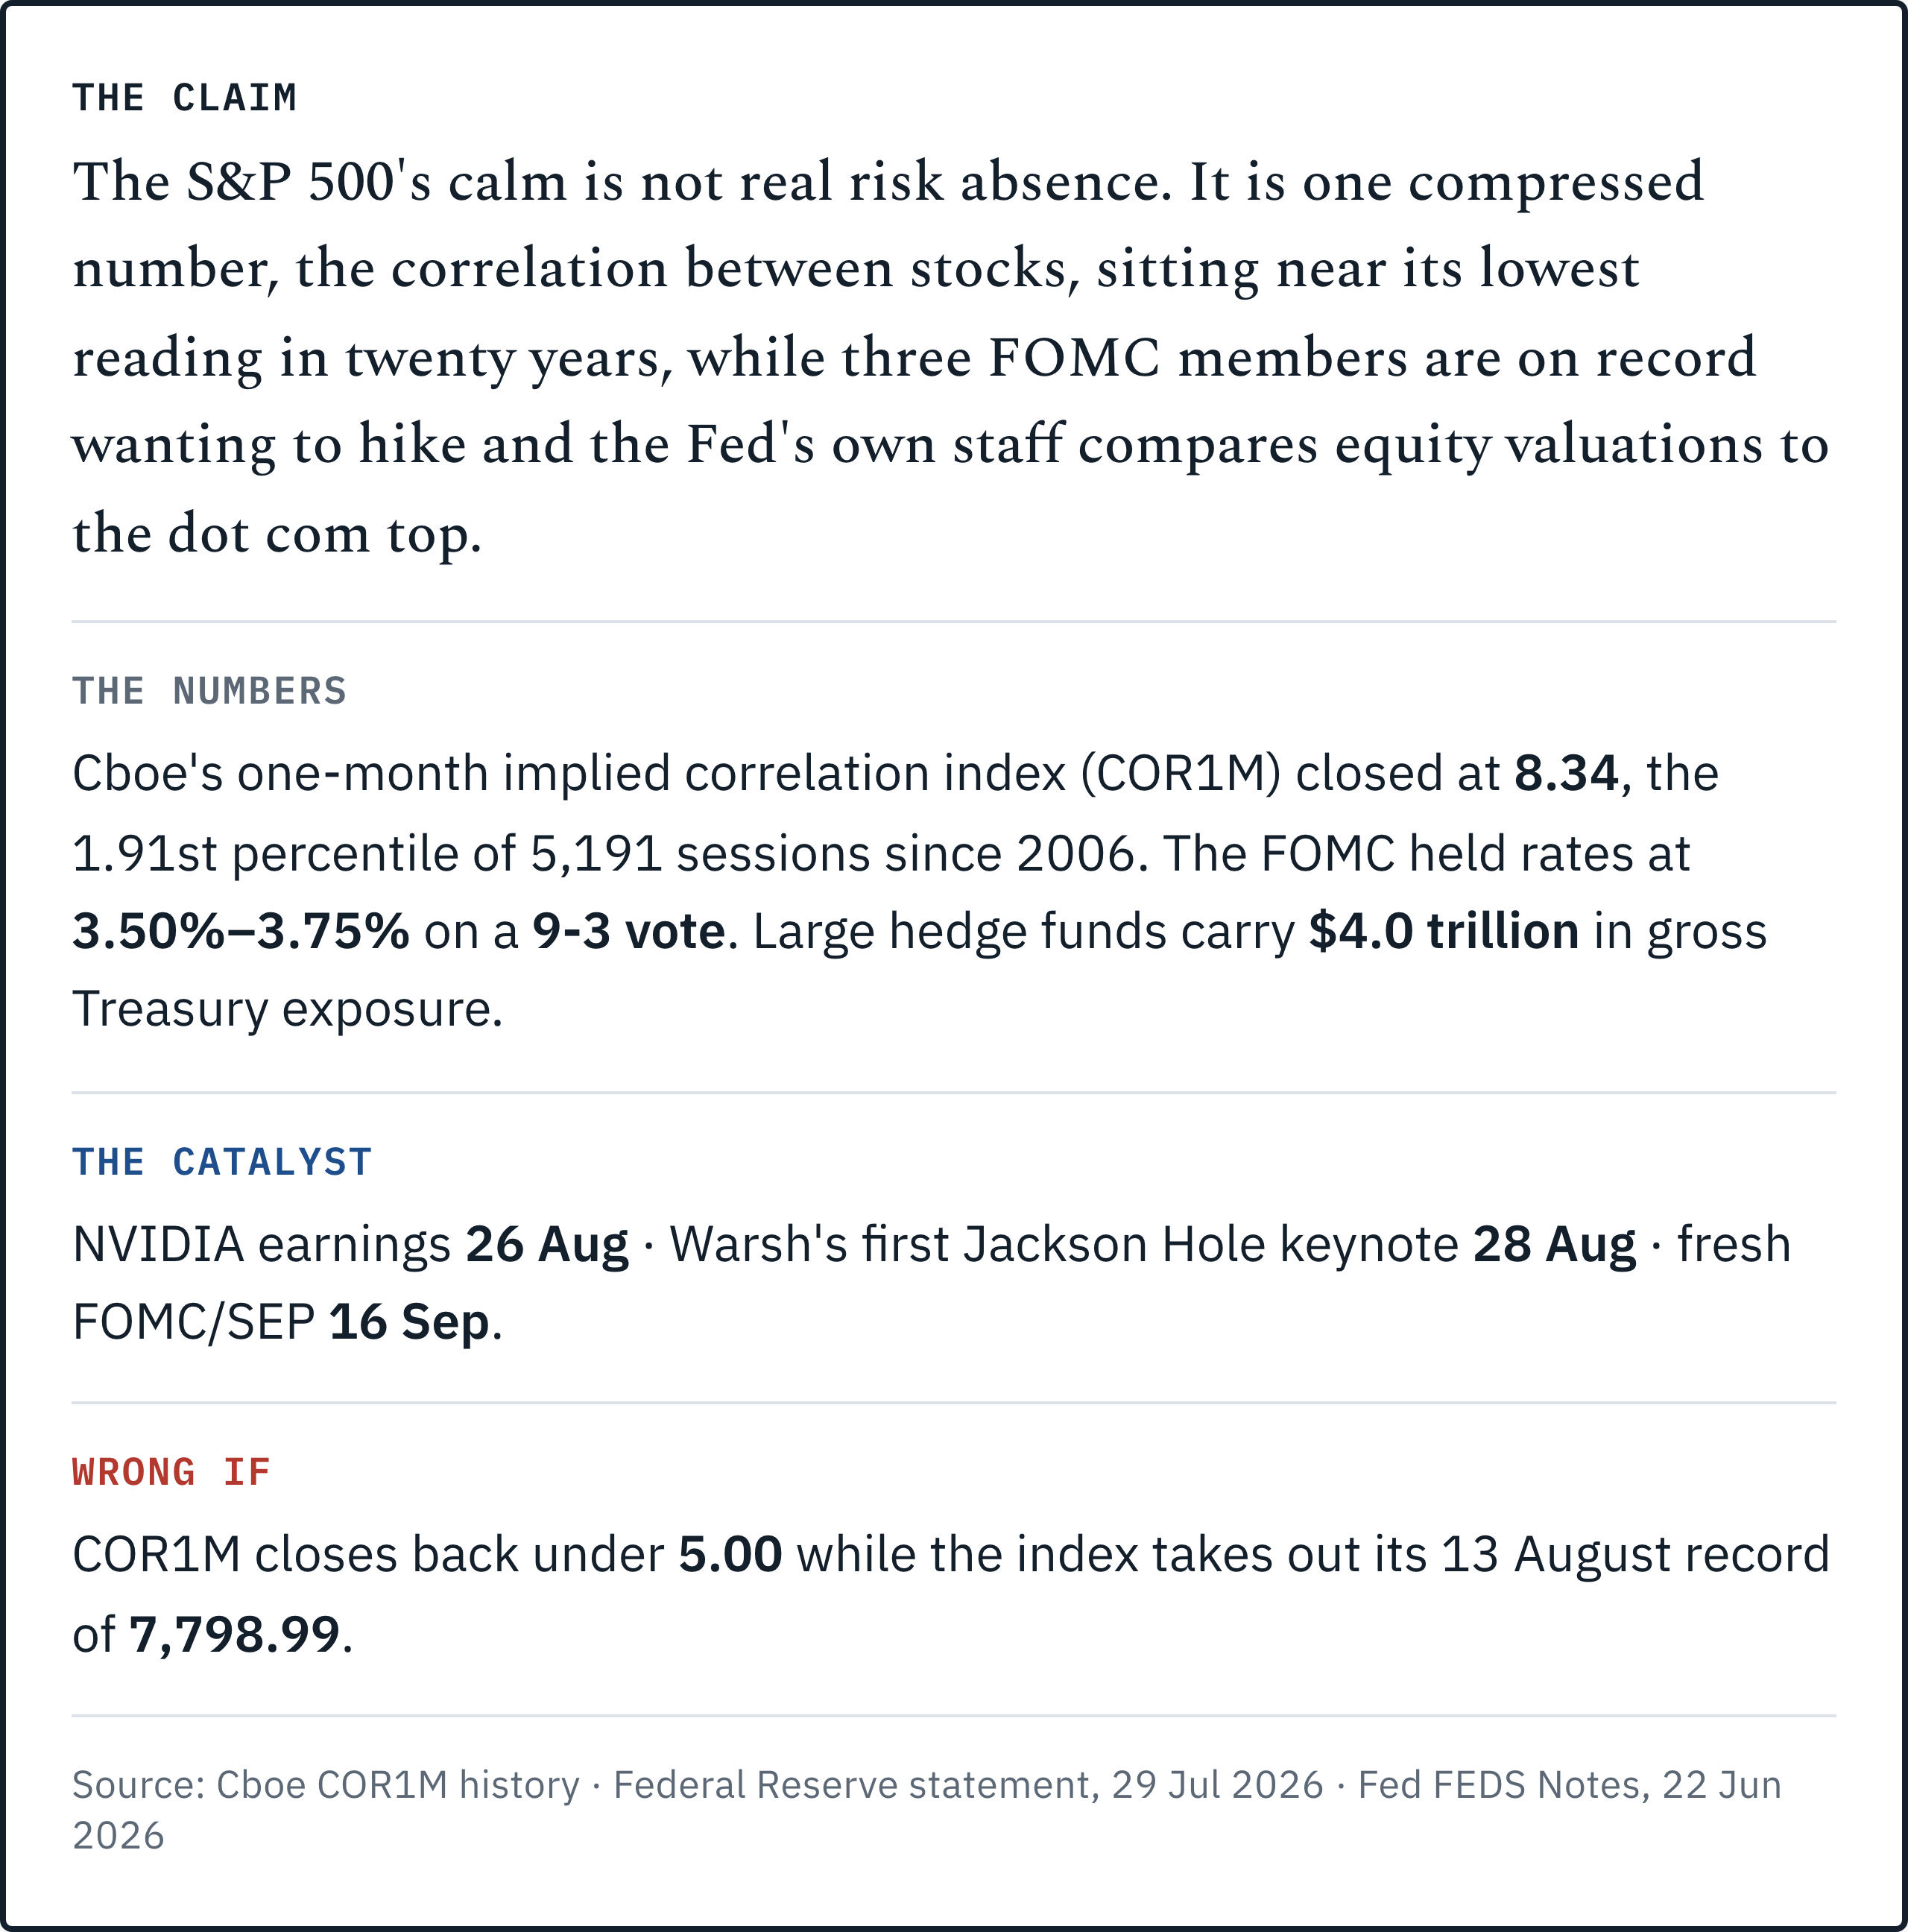
The S&P 500’s calm is not real risk absence. It is one compressed number, implied correlation, sitting near its lowest reading in twenty years, while the Fed’s own July minutes compare current equity valuations to the dot com top.
Kevin Warsh, three months into the chair, delivers his first Jackson Hole keynote on 28 August, one of the three dated events this piece turns on.

Photo: The White House · Public domain
The consensus, stated at its strongest
The bull case for calm isn’t lazy. It has real evidence, and I want to state it the way its own believers would. The S&P 500 is up 12.11% in 2026 and sits within two percent of an all time high. NVIDIA has beaten estimates for 13 straight quarters. ISM Manufacturing just posted 55.6% in July, the strongest reading since May 2022, with Services at 54.1%, a 25th straight month above 50. Credit markets agree: high yield spreads sit near 275 basis points and investment grade sits near 25 year tights. A market with real systemic fear does not price credit this way. Three data sets. One story.
The policy story fits too. Kevin Warsh, three months into the chair, has proven himself a known quantity: shorter statements, trimmed forward guidance. July payrolls fell 23,000 against a consensus of +83,000, and May and June got revised down a combined 103,000. That miss took hike odds for September from roughly 74% to under 30% inside the week the report landed. A committee that reacts this fast to one soft print, the argument runs, will not blindside a market already leaning toward a hold. Add a Treasury actively supporting the long end (Scott Bessent announced on 19 August that debt buybacks would more than double to at least $4 billion per operation starting 9 September) and the whole backdrop reads as accommodative before the Fed even meets. Every piece points the same way.
That is a coherent story. I don’t think it gets the direction wrong. I think it answers the wrong question.
The variant view: what COR1M actually prices
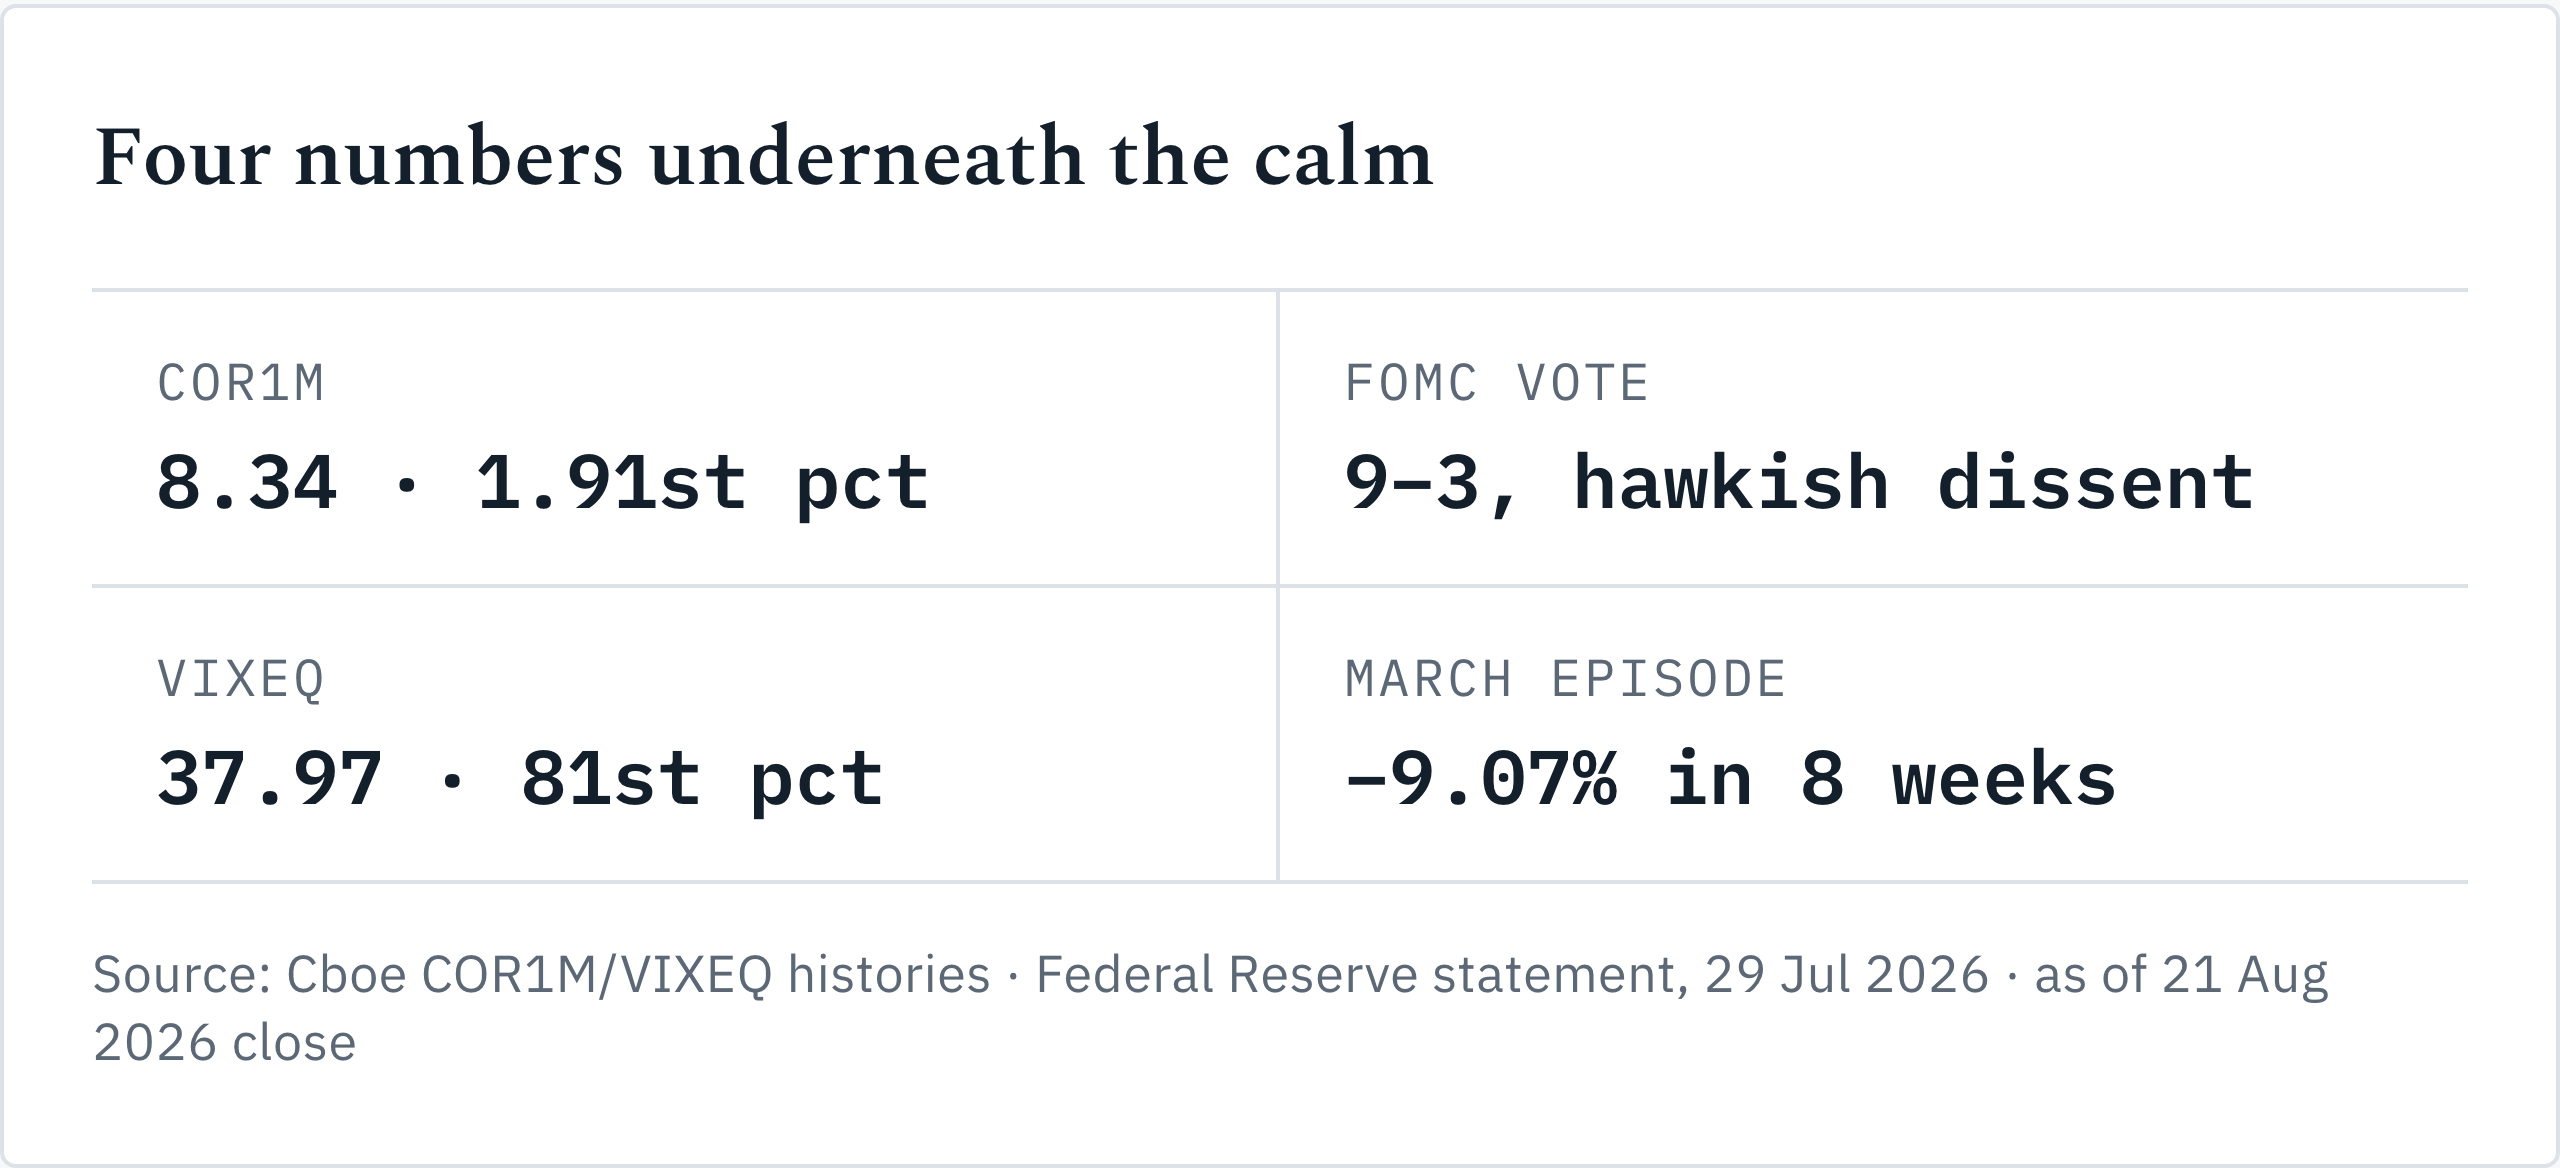
My read is narrower than “risk is mispriced,” and I think it’s more useful. The specific thing mispriced here is correlation between stocks. Cboe’s constituent volatility index, which prices single stock options the way the VIX prices the index, closed at 37.97 on 21 August, the 81st percentile of its own history since 2014. Individual names are priced for real trouble. Cboe’s dispersion index, which measures how differently those same names are expected to move, closed at 34.81 on the same day, the 92nd percentile of its own history. Both numbers say the options market is nervous about specific companies. Two vol gauges. Same verdict. I covered an earlier stage of this gap on 13 August, when one fund had already lost 30% trading it.
The VIX itself closed at 15.13 on 21 August, the 33rd percentile of its own history since 2014, the same lookback window used for VIXEQ above. Flat. Calm. That gap, single name fear at the 81st to 92nd percentile against index level calm at the 33rd, is not a contradiction. It is arithmetic. Index variance builds from the covariances between constituents, so index volatility scales roughly with average single stock volatility times the square root of average correlation. Put a high number and a near zero number into that square root and almost the entire distance between a frightened set of components and a placid benchmark gets absorbed by one term nobody quotes on a trading desk. The index is not calm. It is diversified against itself, mechanically, by a number that can move in weeks.
Nobody chose this gap on purpose. I read it as the exhaust of structured product hedging flow: covered call overwriting and autocallable note issuance sell single stock volatility on a schedule that has nothing to do with Iran, the Fed, or NVIDIA’s margin guide, and that selling suppresses idiosyncratic volatility from ever reaching the index. It works until a real common shock arrives, one that moves every constituent the same way on the same day. That’s the moment the correlation term does the opposite of what it’s been doing for six weeks. The absorber flips into an amplifier.
The mechanism: how a compressed number breaks
This is not a hypothetical. It already ran once this year, on this exact index, five months ago. Between 27 February and 27 March 2026, COR1M went from 15.01 to 41.68 while single stock volatility rose only 8%. Most of the VIX move, from 19.86 to 31.05, came through the correlation channel rather than through individual names actually getting scarier. The index fell 9.07% peak to trough, from 6,976.44 on 2 February to 6,343.72 on 30 March. I make that 632.72 points, priced by one term. Eight weeks.
I want to be precise about what that precedent proves. The trigger in March was a live military escalation, and today’s setup has no equivalent trigger yet identified. What March actually establishes is the size of the term once it moves: when this index snaps back to a higher correlation from a compressed base, the resulting move gets measured in multiples of the index’s recent range. Ordinary point moves do not describe it. Since 10 July, the absorber has already spent most of what it had. COR1M went from 3.44 to 8.34, up 142%, while VIXEQ fell from 48.97 to 37.97, down 22.5%, over the same six weeks. Two of the three series have already traveled a long way. Only one of them, single stock volatility, has much room left before it hits a floor. One lever, nearly spent. Correlation can keep rising from here. What has been paying for the calm cannot keep falling at the same pace.
I tested whether an absolute cutoff like 8.34 actually predicts anything, and the honest answer complicated my own thesis. Implied correlation never closed below 15 across the 2,013 sessions from 2006 to 2013, so a low absolute threshold does not select for a rare condition. The cutoff was measuring the calendar, not the risk. It mostly selects for the calendar reading 2024 or later, and those years happen to hold the drawdowns. Ranked against its own trailing year instead, Friday’s reading sits at a mild 21.8th percentile, a condition that has historically produced slightly positive forward returns. My own signal, weaker under its own test. What survives is narrower than the headline statistic: restricted to 2023 onward alone, low readings carry a mean forward return near minus one percent against a positive unconditional average, on a sample too small to trade off by itself. I would rather hand you the failed replication than the cleaner number, because the cleaner number does not survive its own footnotes.
The Fed’s own receipts
Here is where the variant view stops being a chart pattern and becomes a policy fact. The Federal Reserve held rates at 3.50%-3.75% on 29 July by a 9-3 vote, and the three dissents, Cleveland’s Beth Hammack, Minneapolis’s Neel Kashkari, and Dallas’s Lorie Logan, all wanted a quarter point hike, the first unified hawkish dissent bloc on the Committee since September 2016.

This is not a fringe view inside the building. The median dot did not soften. It hardened. June’s Summary of Economic Projections, Warsh’s first as chair, showed 9 of 18 participants projecting at least one 2026 rate hike, a full reversal from March, when zero had penciled one in. The median year end dot moved to 3.8%, up from 3.4% in March and above the current range’s 3.625% midpoint. Add a quarter point and you land at 3.875%, close enough to that median that the hawks are not asking for much. Warsh himself submitted no dot at that meeting, citing his own “long held views.”
The minutes from that meeting, released 19 August, are the most useful document in this whole framework. The Fed’s own staff wrote down my thesis before I did, in different words.

On the AI financing concentration sitting under a chunk of the index’s return, staff warned that a major downward revision to AI sector earnings assessments “might lead to a broad based repricing of assets, generate tighter financial conditions, and create strains in financial institutions.” On leverage: “leverage at hedge funds remained near all time highs across all strategies and was highly concentrated within the largest funds.”
I am not importing a bearish frame onto a neutral document. This document is already bearish about the exact mechanism I am describing. Their own words. I am only reading them.
Set that against the data the doves lean on. Core CPI ran 2.5% year over year in July, down from 2.6% in June, but headline PCE sits at 3.7% and core PCE at 3.3% for June, both well above target. GDP growth slowed to 1.5% annualized in Q2, down from 2.1% in Q1, yet the price indices inside that same report ran hot: the gross domestic purchases price index rose 5.7% annualized. Two inflation gauges, two different stories. That mix is a genuine reaction function conflict, not a clean signal either way. The Treasury’s own borrowing advisory committee called the June SEP “notably more hawkish,” with roughly half of participants penciling in a 2026 hike. CME’s own pricing has behaved exactly like a market trying to resolve a real fight: implied hike probability for September ran near 74% in late July, collapsed toward 30% within days of the jobs miss, then climbed back to roughly 40% by 22 August, a round trip of over forty points in three weeks. That instability is not showing up anywhere in the equity vol surface.
The September scenario tree
Three paths out of 16 September, and I want to separate the decision from the surprise from the market reaction, because folding them together is how most Fed-day playbooks misfire.
Hold, hawkish tone (roughly 55%). The decision itself is not the surprise; a hold is close to consensus. The surprise sits in the SEP. If the dot count for a 2026 hike holds near June’s 9 of 18 or rises, and the language leans on the dot com comparison from the minutes, that’s a hawkish hold wrapped inside a decision that looks like nothing happened. I’d expect the front end to sell off modestly, the dollar to firm off its August lows, and equities to take the hit through the correlation channel rather than a level shift in the discount rate. This is the path where my thesis resolves.
Hold, dovish tone (roughly 20%). The Committee leans on July’s payroll contraction and softens the dot count, and Warsh’s press conference echoes the market friendly reading his July presser got, even though his prepared remarks skewed more hawkish. Risk assets extend. Compression persists a while longer. My invalidation level, COR1M under 5.00 with the index above 7,798.99, comes into range.
A 25bp hike (roughly 25%). With three sitting dissenters and a dot plot already leaning this way, I won’t pretend this is a tail case. It’s the scenario the vol surface prices almost nothing for, and exactly the one that forces the fastest correlation normalization: a hike against a market positioned for a hold moves every name the same direction, same day. Treasuries reprice higher in yield across the curve, credit spreads widen off their tights, and the equity move looks far more like March than a typical, orderly Fed reaction.
Notice what’s missing from all three: a cut. CME pricing carries close to zero probability of one, a strange place for a Fed conversation to sit this late in a cycle that started with cuts. No cut priced. None.
The 30-day outlook
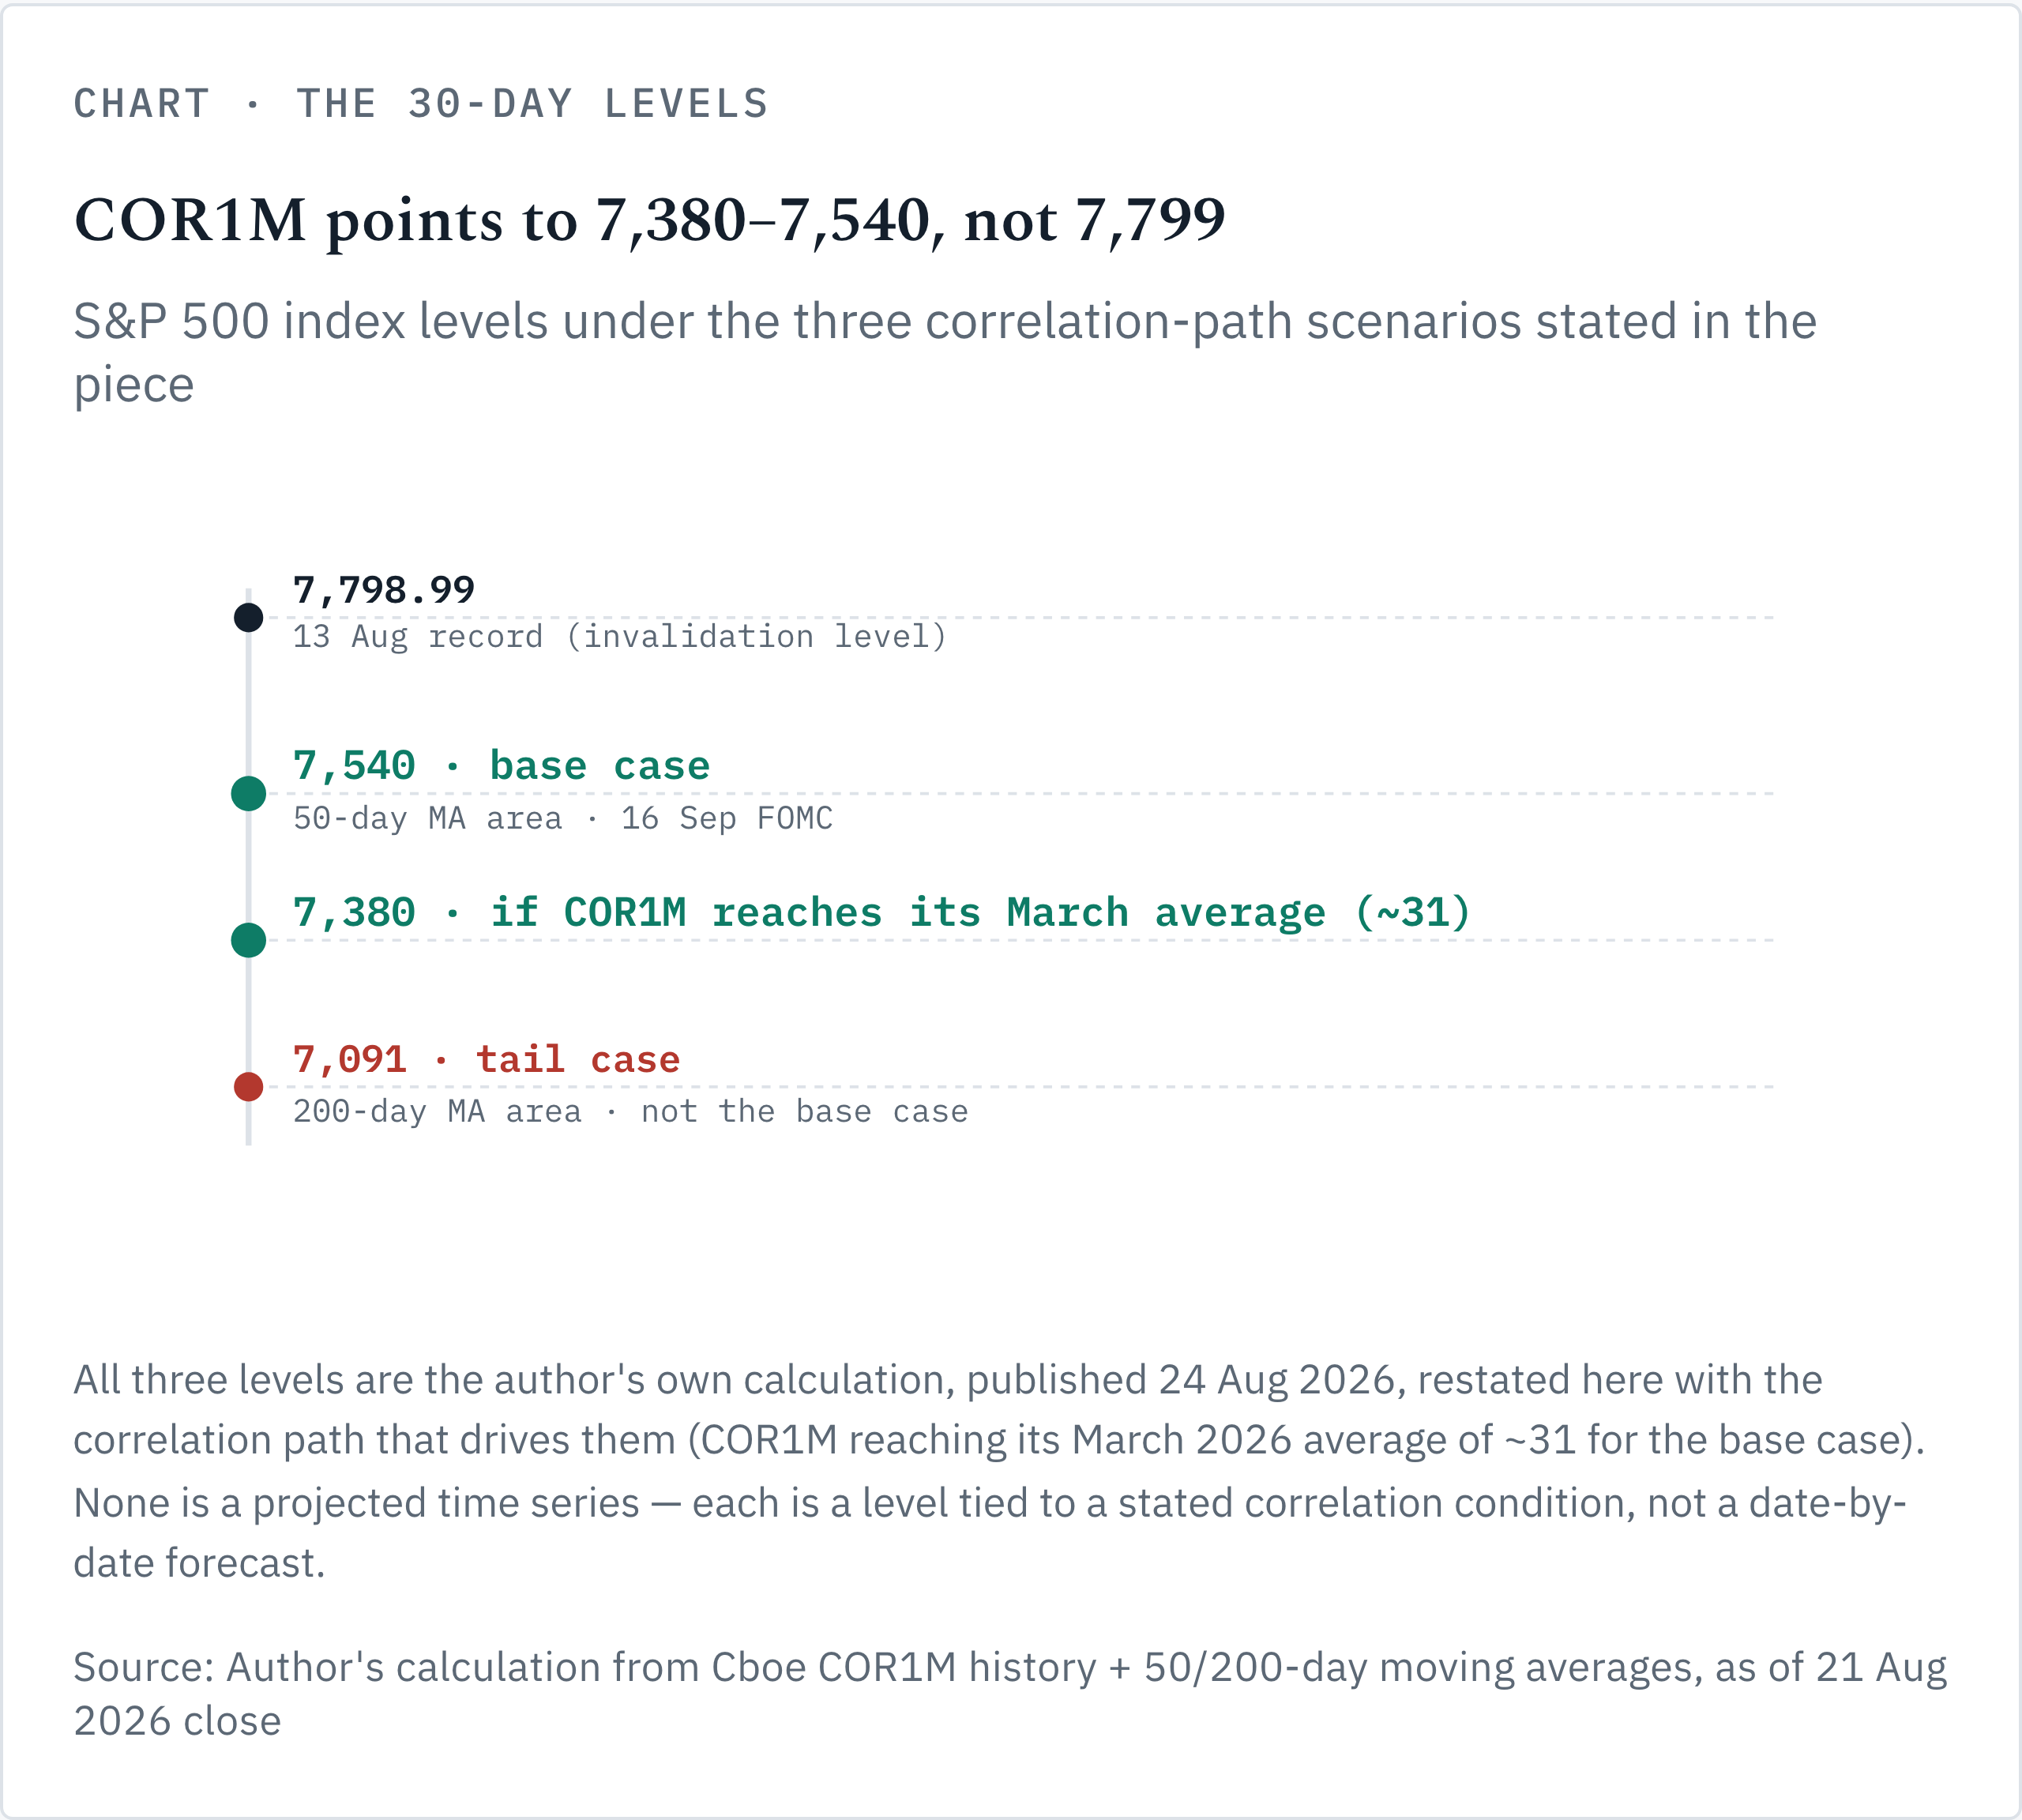
My index level call, published on 24 August, gets restated here with its full evidence trail. Base case: 7,540 by the 16 September FOMC. That level sits one point under the 50-day moving average, roughly where the index traded on 3 August. It’s a 1.75% move from Friday’s close, comfortably inside one standard deviation of realized volatility. This call doesn’t need drama to work. If correlation reaches its March average near 31, short of its March peak, 7,380 comes into range. A tail case, which I don’t expect but put on the record so it stays visible, lands near 7,091, within six points of the 200-day moving average. That is a smaller percentage move than March’s own peak to trough drawdown, since it is anchored to a technical level rather than a literal replay of March’s arithmetic. I use it to mark where the chart’s own support sits, not to claim the two episodes would be the same size. Three levels, one variable driving all three.
Positioning doesn’t argue against this. Asset managers held 960,566 net long e-mini contracts in the 18 August CFTC report, the 69th percentile of three years. Elevated. Not extreme. Dealer gamma agrees: the S&P sat in a positive, stabilizing regime through mid-August, then flipped short as the index pulled back toward its flip level near 7,674 after the record. Cash on the sidelines is thin too: BofA’s Global Fund Manager Survey put institutional cash at 3.5% of AUM, the sixth lowest reading since 1998. Professional positioning sits lightly stretched and nervous. The one number that has not caught up is the correlation reading.
Bull case (25%): NVIDIA reassures, Warsh’s keynote stays structural, correlation stays compressed, and the index tests fresh highs toward Morgan Stanley’s 8,000 year end target. Base case (50%): the cushion partially unwinds across the three catalysts without a disorderly break, landing near 7,540 to 7,380. Bear case (25%): NVIDIA disappoints on the AI financing questions the Fed’s own minutes raised, or the SEP delivers the hawkish surprise the dot count already supports, and correlation normalizes fast instead of gradually.
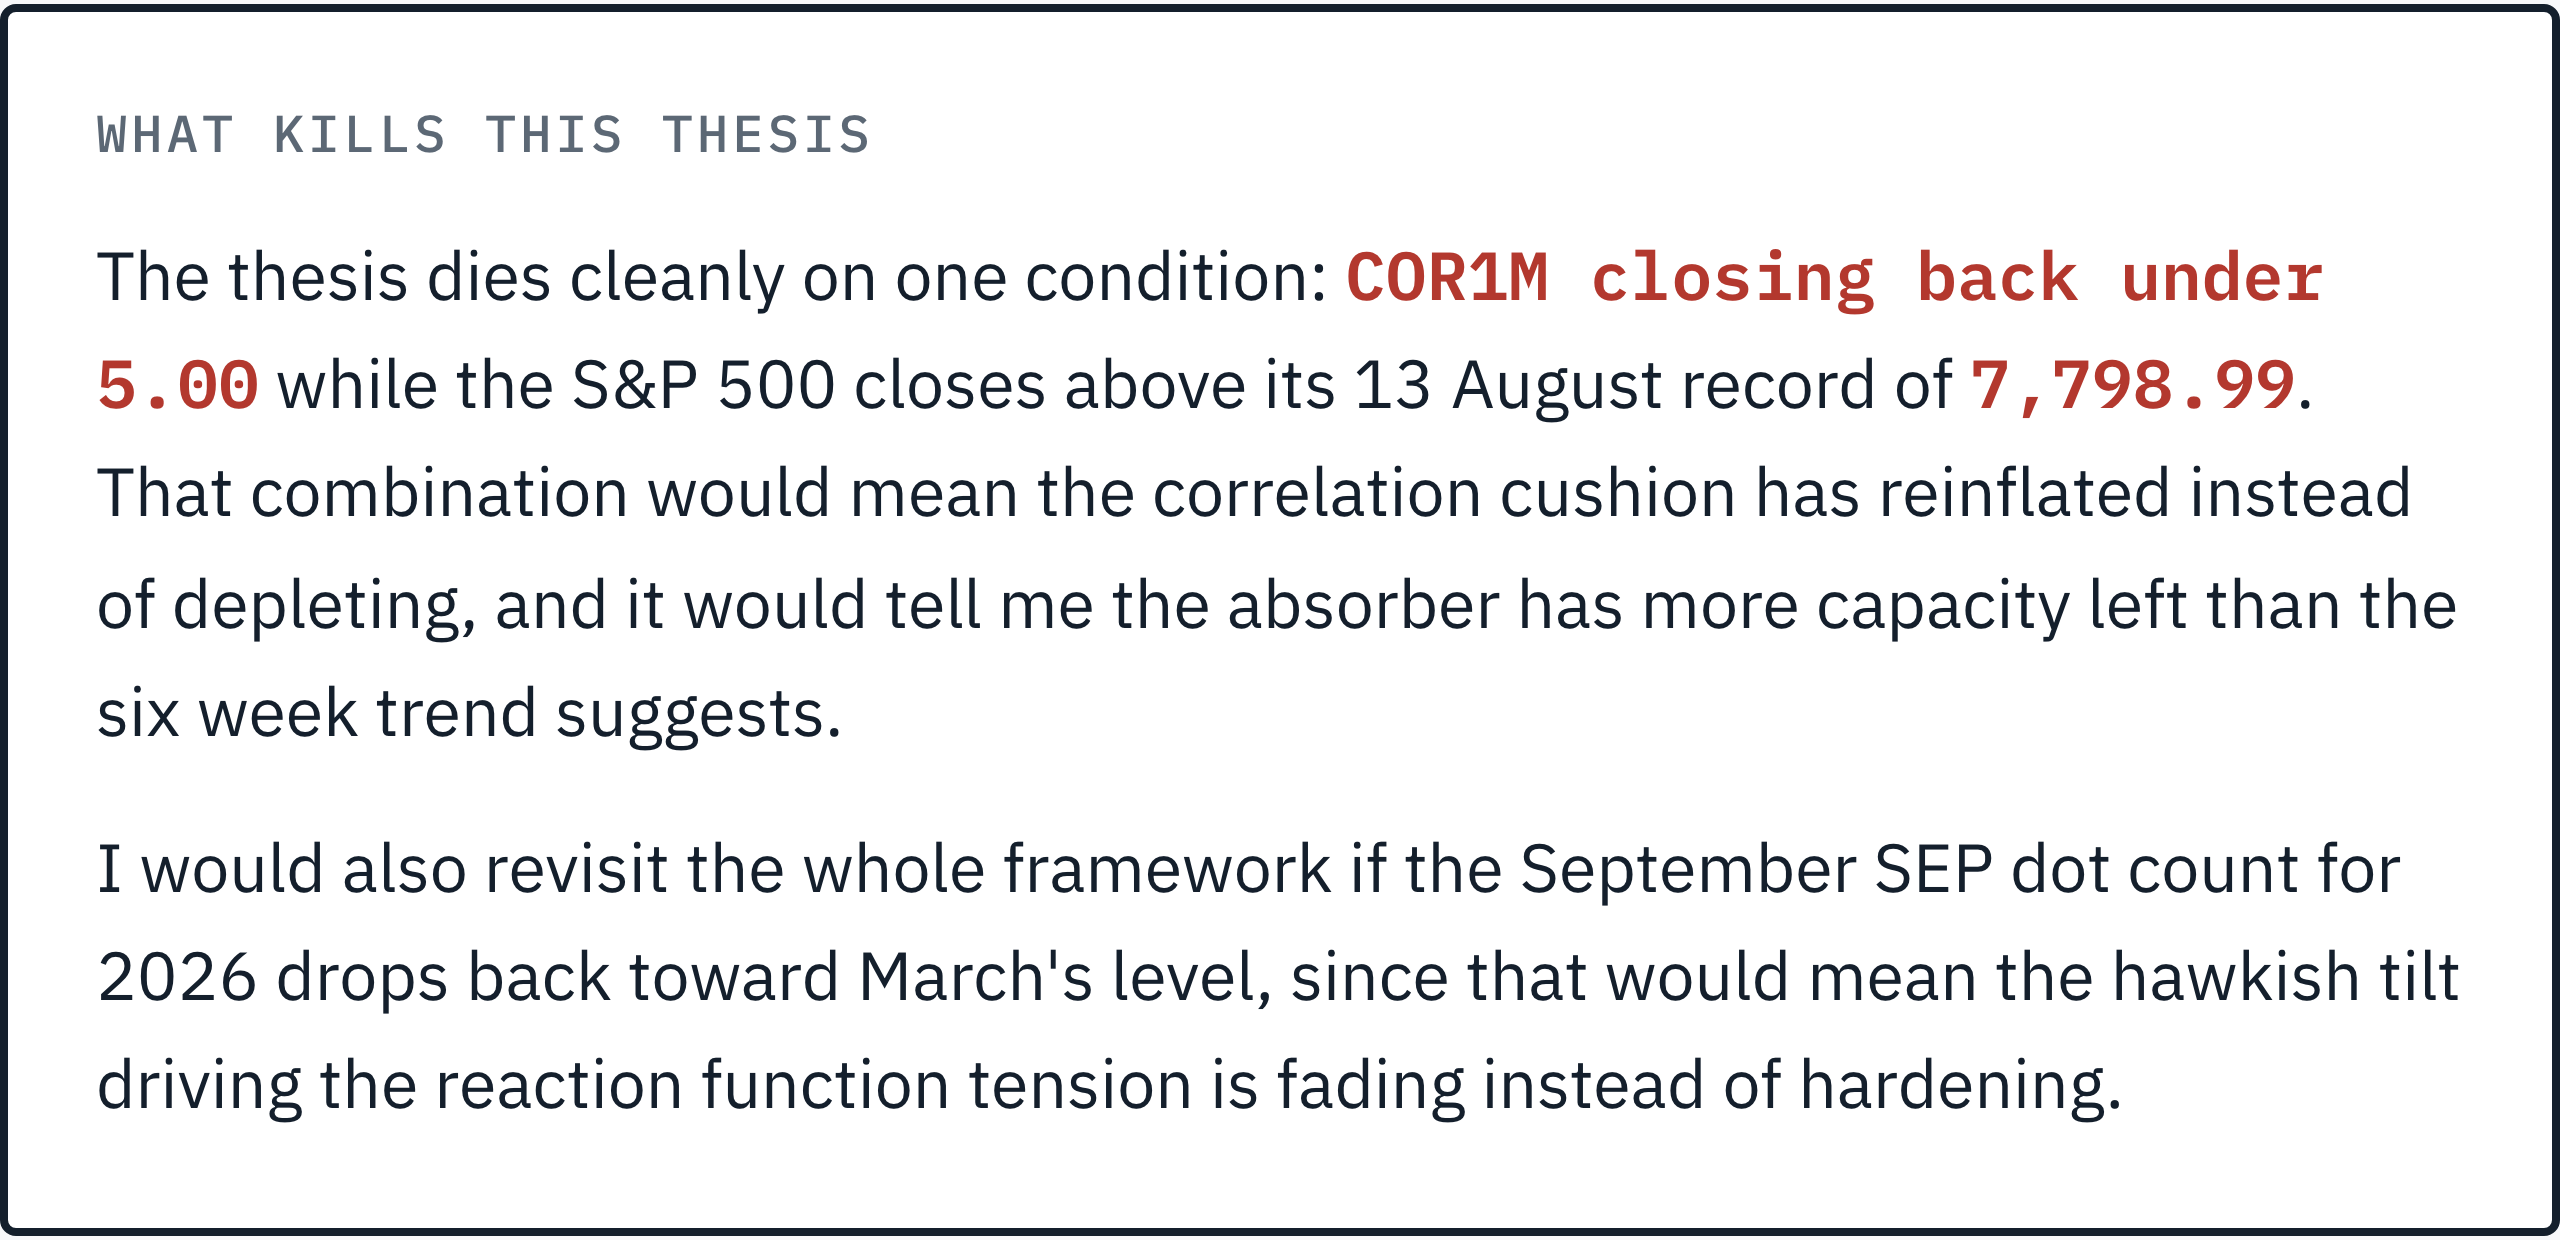
Invalidation here is mechanical, tied to one number: COR1M closing back under 5.00 while the index closes above 7,798.99 would mean the cushion has reinflated the way it briefly did in July. I would drop the view instead of defending it.
The discriminator: why this isn’t a Fed bet
A skeptical reader’s obvious objection: isn’t this just “the Fed might surprise markets” dressed up in options vocabulary? No. The standard Fed-surprise trade bets on the decision, long or short duration into the meeting. My claim is about transmission. I called a pullback to 7,150 in June, when correlation sat at a similarly low 8.02, and the index ran to a record 7,798.99 instead, because correlation fell another 57% over the following three weeks and absorbed the shock I was pricing. Wrong call, right mechanism. The lesson from getting that call wrong once isn’t “the Fed doesn’t move this index.” It’s that the Fed moves it through correlation, and in June that term still had room to fall before it could transmit anything. It doesn’t have that room now, which is a falsifiable, mechanism specific claim, and the reason the redemption question below treats correlation itself as the risk.
The redemption playbook: sequencing a liquidation when correlation is the risk
Here’s the part that matters if you actually need to raise cash inside this window. I’m no longer talking about holding a view; I’m talking about execution. The standard institutional playbook sells the most liquid sleeve first, hedges the rest, and works the balance over days, and it assumes normal regime correlations. That assumption is exactly what this whole framework says is fragile right now. Getting the sequencing wrong during a correlation normalization event turns a manageable redemption into a forced one that crystallizes losses nobody had to take.
Liquidity bucketing. SEC’s DERA research on Form PF data found the typical hedge fund can liquidate about 34% of assets in a single day without fire sale discounting, against average portfolio illiquidity of 71 days, average investor lockup of 173 days, and financing commitments averaging 53 days. 173 plus 53. That’s 226 days of runway against a 71-day liquidation clock. In 84% of funds studied, portfolio liquidity exceeded combined investor plus financing illiquidity. One flag: that’s Form PF data from 2013 to 2015, not a live 2026 read, and 2026 has already produced less comfortable evidence, with multiple BDCs breaching redemption caps as private credit requests outran what the vehicles could pay on schedule. The old baseline is still the right framework; I would not treat its comfort number as current. The redemption problem is never “can I sell fast enough today.” It’s whether tomorrow’s bid still exists at today’s price, the exact question correlation compression obscures.
Sequence liquid, uncorrelated exposure first. Liquid alone is not the same bucket. Institutional desks generally treat 5% to 15% of ADV as minimal impact, rising to 20% to 25% only under real urgency. But ADV headroom on an AI complex mega cap name means little if that name is one of the ten stocks now carrying 40.8% of S&P 500 market cap, against a 26.6% dot com peak. That’s exactly the concentration a correlation event moves as a single block, regardless of how deep any one name’s order book looks on a calm day. Liquid and uncorrelated together is the bucket you actually need first, and it’s smaller than the ADV screen alone suggests. Smaller than it looks on a spreadsheet.
Use VWAP or TWAP for the calm sleeve, POV for anything touched by the catalyst window. A scheduled, historical volume curve works fine for positions with no dated event risk before settlement. For anything tied to the 26 August, 28 August, or 16 September catalysts, participation should track real time volume instead, because those are the days a historical curve stops describing the market you’re trading into.
Execution: blocks, cash buffers, and the regime switch
The sequencing above only holds if the execution mechanics underneath it hold too, and this is exactly where most redemption plans assume a normal market without ever saying so.
Route size through block trades and RFQ before the lit book, ahead of the catalyst. The case study here is Archegos: margin calls “exceeded $13 billion” and counterparty losses ran “in excess of $10 billion” once the position could not be met. Archegos itself convened a weekend call asking its banks to hold off selling together, and no agreement held. Morgan Stanley sold blocks the night of 25 March, Goldman sold over $10 billion more the next morning, and both avoided material loss. Credit Suisse and Nomura moved slower and absorbed $5.5 billion and $2.9 billion respectively once the same positions gapped lower. $5.5 billion plus $2.9 billion. That’s $8.4 billion two banks paid for moving second. Whoever prices the block first, against a market that hasn’t yet repriced, gets the better fill. Everyone downstream absorbs the residual. First mover, better price. Every time.
Hold a real cash buffer, sized to the margin spiral math. A VaR model that assumes stable correlations will size it wrong. Brunnermeier and Pedersen’s margin spiral work shows financing haircuts tighten faster than the policy rate itself moves, because prime broker margining is risk based and reprices in real time as realized correlation rises. Haircuts move faster than rate decisions. Every time. The UK LDI crisis is the clean modern proof: 30 year index linked gilt yields moved roughly 170 basis points in five trading days in September 2022, as collateral calls forced gilt sales that pushed yields higher, triggering the next round, until the Bank of England broke it by buying £19.3 billion of gilts over thirteen days. Most redemption plans I have seen are sized for the wrong regime.
Hedge the sleeve you can’t liquidate today with futures or index puts, and expect that hedge to cost more precisely when you need it, since VIXEQ still sits at the 81st percentile even after falling 22.5% since July. Normal and stressed markets aren’t two points on a spectrum. They’re a regime switch. March 2020 is the reference case, even in the asset everyone assumes is safe: hedge funds sold $173 billion of Treasuries net and cut $232 billion of short derivatives as the basis trade unwound, and NY Fed research shows 10 year order book depth plunged that same window, from a multiyear average near $33 million to a fraction of that. The safest asset in the portfolio isn’t immune to the same mechanics driving the equity thesis above. It’s just a later stop on the same train.
The limits, including my June miscall
I owe you the honest counter case here, and I’m not going to soften it. My own re-test of the correlation statistic weakened it: an absolute COR1M threshold doesn’t predict returns once you control for the series having structurally shifted lower since 2024, and the trailing percentile version of the same signal reads much milder, close to neutral. Fed research from 2000 itself found that a real share of the “correlation rises in a crisis” effect is a statistical artifact of higher volatility inflating sampling correlations, not proof of a genuine change in the underlying distribution. Some of what I’m calling mispriced risk could be measurement noise rather than a regime waiting to snap. I also have one live miscall on this exact index from June, when I underestimated how much further the cushion had left to give. That’s a genuine failure of timing, not a footnote. I don’t think that error repeats identically, since the cushion has visibly less room now, but the honest lesson is that I can be wrong about timing even when the mechanism is right. And Warsh may simply thread the needle his July press conference suggested he wants to: markets read it as dovish even though his prepared text was the more hawkish half, a chair actively managing the gap between decision and tone. A skilled hold on 16 September could extend the calm longer than my base case assumes.
The strongest objection is not mine. Other desks read this same correlation gap in August without the Fed at all. Penn Mutual Asset Management ties it to semiconductor volatility normalizing and earnings season ending, no policy mentioned anywhere in the piece. Citadel Securities goes further and reads it as structurally benign, a vol targeting reset that favors stock pickers. Both are likely picking up something real: some of this compression is mechanical, tied to systematic flows that have nothing to do with Hammack, Kashkari, or Logan. Real, and still incomplete. My claim is narrower. The Fed’s own dissent and its own minutes hand a common trigger to a mechanism that would otherwise need one, and neither desk is pricing that trigger into the vol surface. If NVIDIA and Jackson Hole both pass quietly, their reading wins this round.
What would change this view
The thesis dies cleanly on one condition, and I would drop it the moment that condition is met rather than defend it.
The close: what to watch through September
None of this is a call to cut risk on a hunch. It’s a call to know which number keeps this market calm, because it isn’t the one most desks are watching. The Fed’s own staff already wrote down the valuation and leverage concerns. Three of its own voters already dissented toward tightening. The mechanism connecting that tension to the index runs through a correlation reading sitting at the second percentile of two decades, not through the funds rate itself. One number, doing all the work. If you manage capital that might need to move fast in the next thirty days, the question isn’t which assets are liquid today. It’s which stay liquid, and priced independently of each other, if the correlation term does in September what it did in March. I’d rather answer that now, with the cushion visibly thinner than in June, than find out live.
I break down filings on YouTube and post shorter notes on LinkedIn.
📊 The Decision-Grade Version
This piece is complete on its own. The thesis, the evidence, and what would kill the view are all above, and nothing was held back to sell you a next step.
The Patreon note is a separate piece of work, not a deeper cut of this article. It takes the correlation gap above and turns it into a position, long index optionality financed by short single name optionality on the most crowded names, written the way a desk would act on it: entry, sizing, the stop, and the level that kills it.
→ Read the correlation dispersion trade note
→ Or join the Patreon community for every note
Cover photograph: Federalreserve, public domain, via Wikimedia Commons.