


The consensus, stated the way its believers would state it
The prevailing read isn’t stupid, and I want it at full strength before I take it apart.
Oil is back near $93. Strikes on Iran in late February sent Brent from the low 70s to $138 by April, and the strait carrying about a fifth of world oil supply has been a live question ever since. Against that, the S&P 500 sits at 7,728 and the VIX prints 15.28. Investors have been taught by a decade of headlines that Middle East shocks mean revert inside a quarter, so they’ve stopped paying for protection. When the teaching turns out to be wrong the repricing will be violent, because nobody is positioned for it.
That case has a second leg, and it is the stronger one. The S&P realized 13.6% volatility over the trailing twenty sessions. Against a VIX of 15.28 that is a variance risk premium under two points, which is normal. On that arithmetic the VIX is not low at all. It is priced roughly where the tape says it should be, and there is no puzzle here to explain.
I think the second leg is right and the first is wrong, and the reason is that both are arguing about the wrong number.
Cboe publishes the number, so stop backing it out
Index variance is built from covariances. Collapse the pairwise correlations into a single average term and index implied vol is roughly the weighted average single stock implied vol multiplied by the square root of average implied correlation.
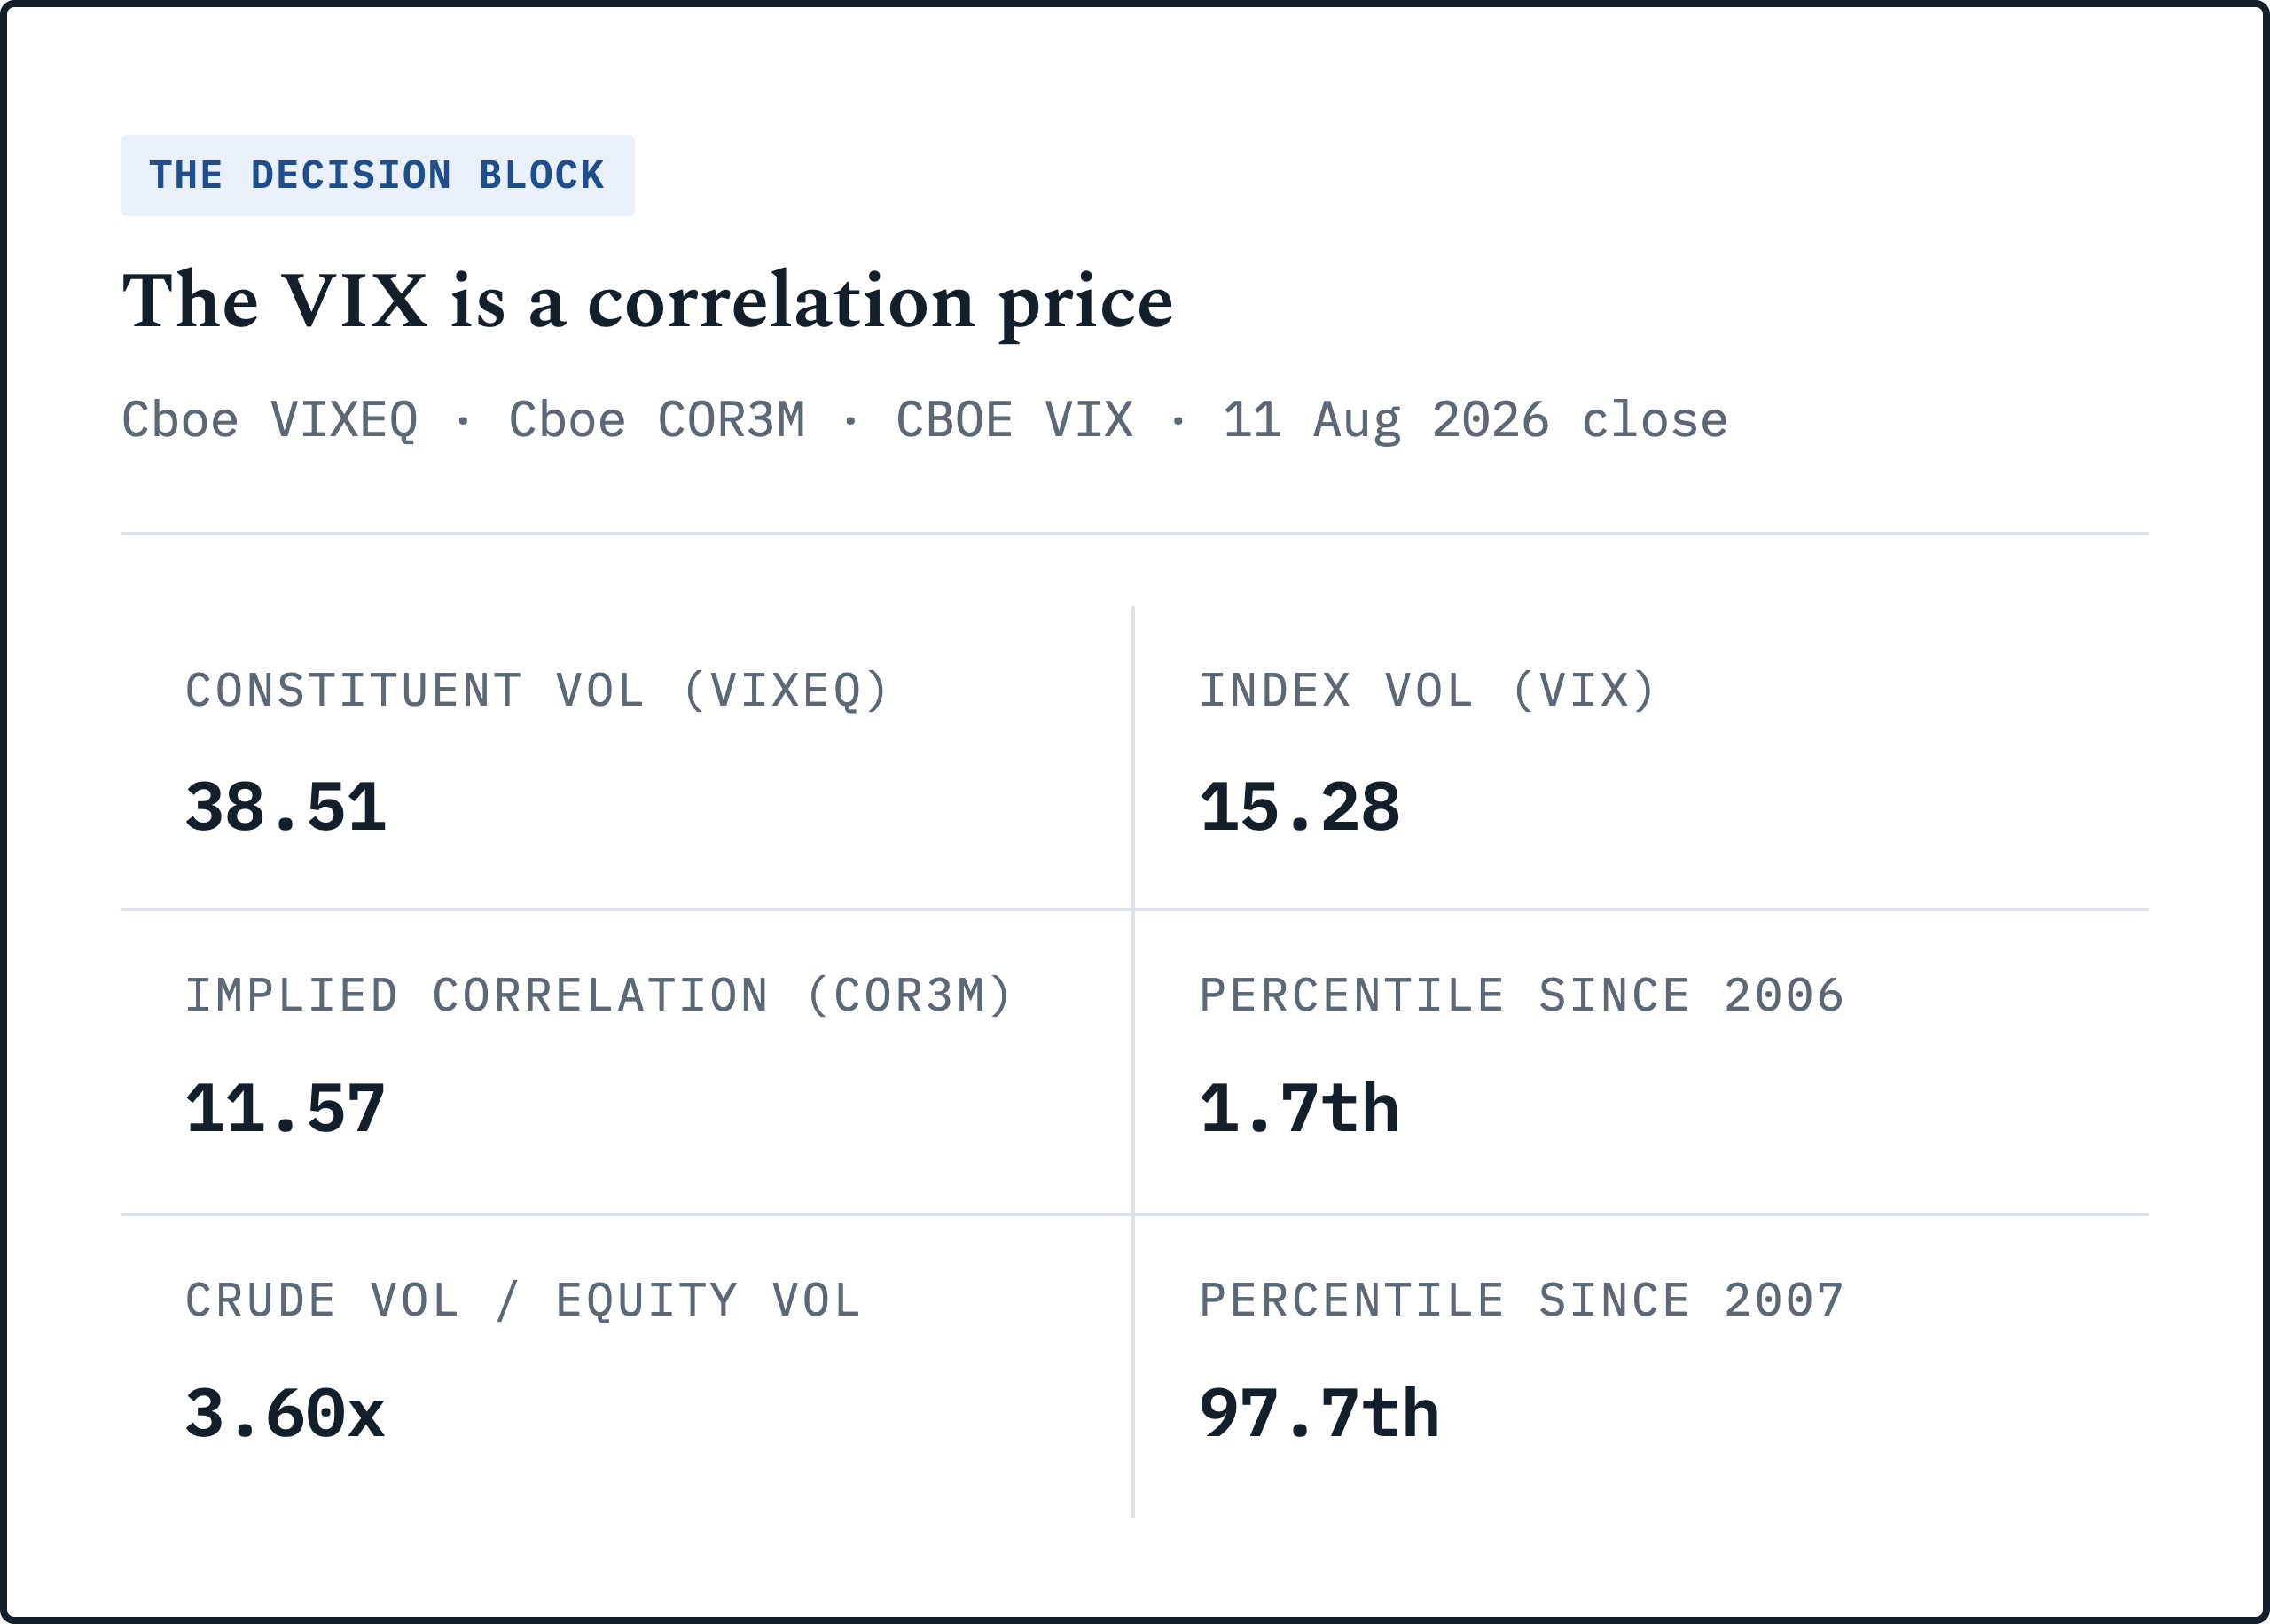
Most people who reach for that relationship invert it, solving for single stock vol from the VIX and a correlation index. I did exactly that in the first draft of this piece and it was a mistake, because Cboe publishes the quantity directly. The S&P 500 Constituent Volatility Index, ticker VIXEQ, is the cap weighted 30 day implied volatility of the index constituents. It is tenor matched to the VIX, it has printed daily since June 2014, and on 11 August 2026 it closed at 38.51 (Cboe index history). My inversion produced 44.92 for the same session, which is 17% too high. There is nothing to back out.
So the spread is observable. VIXEQ 38.51 against a VIX of 15.28: individual names are priced at 2.5 times the index, and the whole of that gap is correlation by construction.
That relationship carries a consequence worth stating plainly. Index volatility can fall while every component gets riskier, provided they get riskier in different directions. An oil supply shock is the cleanest case in the macro catalogue, because it is a wealth transfer whose sign flips by sector. You could watch it on 10 August: oil and gas producers, measured by XOP, gained 5.73%; semiconductors, measured by SMH, lost 2.28%; the S&P 500 closed down 0.06%. Enormous cross sectional variance, no index move.
Energy is now a low single digit share of S&P market cap, far below its 1980s weight, so the index has been progressively stripped of the one sector that gains from an oil shock. On earnings that leaves it more exposed. On volatility it does the opposite, because a thin slice rallying hard against a wider slice selling off moderately is what stops a shock from moving the index in one direction.
None of this is my discovery and I want to be exact about that. The BIS wrote it up in March, CNBC ran a piece on the disconnect in May, Cboe lists four indices for measuring it, and Saxo’s options brief says on the very day I am writing about that the index “is leaning on dispersion to stay calm.” The mechanism is consensus. What it currently implies is not, and that is the rest of this piece.
March already ran this experiment, and now I can measure it properly
The strikes landed before the 2 March session, so the last clean pre war close is 27 February. By 2 March the tape had already absorbed Brent +8.3% and VIX +8.0%, which is why every comparison below runs from 27 February.
From there to the VIX’s peak of 31.05 on 27 March, the index rose 56.3%. Over the identical window VIXEQ rose 8.1%, from 40.98 to 44.29.
That is the argument in two published series, with no inversion and no model. Decomposing the log move, single stock volatility accounts for 17.4% of the March VIX rise and correlation accounts for 82.6%.
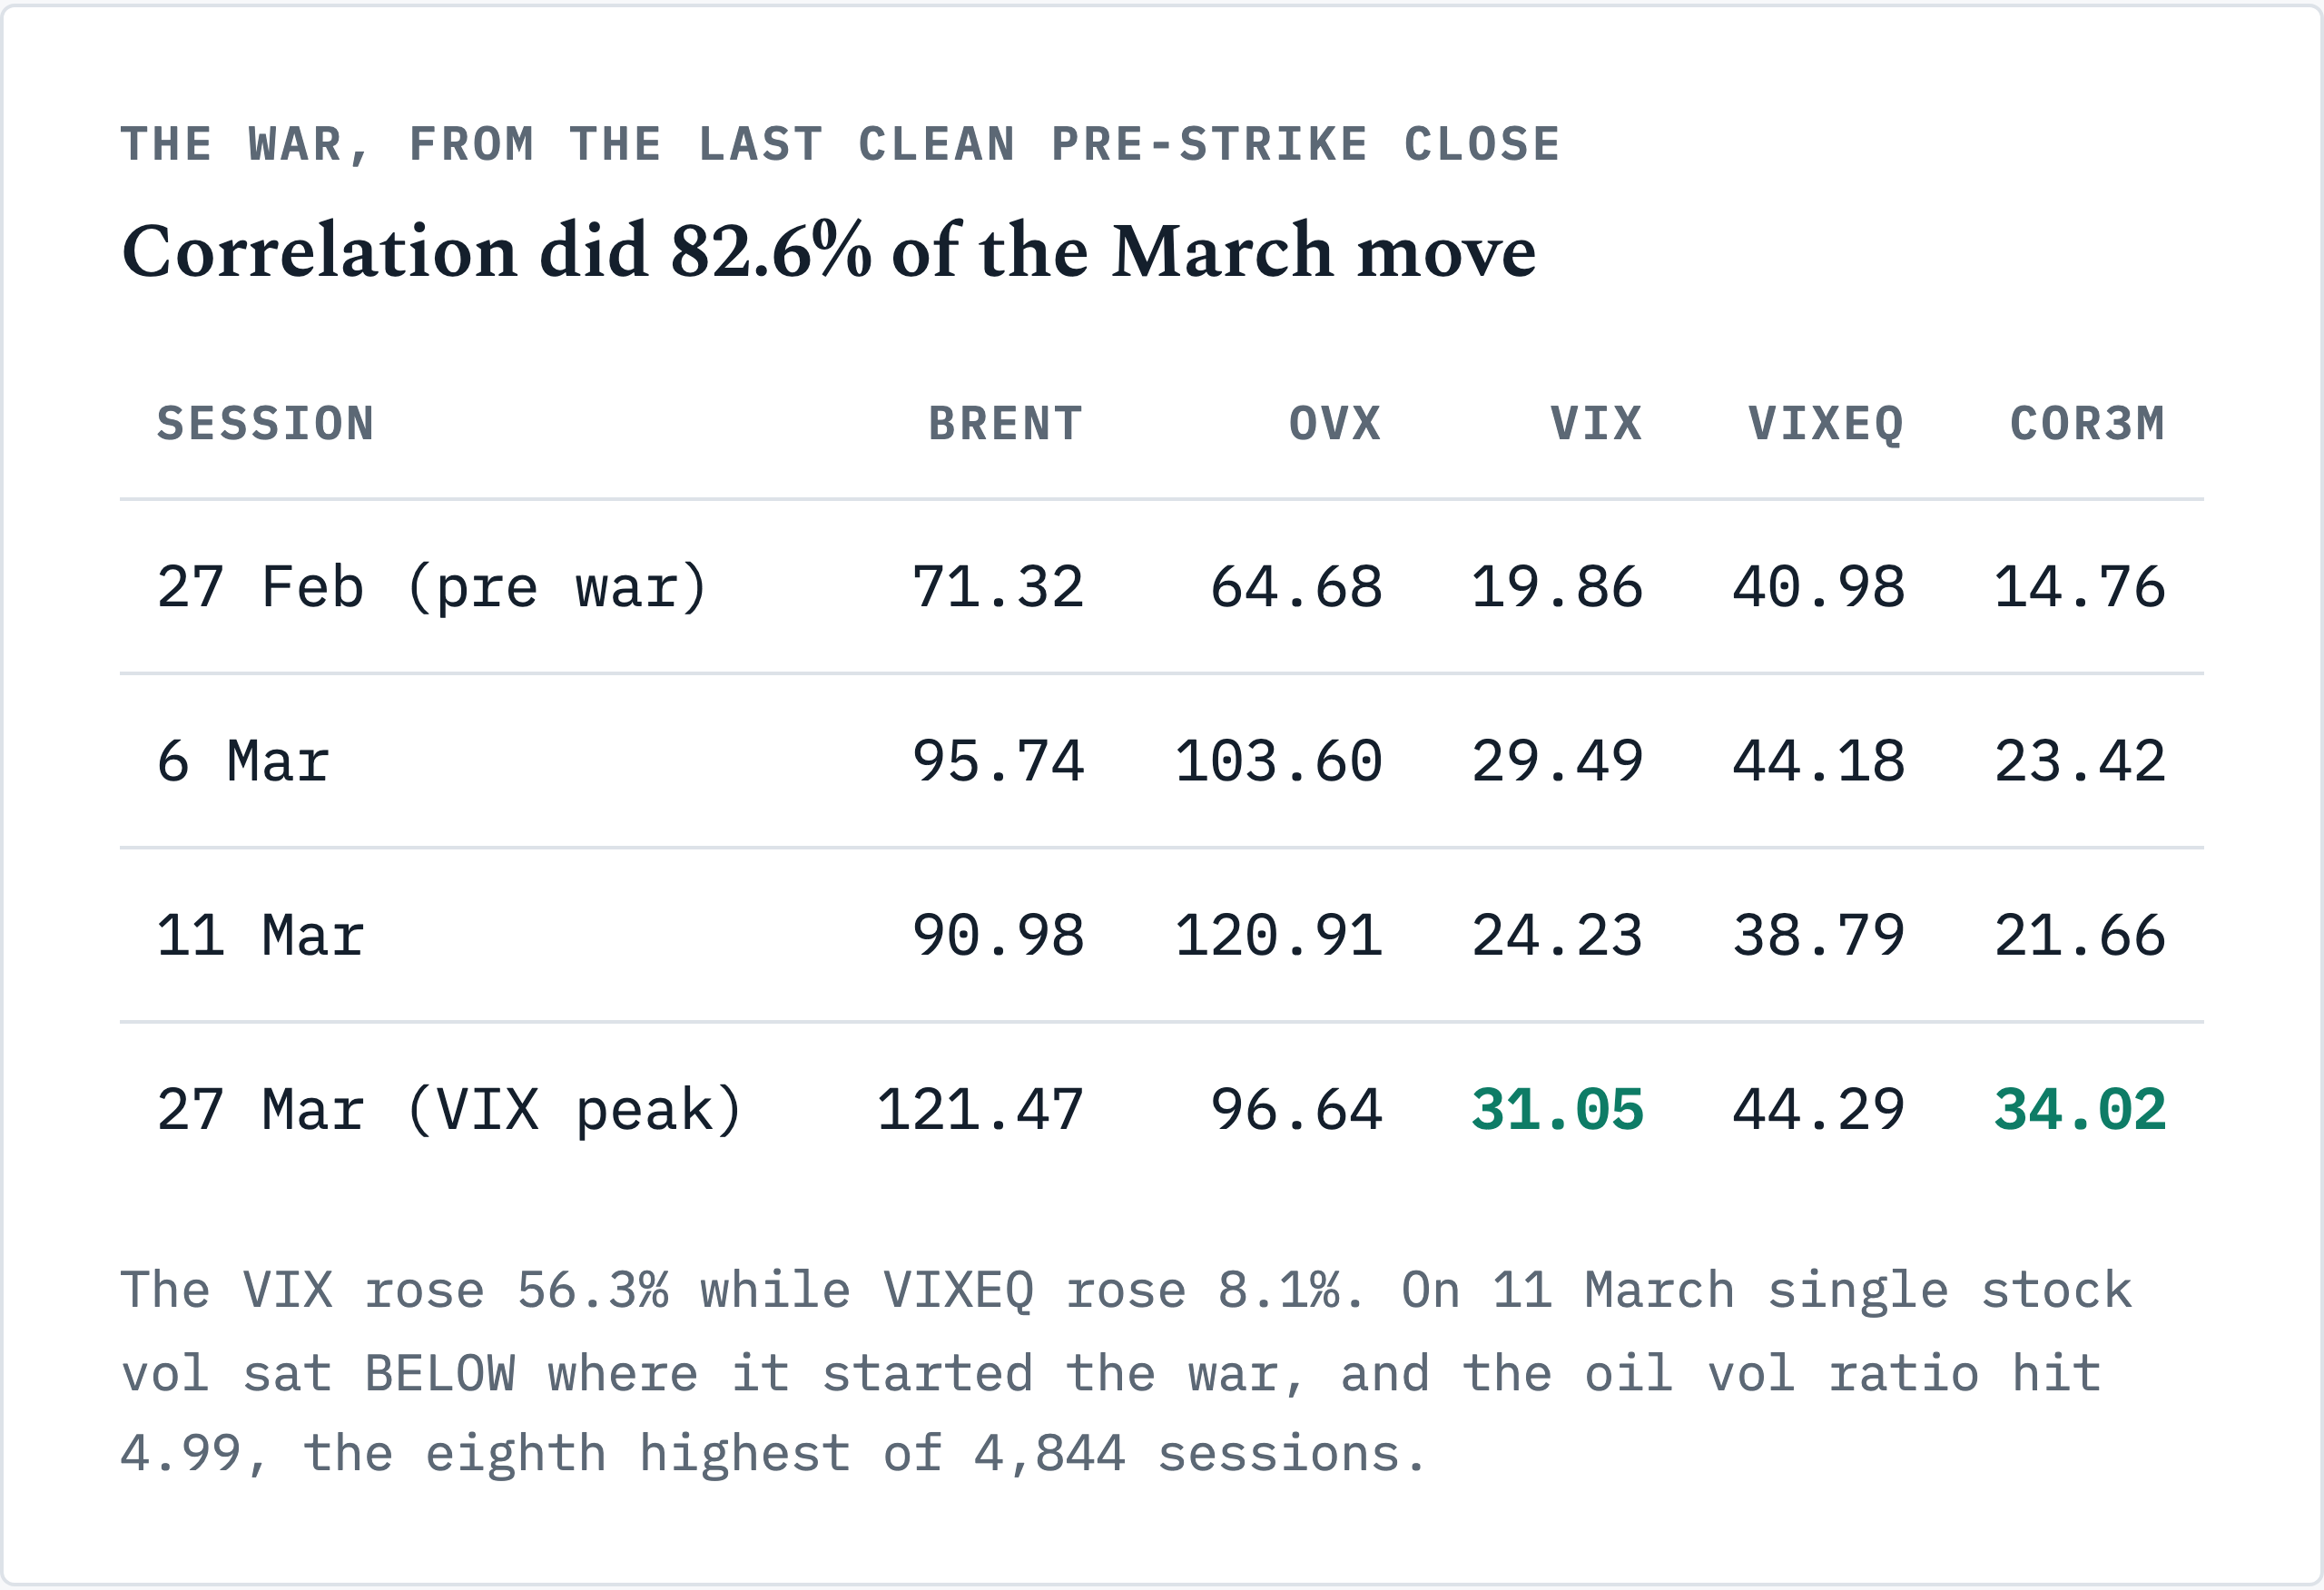
Read the 11 March row twice. Single stock vol that day was 38.79, below where it started the war, while the VIX sat 22% above its pre war close and the oil vol ratio hit 4.99, the eighth highest of 4,844 sessions. Brent ran +65.6% across twelve sessions to 18 March and peaked at $138.21 on 7 April.
One correction to my own framing, because it cuts against me. I first wrote that March was the receipt showing VIX calls are the wrong instrument. It shows nothing of the kind. A 56% rally in the underlying of a convex contract pays a call buyer very well, and the dispersion research I cite recommends out of the money VIX calls as precisely that hedge. The honest claim is narrower: crude vol delivered more convexity per dollar, and the VIX call was a correlation position in disguise.
The episode also round tripped, which my first draft left out. A ceasefire in early April took the VIX back to pre war levels and the S&P recovered its war losses by mid April; Brent was near $76 by 8 July. Fresh strikes on 8 July then produced the cleanest test of the mechanism, and it is the one I should have led with: within days COR3M printed its all time low of 7.19, on 10 July, across 5,168 sessions since 2006. A live shock, and the correlation cushion went to a record.
What the tape is paying for, and the context I owe you
Take the five sessions from 4 to 11 August. Brent went $86.47 to $93.26, up 7.85%. The VIX went 16.50 to 15.28, down 7.39%. Cboe’s crude oil volatility index went 53.45 to 54.99, and the ratio of oil vol to equity vol closed at 3.60.
I ranked that ratio across every session since 10 May 2007 where both series exist, 4,844 of them. 4,731 are lower, the 97.7th percentile against a series mean of 2.05. Only 137 sessions ever printed above 3.5, and eight of the ten highest fall in the last two weeks of April 2020, when WTI settled below zero.
That percentile needs a caveat my first draft omitted, and a professional finds it in one line. Seventy three of those 137 sessions are in 2026 alone, and 66 of this year’s 152 sessions printed higher than 3.60. The 2026 monthly means run 3.74 in March, 4.05 in April, 4.10 in May, 3.30 in July and 3.55 in August. Today’s reading is not a fresh dislocation. It is a five month regime, and it is narrowing from the spring extreme.
That makes the point stronger. The market has been pricing this war in crude and declining to price it in equities continuously since March.
