


Citco’s July hedge fund data show the only profitable size bracket was too small to register in the firm’s own flow tables, while the size tier the Bank of England had already flagged as crowded absorbed most of the year’s new money anyway.
The consensus: a down month that didn’t slow the money
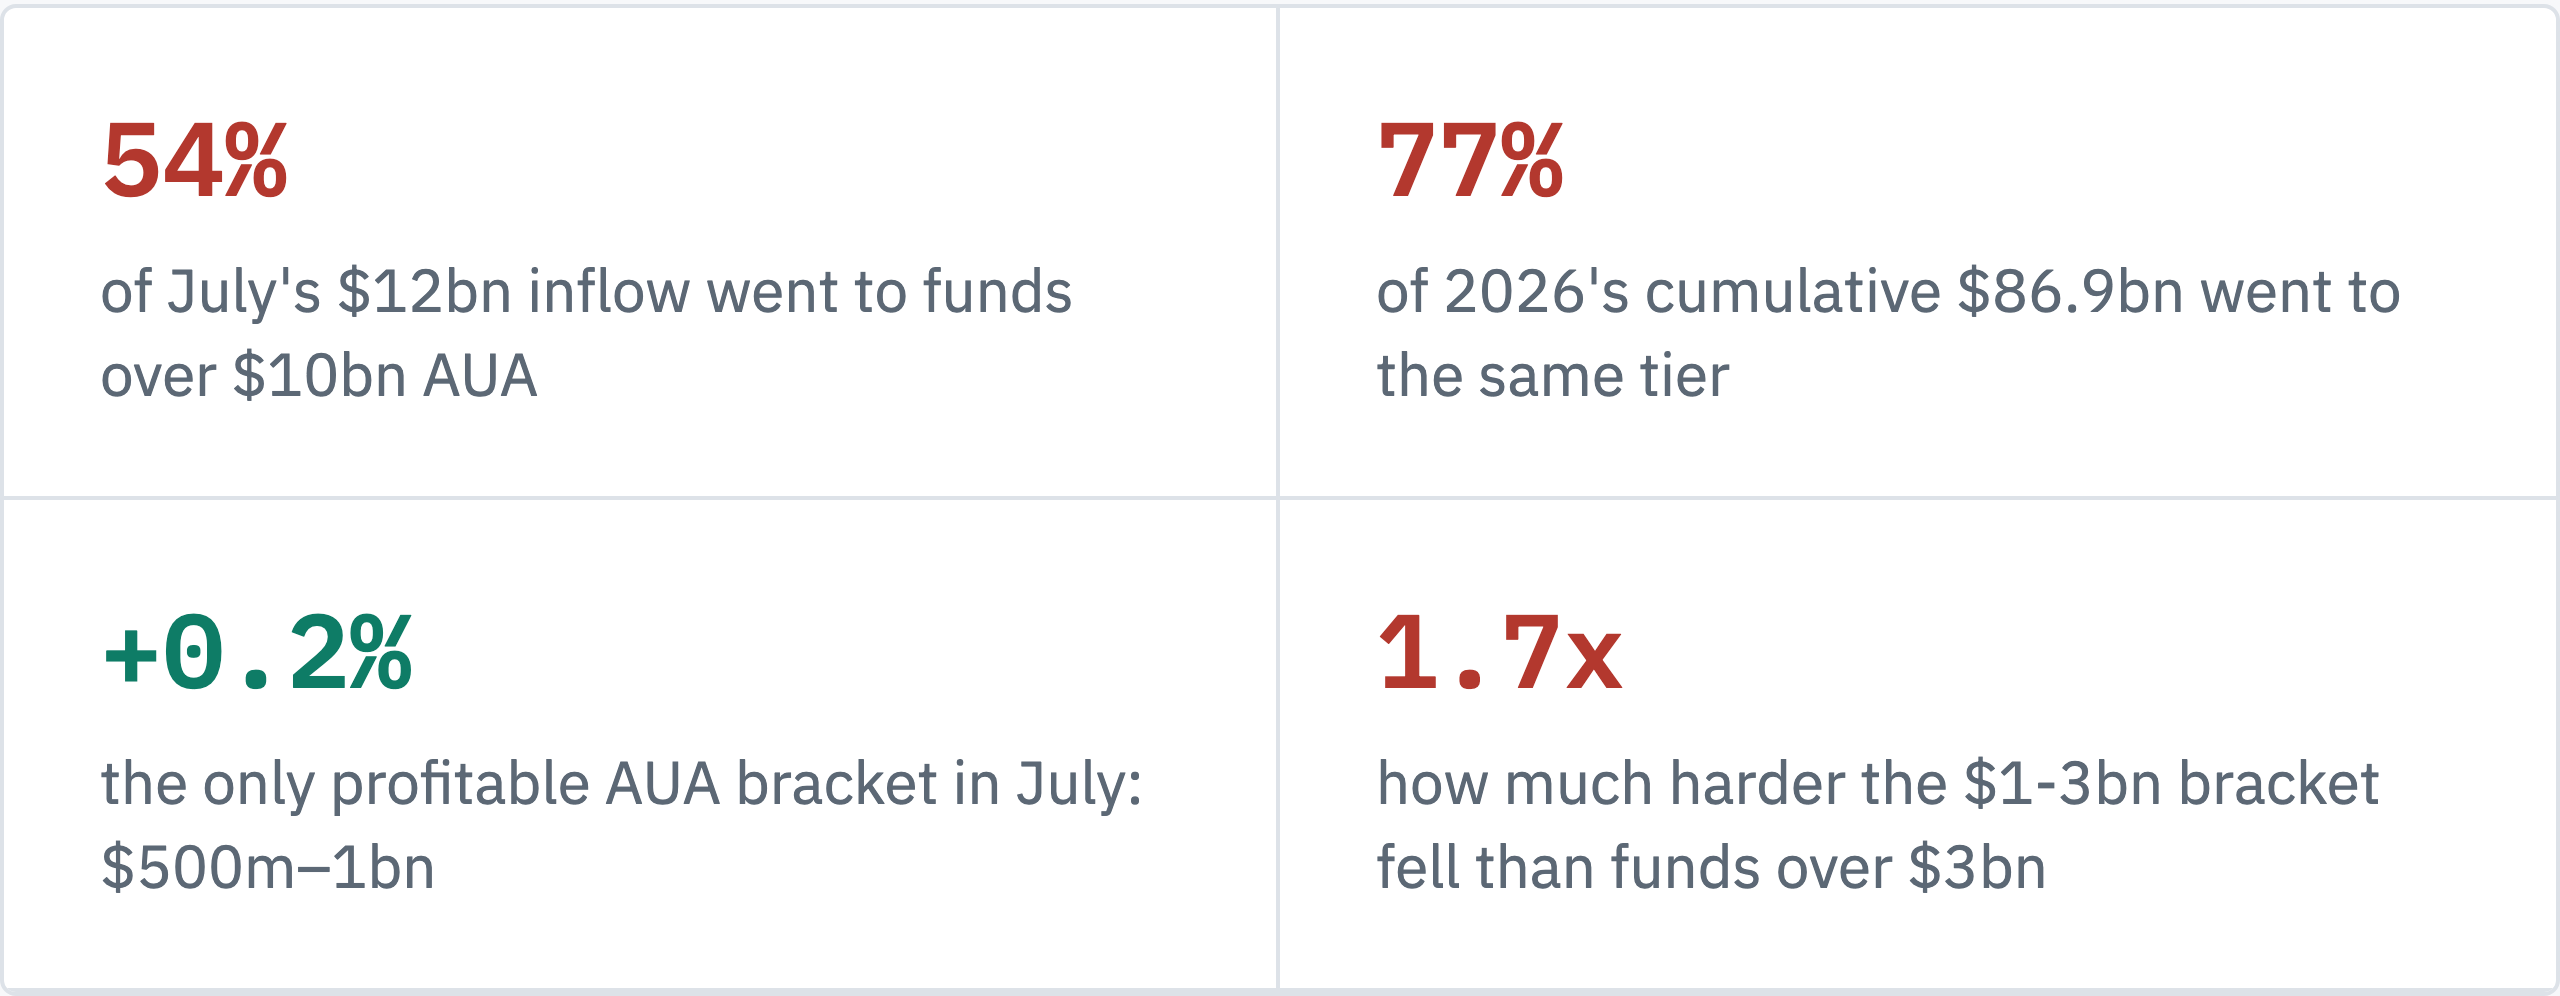
I expect most trade coverage to read July the way Citco’s own release invites it to be read. Funds lost 0.8% on a weighted average basis, their first losing month since the second quarter opened. More than half still finished in the black. Investors didn’t blink. No pause at all. $12bn of net new capital arrived anyway. That’s a seventh straight month of inflows, taking 2026’s cumulative total to $86.9bn against $8bn of redemptions on $20bn of subscriptions Citco: Monthly Hedge Fund Update, July 2026. Multi-strategy platforms, the pod shops running dozens of internally netted books under one balance sheet, absorbed $5.3bn of July’s total and $49.2bn of the year’s $86.9bn. That’s 57 cents of every dollar raised in 2026, going to one strategy family. Dispersion between the best and worst performers narrowed too, from 10.9% in June to 9.9% in July, which Citco’s own framing reads as the industry holding together, not fracturing.
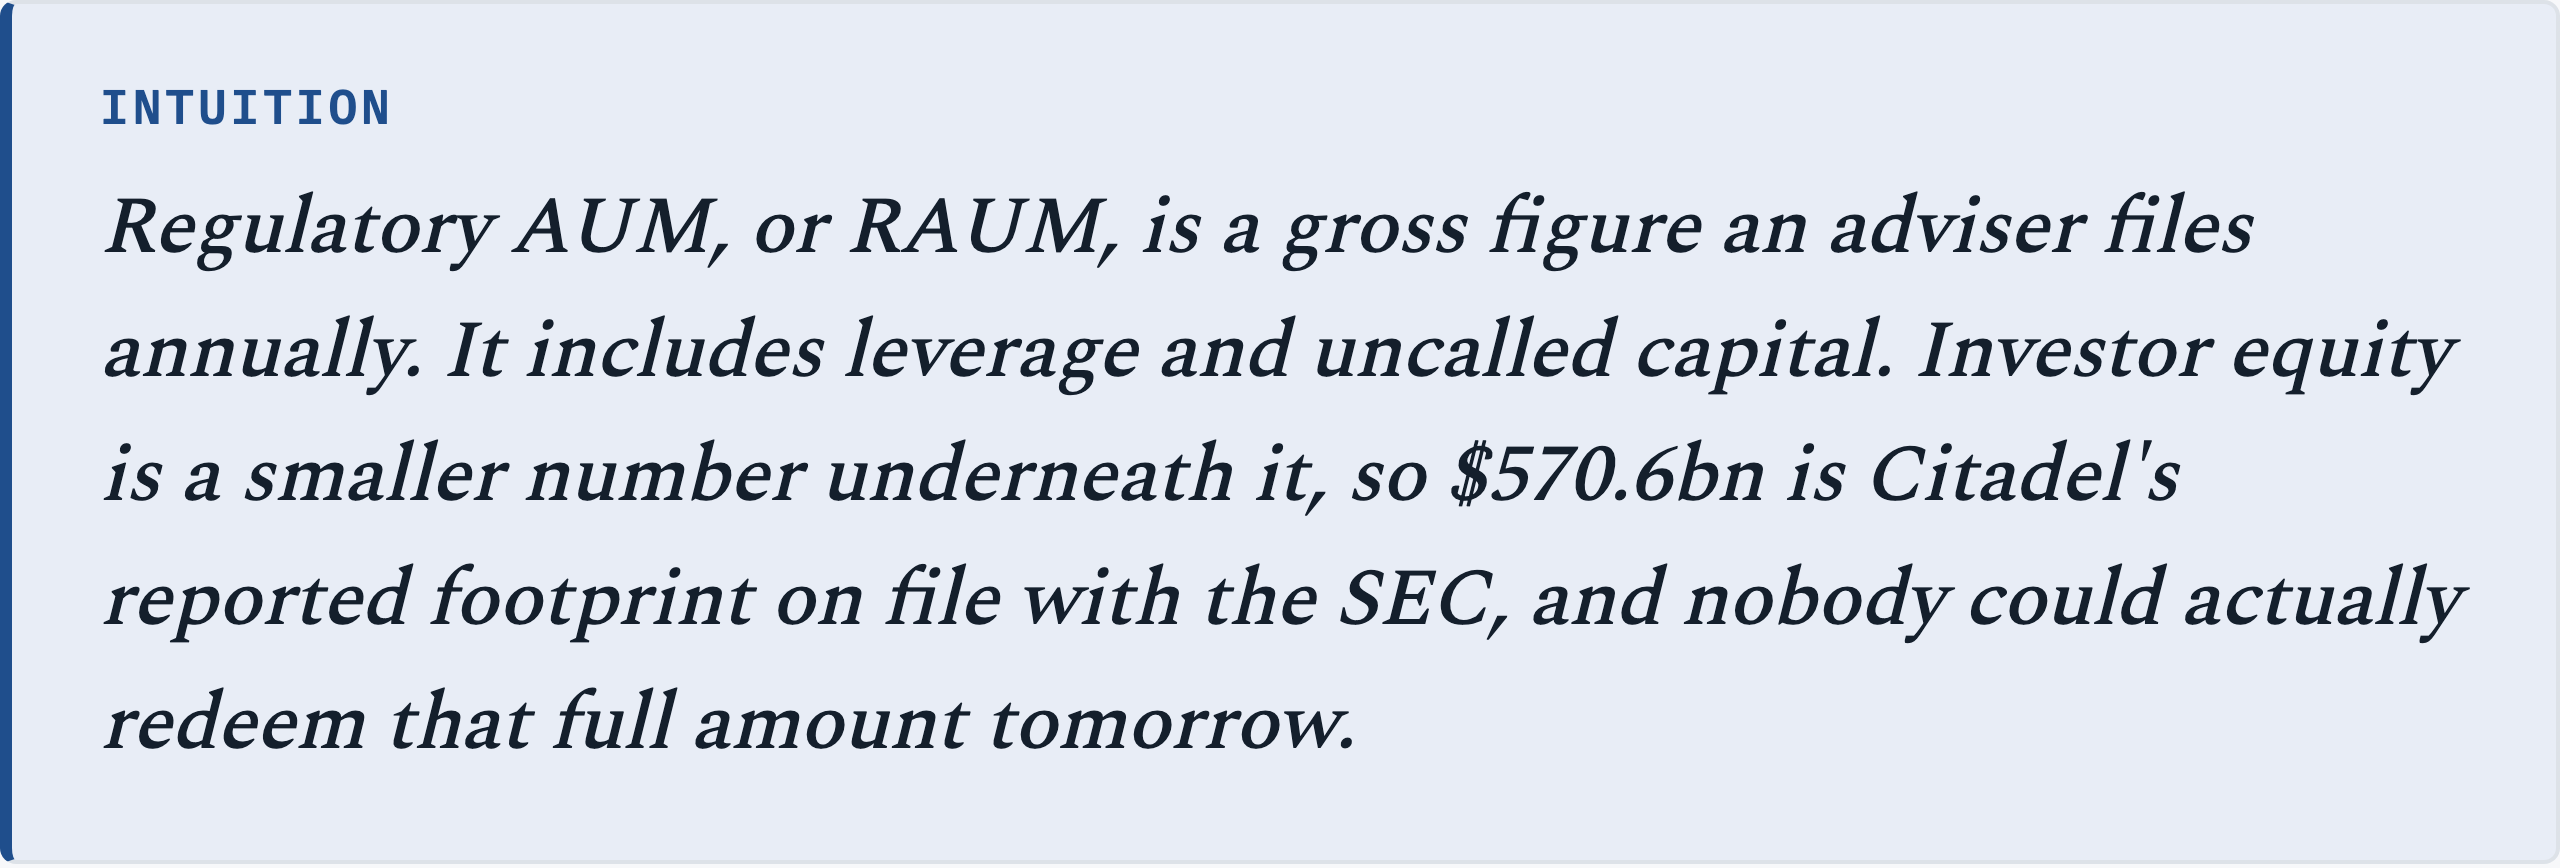
I don’t dispute that arithmetic. A sophisticated allocator draws the obvious conclusion from it: multi-strategy funds diversify away single strategy drawdowns, their scale buys better financing terms and faster capital deployment, and investors are simply paying for demonstrated resilience. Scale reads as safety. A clean story. It isn’t an unreasonable belief on its face. I’d call it the same belief that carried Citadel to roughly $570.6bn of regulatory AUM, filed 11 June 2026 SEC: Form ADV, Citadel Advisors LLC, CRD 148826, and Millennium to roughly $720.8bn, filed 31 March 2026 SEC: Form ADV, Millennium Management LLC, CRD 158117.
That’s the story the flow numbers tell on their own, and on their own I think it’s incomplete. The reason sits one table over, in the section Citco’s release never actually cross references against the one above it. I did that cross reference myself, and it changes the read.
The bracket nobody is funding was the only one that made money
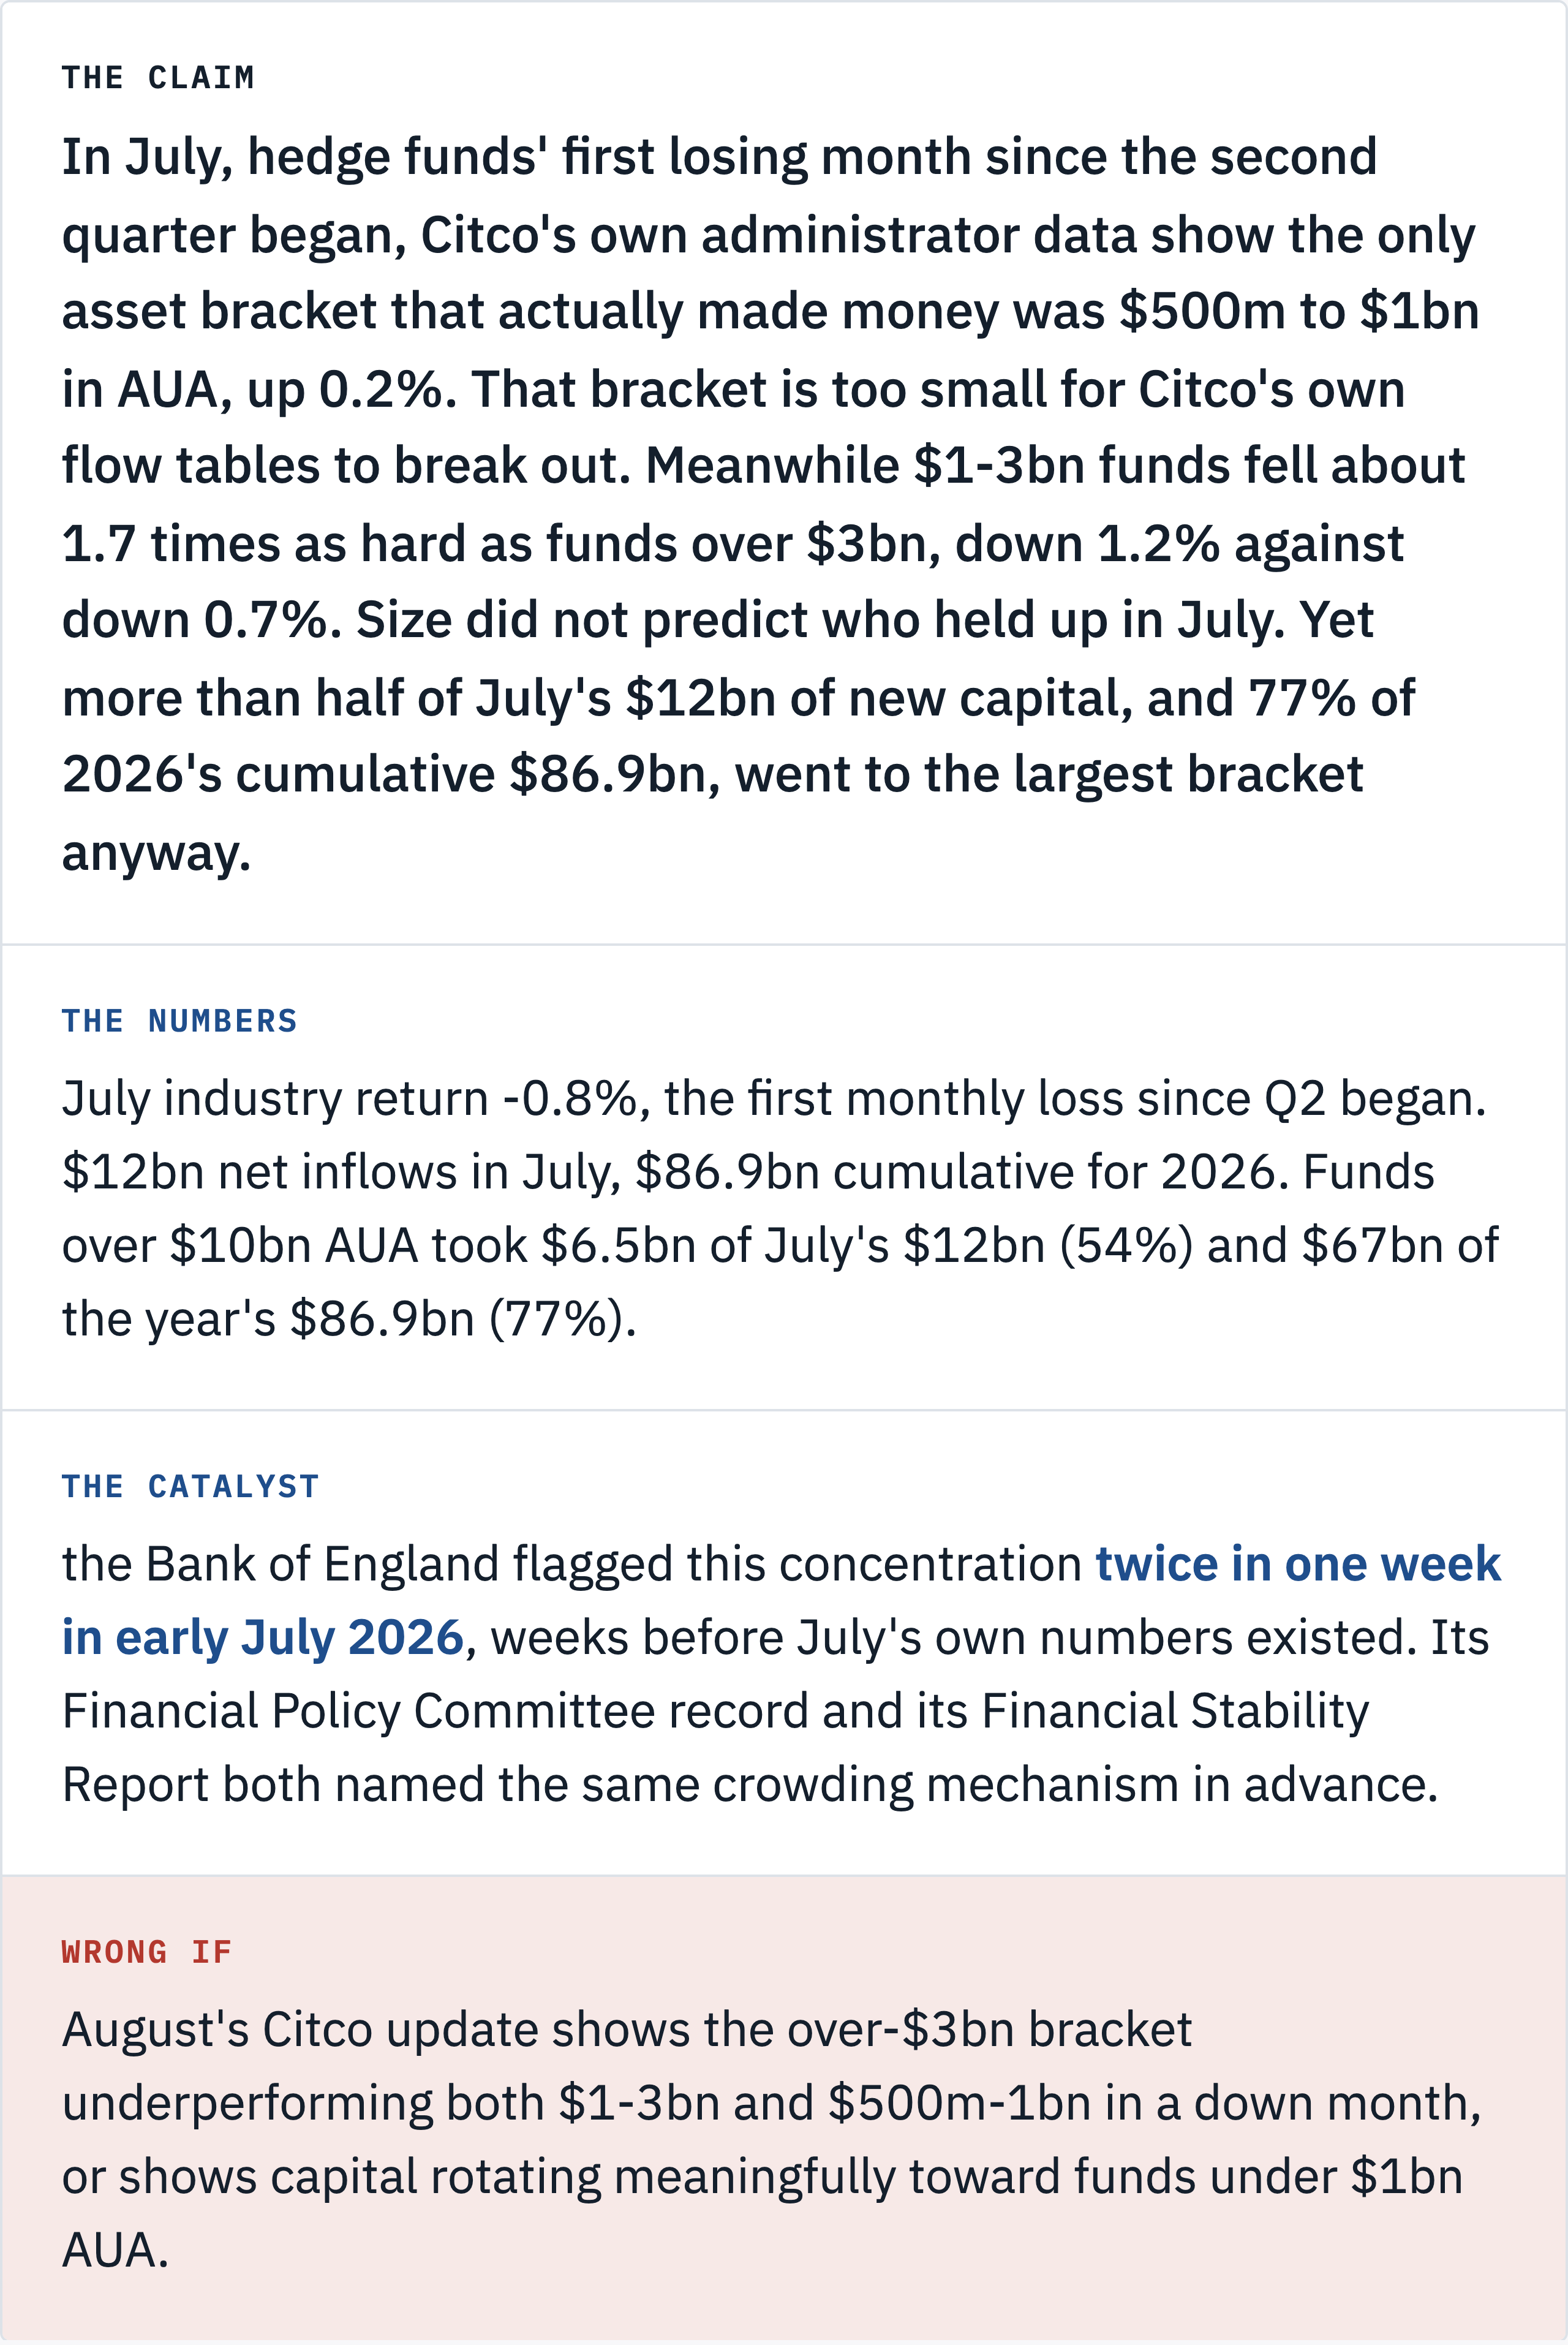
Citco reports July performance across five AUA brackets: under $200m, $200-500m, $500m-1bn, $1-3bn, and over $3bn. Exactly one of those five made money in July. It was $500m to $1bn, at +0.2% Citco: Monthly Hedge Fund Update, July 2026; the full bracket table sits behind Citco’s own download form, so I am also citing the independent trade-press writeup that reproduces every figure in it verbatim Hedgeweek: Hedge funds post first monthly loss in three months as July inflows reach $12bn. The under-$200m bracket fell hardest, down 1.6%. The $200-500m bracket fell 0.9%. The $1-3bn bracket fell 1.2%, materially worse than the largest bracket, over $3bn, which fell only 0.7%. I make that a 0.5 percentage point gap, or a 1.7x ratio, between two brackets sitting right next to each other on the size ladder, with the smaller one losing more. Bigger isn’t simply worse here. It isn’t simply better either. The relationship has a floor in the middle. Not a slope at all. That shape is a dip, not a slope, and it is the whole finding.
Now put the flow table beside it, which is the step I think Citco’s own release skips. Citco reports flows across a different, coarser set of brackets: under $1bn, $1-5bn, $5-10bn, and over $10bn. Funds over $10bn took $6.5bn of July’s $12bn, 54% of the month’s entire haul, and $67bn of the year’s $86.9bn, 77%. Funds under $1bn AUA, the segment that contains the one bracket that actually made money in July, took $0.5bn of the month’s $12bn. That’s 4%. Almost nothing.
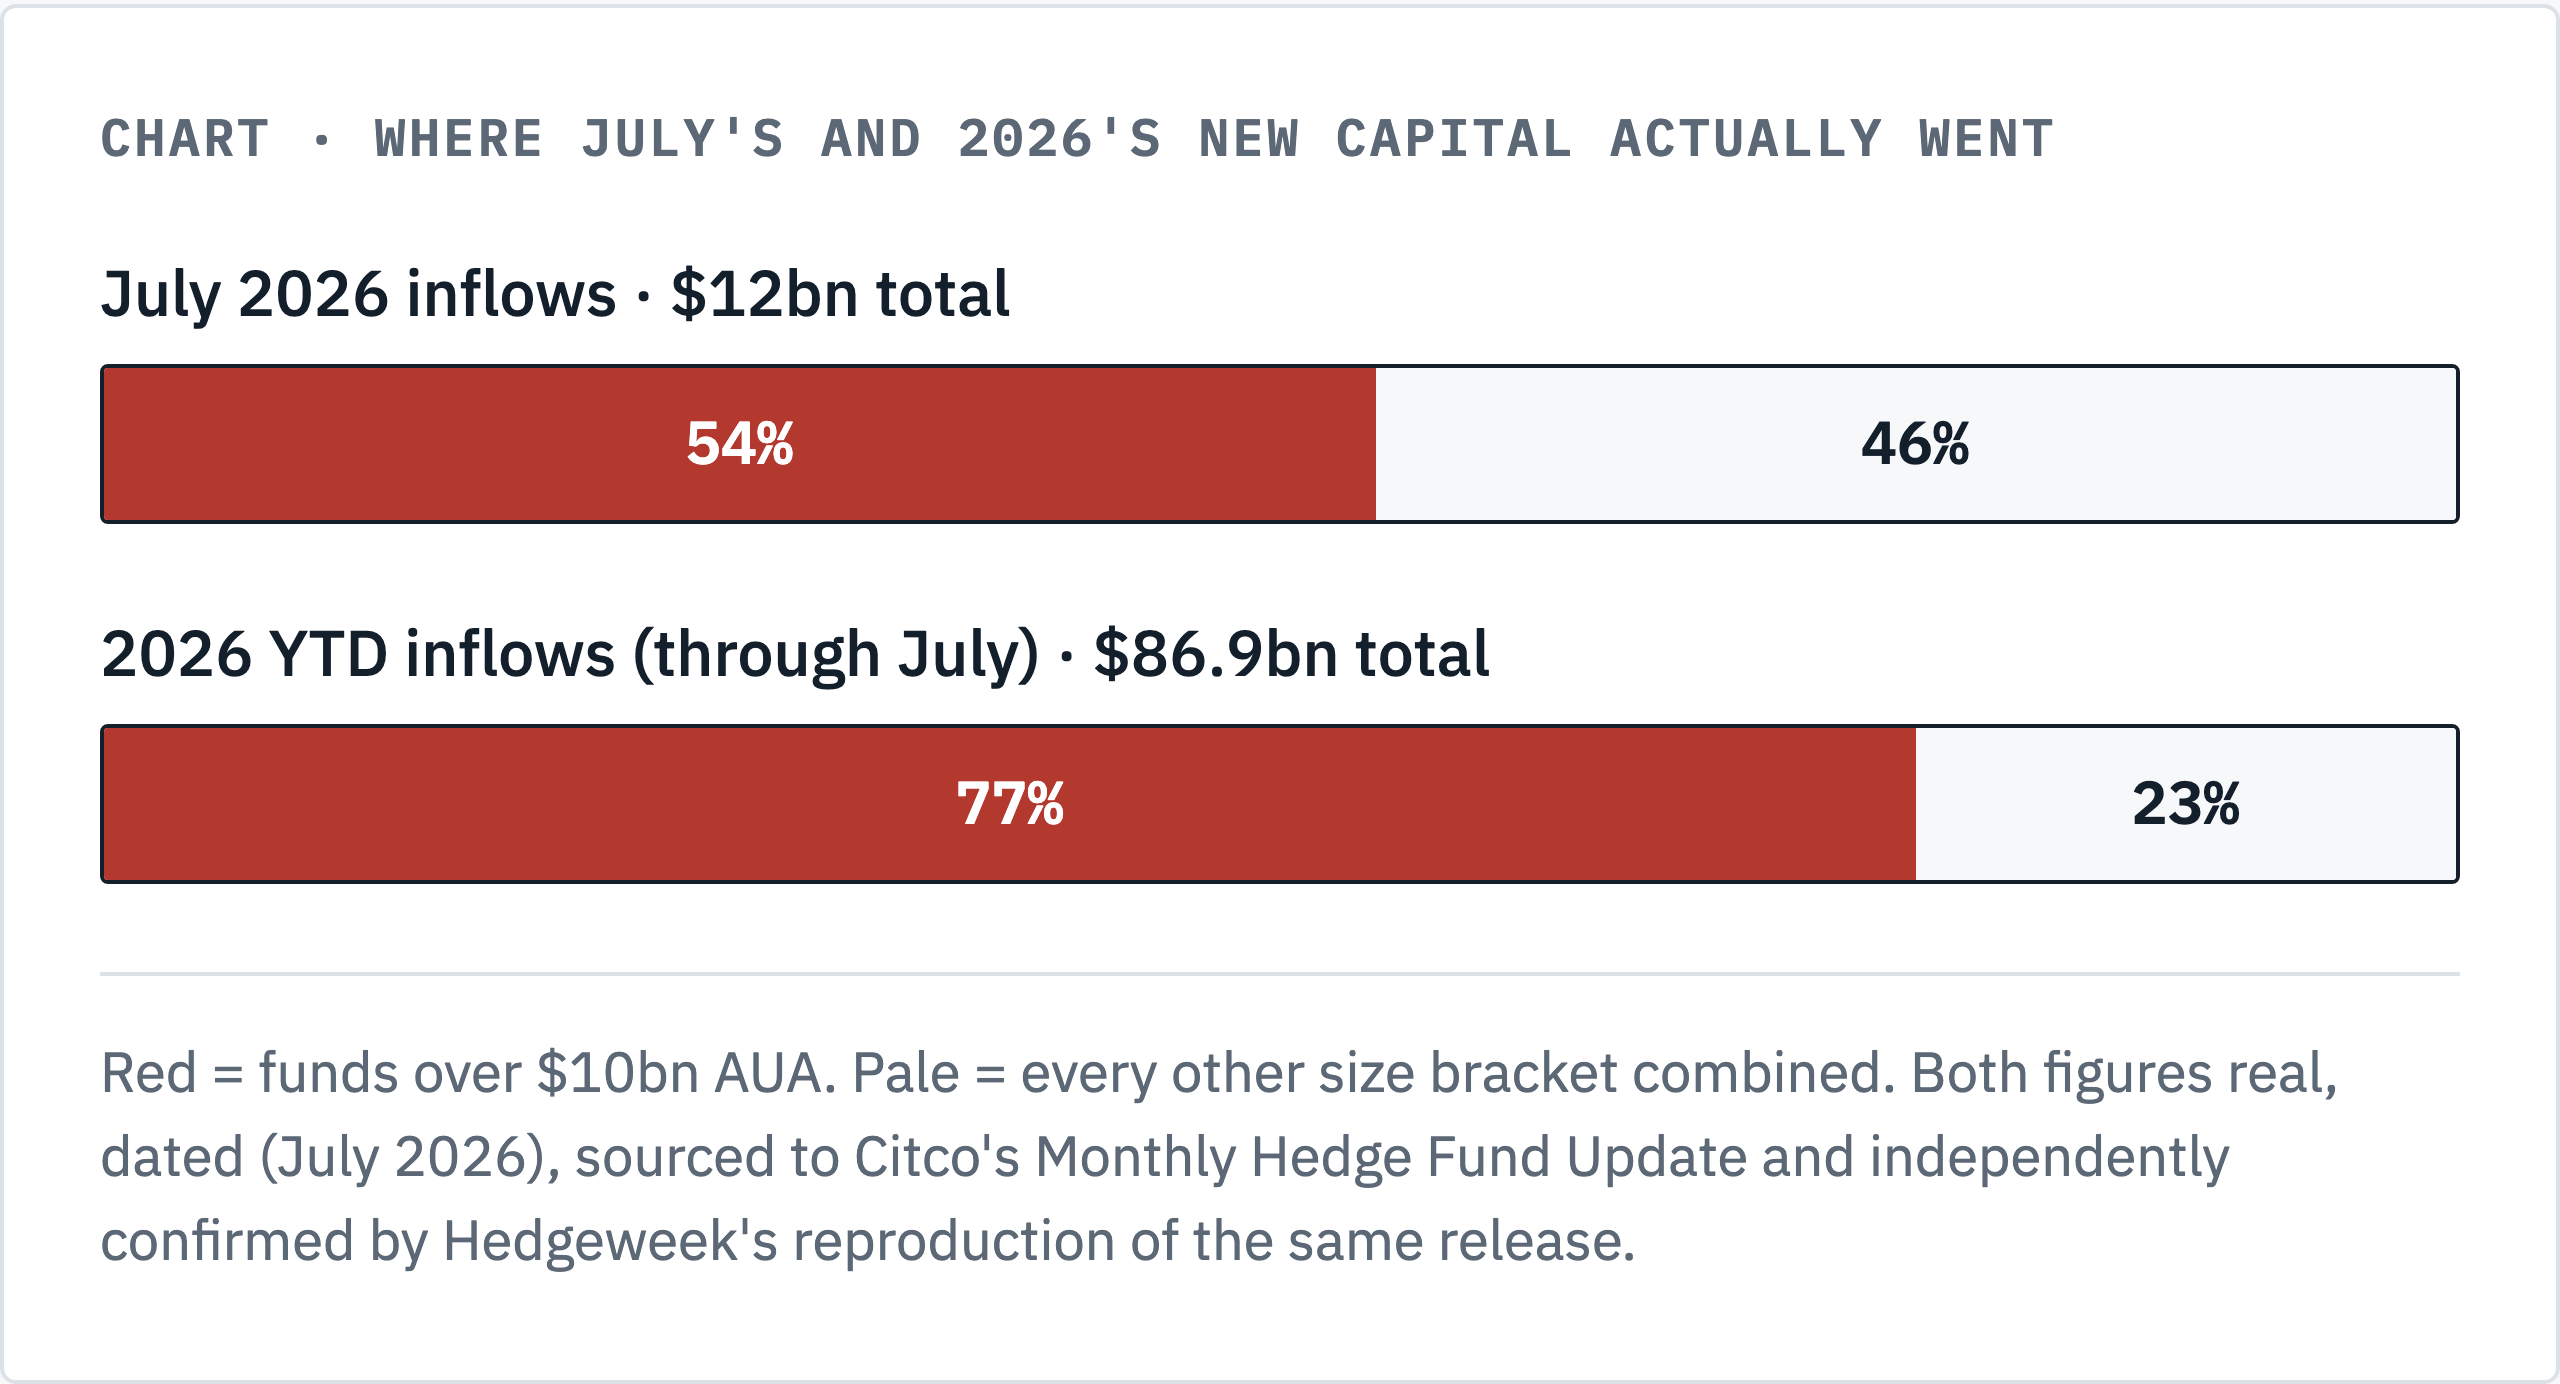
I want to be precise about what this comparison can and can’t prove, since the two tables use different brackets; I’ll come back to that limit below. But the comparison that survives the mismatch is simple. The flow data are heavily monotonic: more scale draws more capital, almost without exception. The performance data aren’t monotonic at all, in the one month that actually tested them. My read: the market is paying for a relationship July’s own numbers don’t show.
Why I think the mechanism is crowding, not just sector exposure
A skeptic’s first objection here is the right one to raise, and I want to name the strongest version of it, not a softer one. Reuters reported JPMorgan’s own read of July: “crowded bets on technology stocks which, when markets turned sour, prevented speculators from exiting at more profitable levels,” with global funds down closer to 3% by that estimate against Citco’s -0.8% Reuters via Yahoo Finance: Hedge funds’ 2026 gains dented by tech trades in July, JPMorgan says. The gap between JPMorgan’s ~3% and Citco’s -0.8% is itself worth flagging: two credible sources, different scope (a broader industry read against one administrator’s book), genuinely disagreeing on magnitude. I am not resolving that conflict, only disclosing it. Two reads, one month. Equity strategies fell 2.7% in July, the worst of any category, and fixed income arbitrage fell 1.2%, the second worst Citco: Monthly Hedge Fund Update, July 2026.
Weeks before July’s numbers existed, the Bank of England issued two related warnings. Its Financial Policy Committee record named concentration in sovereign-debt-adjacent markets: “many of these markets are characterised by a relatively high use of leverage by a small number of hedge funds pursuing similar trading strategies across jurisdictions” Bank of England: Record of the Financial Policy Committee meeting, 26 June 2026. Its companion Financial Stability Report, published the same week, is the more directly relevant one, and I under-used it in my first pass at this piece: hedge funds’ equity prime brokerage balances “have increased by around 40% over the past year,” with positions “more concentrated in particular sectors, such as semiconductors... coinciding with the ongoing AI-linked stock price momentum” Bank of England: Financial Stability Report, July 2026. Same story, earlier document. That is the JPMorgan story, named by the BoE in advance. The same report ties the two together, warning of “cross-market interconnections if funds making losses on equity positions deleverage across other markets – including sovereign debt – in response” Bank of England: Financial Stability Report, July 2026. Read that way, the gilt-market warning is the spillover channel out of the same equity crowding JPMorgan later blamed for July’s losses, not a separate, more dramatic risk I reached for instead. One risk chain, two documents.
I will not oversell how rare this warning is. Similar language recurs close to continuously: BlackRock issued its own crowding warning in April 2026. The FPC named the mechanism in advance. It did not predict July, and I am not claiming it did.
What crowding actually means in practice
Here is the mechanism, stated plainly. At the scale Millennium, Citadel and Point72 operate, a fund cannot run one differentiated book. It runs dozens of pods across equity, fixed income relative value, macro and credit at once, each internally levered and centrally risk managed. The largest of those platforms end up running similar factor exposures to each other, almost by construction, because they recruit from the same talent pool, finance through the same prime brokers, and get marked against the same peer set every quarter. No single fund has to be reckless for a shock to spread. Same desks, same moment.
The Fed’s own Form PF-derived analysis puts a number on the underlying condition: large hedge funds’ gross US Treasury exposure sat near $4.0tn as of September 2025, split into $2.4tn long and $1.6tn short, netting to only about 20% of the gross figure Federal Reserve: FEDS Note, “Decomposing Hedge Funds’ U.S. Treasury Exposures,” Phillip J. Monin, 22 June 2026. I would call that a footprint problem: a 20% net position hiding under an 80% gross one is not risk in the traditional sense. It is leverage that has to unwind through the same small set of financing desks the moment sentiment turns. Gross is the footprint. Net is not the risk. Financing is what breaks. Intuition: a cash futures Treasury basis trade borrows short term cash to buy Treasuries while selling futures against them, capturing a small, heavily levered spread; it works fine until financing costs or margin calls force everyone running it to unwind at once.
Does the edge survive at this scale, or is July the capacity limit showing up
Every claim about an edge, including the scale buys safety belief the flow data are pricing, has to answer whether it still works and at what size it stops. Multi-strategy’s pitch to allocators has always been that internal netting across dozens of pods creates a smoother return stream than any single strategy could on its own. For years that pitch has been broadly right, and I am not arguing it is suddenly false. Q1 2026 returned -1.4% on $24.1bn of inflows. Q2 returned +12.3% on $39.2bn of inflows Citco: 2026 Q1 Hedge Fund Report; Citco: 2026 Q2 Hedge Fund Report. Money kept arriving through both a loss and a record gain, and inflows rose 63% quarter over quarter into the record. The loss did not slow it. The gain did not explain it either. Return was not the variable. Slot scarcity was. They are pricing something closer to a franchise bet: the biggest platforms keep absorbing capital regardless of any single quarter’s result, because redeeming from a top tier multi-strategy fund means losing your allocation slot for years.
That franchise bet is what breaks the netting argument’s capacity logic, in my read. Netting only smooths returns if the pods are truly uncorrelated with each other. Once a platform’s pods draw from the same strategies and financing lines as its biggest competitors, and the FPC’s language says several already do, the netting benefit shrinks right as allocators pay the biggest size premium for it. The edge has not disappeared. It is concentrating its cost on the tier just below the top, the tier that keeps raising money on the giants’ reputation.
Here is the concession that actually damages my own case. The $500m-$1bn bracket that made money draws so little new capital that Citco’s flow table cannot break it out on its own, so I do not know how many funds sit inside it, or how much one idiosyncratic quarter could swing its average. I am reading a real signal out of a sample I cannot size. A thin bracket, one quarter. The same caution cuts against the over-$3bn bracket too: a bracket average is not a claim about any one fund inside it, and I have no per-fund July return for Citadel, Millennium or Point72. Nothing below treats “the giants held up better” as a claim about any specific name.
I have seen a version of this shape before. The swap-financed version of the Treasury basis trade unwound sharply in the April 2025 tariff shock; the cash futures version of the same underlying trade held up comparatively well through the same episode Dallas Fed: How sensitive is the Treasury cash-futures basis trade to funding condition shifts?. One trade, two speeds. The crowded one broke first. Depth mattered more than size. I am not claiming July repeats that mechanism exactly. I am pointing at the pattern: the break tends to show up first in whichever version of a crowded trade is thinnest on financing depth, not whichever is biggest in dollar terms.
The discriminator: concentration, not simply size
If sector exposure alone explained July, I expected a roughly linear relationship between AUA and return, the biggest funds suffering most because they run the most of the worst performing strategies. I did not get one. A dip, not a slope. The over-$3bn bracket, at -0.7%, held up better than the $1-3bn bracket, at -1.2%. The giants were not the worst performers. Not close, in fact. The upper middle tier was, and that detail is the whole ballgame.
One number, one reading. I read that as evidence for the crowding mechanism specifically, over a pure exposure story, for one reason. The $1-3bn bracket is exactly the size at which a fund has typically adopted the multi-strategy playbook, internally levered pods, cross asset books, aggressive financing terms, without yet having the pod count, the diversification, or the negotiating leverage with prime brokers that a $10bn-plus platform has spent a decade building. It has taken on the crowded trade set without the balance sheet depth to absorb a shared unwind as smoothly as the very largest funds can. The over-$3bn bracket’s relative outperformance against $1-3bn is not proof that scale insulates you from crowding. It is closer to evidence that scale buys a softer landing inside the same crowded trade. That is a meaningfully different claim. A less comforting one, too, if you happen to run, or allocate to, a $1-3bn multi-strategy shop.
I cannot fully separate these two explanations from Citco’s published tables alone, and I would rather admit that than paper over it. Citco does not publish a return breakdown crossed by strategy and size in the same table, so I cannot show directly that the $1-3bn bracket’s excess loss traces specifically to equity and fixed income arbitrage exposure rather than some other factor at that size tier. What I can show: the pattern matches the mechanism the Bank of England named in advance, a pure size story does not fit the shape of July’s numbers, and the strategies that fell hardest are the ones multi-strategy platforms run at the largest combined scale.
Three limits a careful reader should hold onto
Three honest caveats belong here, stated before a reader who tracks this data finds them alone. First, Citco’s performance brackets and its flow brackets aren’t the same segmentation, and Citco doesn’t reconcile them in its own release. My comparison holds at the level both tables agree on: the largest funds draw the overwhelming majority of new capital, while the mid-size bracket that actually made money draws a rounding error. Two tables, not one. Neither answers the other. I can’t state a single fund’s exact size, flow and return pairing from public data alone, and I don’t think anyone publishing on this topic currently can either.
Second, Citco is a fund administrator. It doesn’t run a universal registry, and its data cover funds that use Citco’s administration services, a large and diverse sample, but not the entire hedge fund universe, and a different administrator’s book could show a different distribution. This is a different data source than HFR’s asset growth figures, which I used in a companion piece on the second quarter’s record capital expansion Hedge Funds Just Posted Their Fastest Growth in History. The two providers measure overlapping but distinct populations. I haven’t reconciled Citco’s July return against HFR’s index for the same month; that’s a separate piece of work I haven’t done yet.
Third, one month of divergence between flows and returns is exactly that: one month. I checked the return compounding myself, and it roughly holds together. Citco’s own quarterly reports put Q1 2026 at -1.4% and Q2 2026 at +12.3%, and compounding those two figures with July’s -0.8% gives (0.986)(1.123)(0.992) = 1.098, a 9.8% year-to-date gain against Citco’s own stated 9.7% figure. Close enough that I’d call it a monthly reweighting artifact. The flow figures are a different story, and I want to flag it rather than let a clean returns check imply the flows check out too. Citco’s own Q1 ($24.1bn) plus Q2 ($39.2bn) plus July ($12bn) sums to $75.3bn, not the $86.9bn cumulative figure this piece uses throughout, and Citco’s own June update separately put H1 2026 inflows at $70.4bn, which itself does not sum from the two quarterly reports. I can’t reconcile $86.9bn from the article’s own component figures, and I don’t think a reader should have to take my word that it nets out. The likeliest explanation, based on how administrator flow data usually works, is that Citco revises its cumulative figure upward between releases as more constituent funds report on a lag, so the $86.9bn is probably a more complete, later count than the sum of the original quarterly releases, not a contradiction of them. I haven’t confirmed that mechanism from Citco directly, so I’m disclosing the gap rather than asserting the explanation as fact. The 77% and 57-cent shares in this piece both use $86.9bn as their denominator and would move if a future report restates it.
What would change my mind by August
The falsifier is specific and dated.
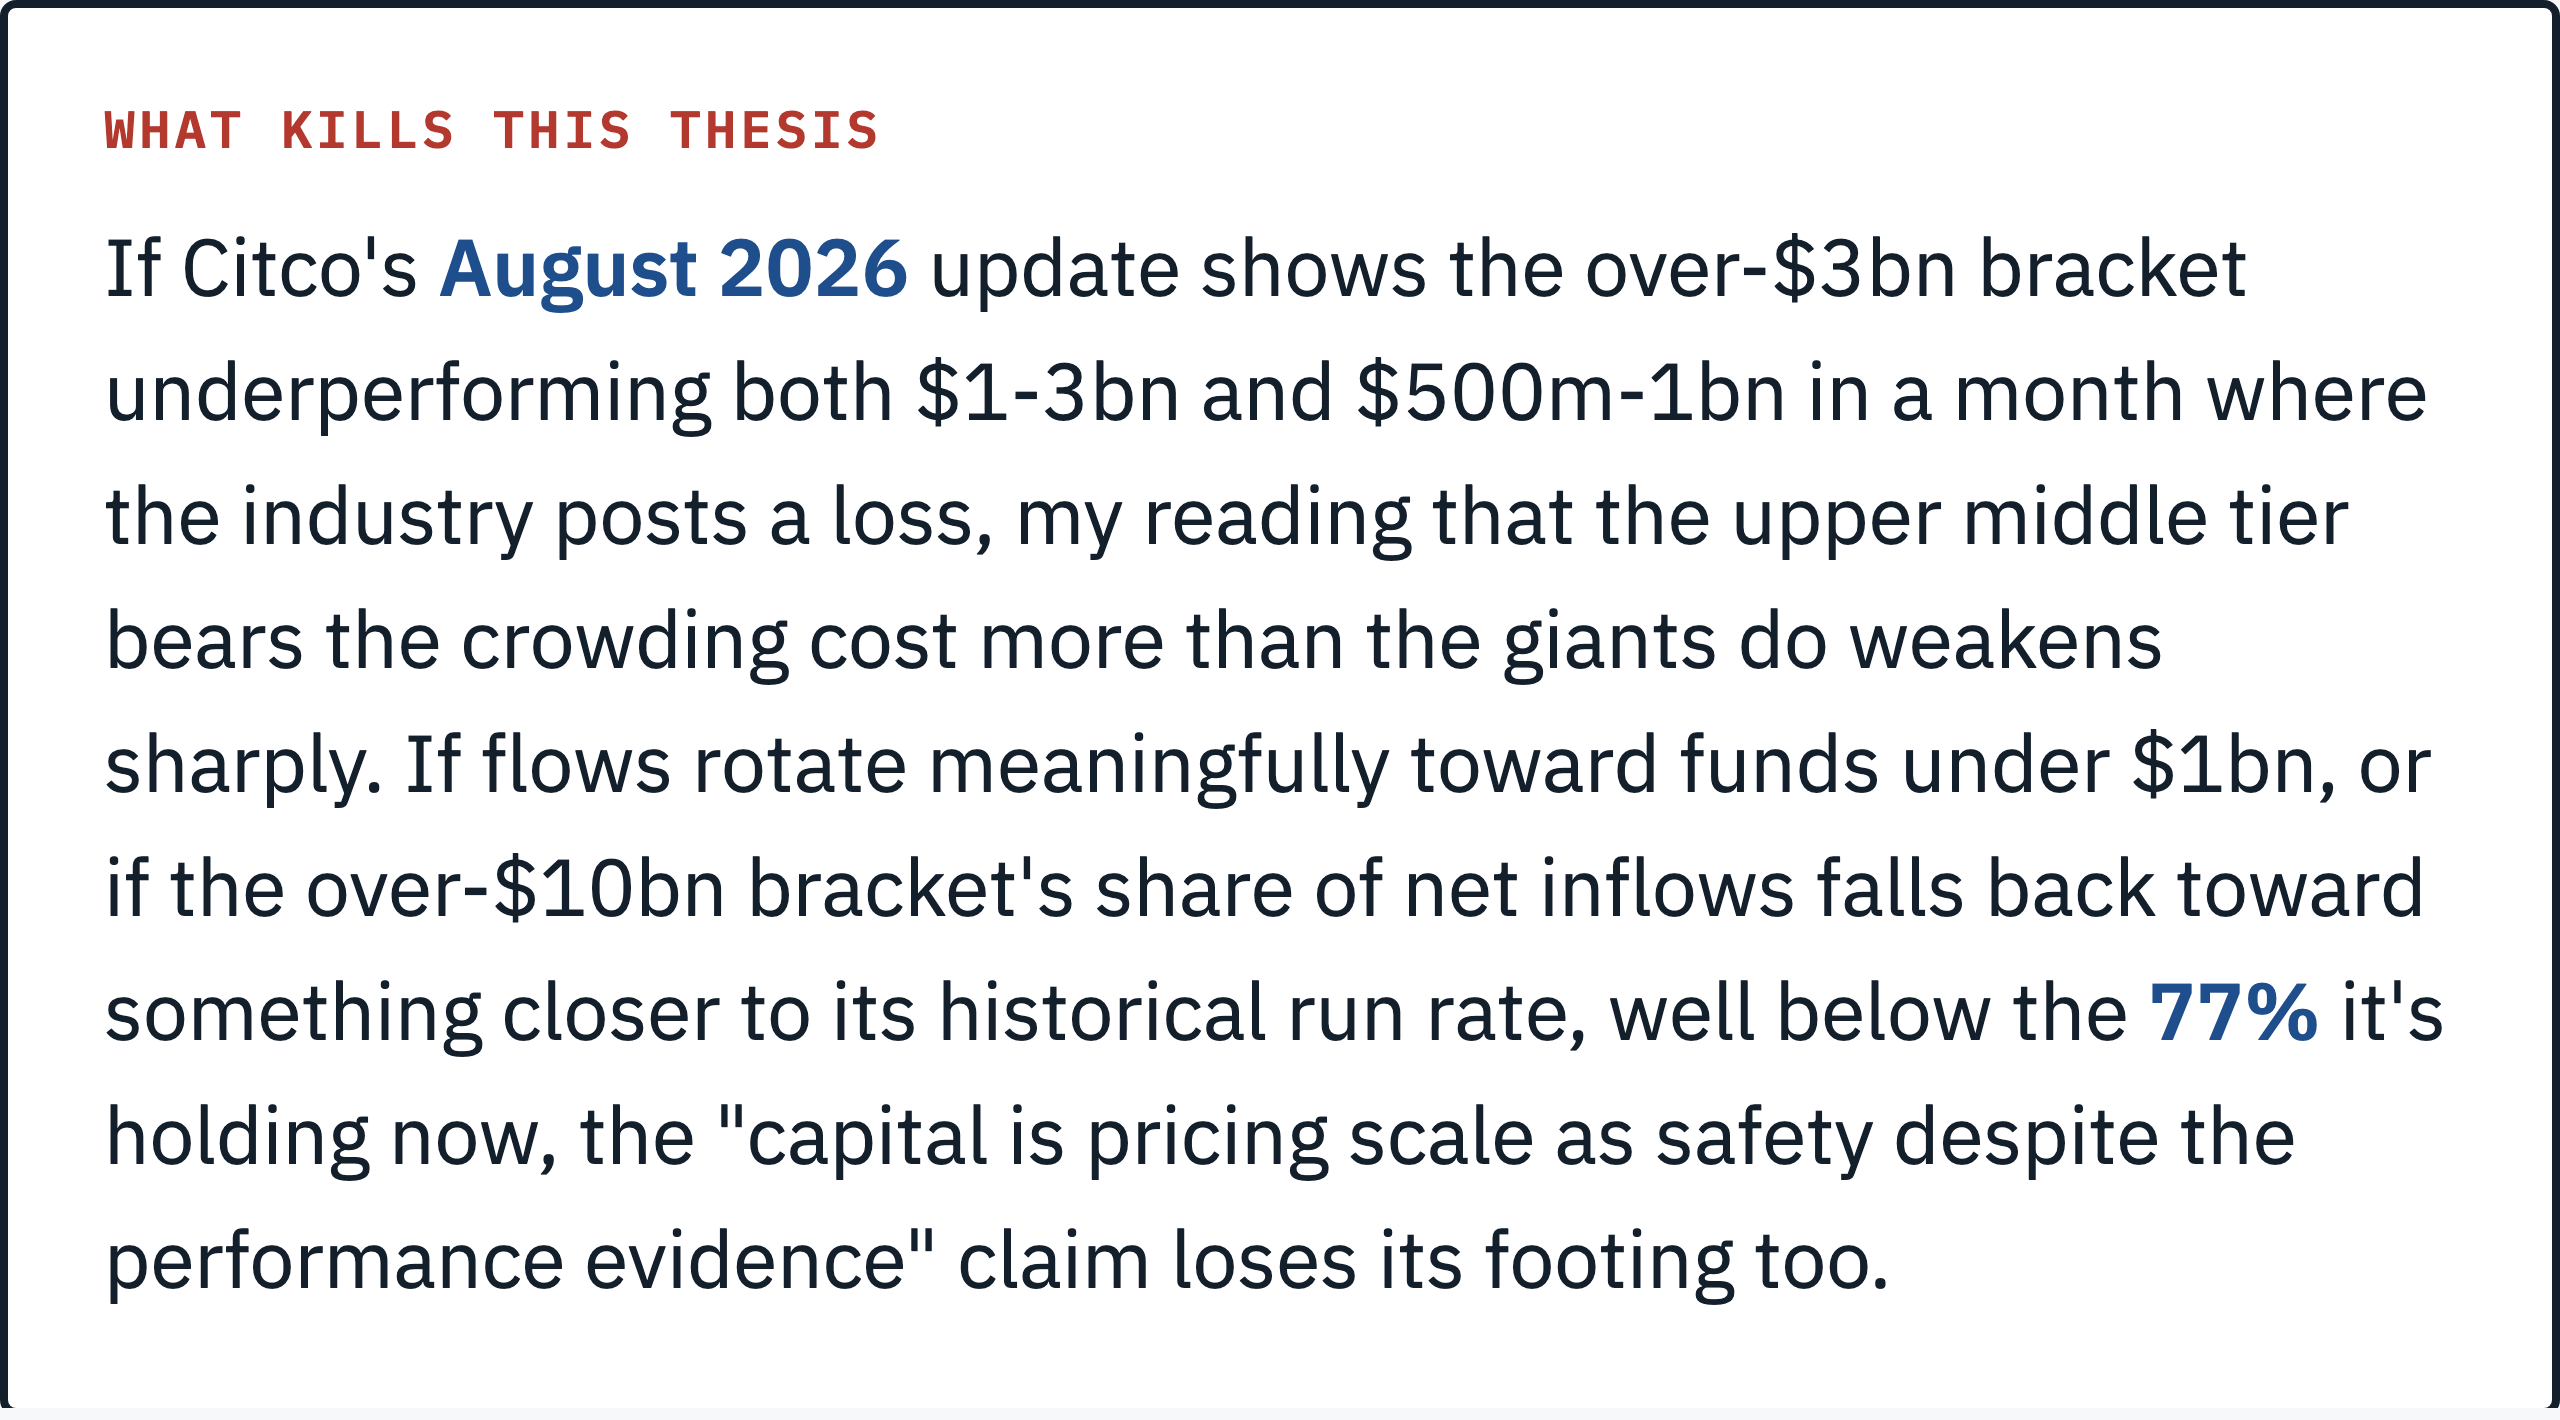
I’d also want to revisit this if a future Bank of England or Federal Reserve publication walks back the crowding language, or if Citco starts publishing a joint strategy-by-size breakdown showing the $1-3bn bracket’s underperformance traces to something other than equity and fixed income arbitrage exposure specifically. None of that has happened yet. A dated claim, not a hedge. All of it is checkable within a month or two, which is exactly why I’m dating the claim instead of hedging it.
What a PM does with this before the next allocation
For a PM sizing a new allocation into a multi-strategy platform on the strength of July’s flow data alone, I think this month argues for asking a narrower question than AUA. The question isn’t how big the fund is. It’s how much of its book sits in the same crowded equity and fixed income arbitrage trades the Bank of England named in advance, and whether its financing terms and pod diversification look closer to the over-$3bn tier’s demonstrated resilience or the $1-3bn tier’s demonstrated exposure. I’m not arguing multi-strategy’s underlying edge is gone. The structure has a real, multi-year record behind it, and one month can’t erase that. My own watch item is narrow: the $1-3bn bracket, specifically, in August. If it recovers in line with the rest of the industry, July was noise. Simple as that. I’ll say so. If it lags again while over-$10bn platforms keep drawing the lion’s share of new capital, that’s the pattern worth re-underwriting, not the strategy itself.
Which raises the narrower question I’d want answered before I made the next allocation call myself: for the size bracket capturing 77 cents of every 2026 dollar, how much of that premium is paying for genuine risk infrastructure, and how much is paying for exposure to a trade the Bank of England had already flagged as crowded?
I ran the dollar arithmetic on what the $1-3bn bracket’s gap actually costs a real allocation, and I’m tracking the one number that would prove or kill this read into Citco’s August release, in a companion note: The Bank of England Flagged This Crowding in June. Citco’s July Data Show the $1-3bn Multi Strategy Tier Paid for It.
For related coverage of the same platforms’ balance sheets, I wrote about the second quarter’s record capital expansion here: Hedge Funds Just Posted Their Fastest Growth in History.
I post the full research video series on YouTube: The Mathematical Trader. Connect on LinkedIn.
📊 The Decision-Grade Version
This piece is complete on its own. The thesis, the evidence, and what would kill the view are all above, and nothing was held back to sell you a next step.
The Patreon note is a separate piece of work rather than a deeper cut of this article. It takes one read from inside this story, the size-tier allocation question the flow data is currently mispricing, and works the arithmetic a PM would actually run: the dollar cost of the gap at real allocation sizes, and the one number that would prove or kill the read before Citco’s August release. Written for people who put capital behind a view.
→ Read the size-tier crowding note
→ Or join the Patreon community for every note
Cover photograph: Michael, public domain, via Wikimedia Commons.