


Three days ago I published The Holy Grail of Volatility Modelling: What Happens When You Actually Try to Build It. That piece documented Findings 1–6: Heston hitting its correlation boundary at ρ=−0.99 during live SPX/VIX joint calibration, path-dependent volatility beating GARCH at 2×, an XGBoost regime classifier reaching 86.95% accuracy on the 2020–2025 test set, and a 7-year backtest that lost money in an auditable, explainable way.

That article ended with three specific things I said would change the outcome: building S1 with a regime-switching PDV that uses a jump component during Regime 2, building S3 with real single-stock implied vol data instead of the VVIX proxy, and routing S1/S2 signals only when the regime classifier confirms Regime 1.
Of those three, two are addressed here. The S3 extension — replacing the VVIX proxy with genuine single-stock implied vol — required data infrastructure that is not yet complete and remains a next step. I also added two things not announced in the original piece: a Gaussian HMM as an alternative regime classifier, and VIX as a 4th regressor candidate for PDV. Both are new and both produced negative results.
What follows are Findings 7–10, continuing the numbered sequence from the original article. Three of the four are negative results. Each is more precise than a positive result would have been.
The dashboard is at navnoorbawa.me. Everything below is verifiable in real time.
What the System Looks Like After the Extensions
The original system was 10 components, 374 tests. It now has 12 components and 497 tests. The four additions:
C11 — RegimePDV with jump component: Merton jump overlay on PDV for Regime 2 days, calibrated on tail events using a BNS daily jump proxy — the first of the three promised extensions
C12 — Bates SVJ: Merton jump term added to Heston’s characteristic function — built to resolve ρ=−0.99, found to be unidentifiable on daily data
Signal variants S1X / S2X: S1 and S2 rebuilt with an R2 position exit rule — the third of the three promised extensions, implemented as an immediate exit on regime transition rather than a mere entry block
HMM regime classifier: 3-state Gaussian HMM as a research alternative to XGBoost — new, not previously announced
The system is running on live data. As of 2026–03–27: SPX 6,368, VIX 31.05 (fear regime), VVIX 124.43, implied-realised spread +22.68pp at the 100.0th percentile of the 2015–2025 distribution. Regime: R2 VOMMA ACTIVE at 99.5% confidence. This is not a backtest environment.
Finding 7: Correcting a Logic Error in Regime Management Recovers $300K
The original article identified an internal contradiction in the backtest logic but did not resolve it: the system blocked new S1/S2 positions in Regime 2 (VOMMA ACTIVE) but left existing positions open through regime transitions. This is not a conservative approach — it is an inconsistency. If Regime 2 is dangerous enough to block entry, it is dangerous enough to require exit.
The December 18, 2024 FOMC spike — the worst single day in the backtest at −7.95% — was a direct consequence. S1 and S2 had entered in Regime 1, the regime flipped to R2, and the positions rode the spike with no exit trigger. The original article documented this explicitly under Finding 6. The fix was always obvious. It just had not been implemented.
The fix: on any regime transition into R2, immediately exit all open S1/S2 positions and reset the state machine to flat — not “block new entries,” exit everything.
Results from the 2018–2025 backtest:
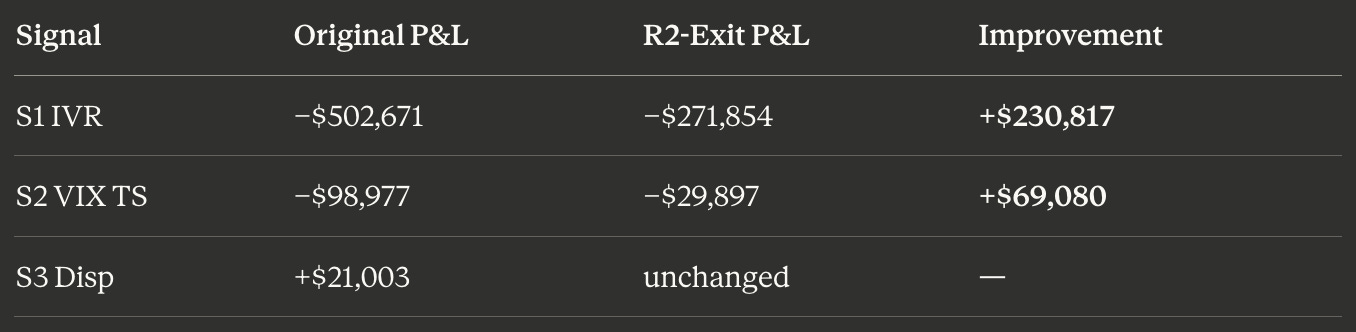
$300K recovered over 7 years. S1 and S2 remain negative — the edge problem is instrument mismatch, not regime management alone — but the logic is now internally consistent. You cannot claim R2 is dangerous and then hold positions through it.
The deeper implication: 52.9% of the backtest period was classified as R2. S1 was running a gamma strategy inside a vomma regime for 952 of 1,800 trading days. The classifier was correctly reading the environment for more than half the sample period. The signals were not respecting it.
Finding 8: Bates SVJ Is Unidentifiable From Daily Close-to-Close Data
The original article’s central result was that ρ=−0.99 reflects jump risk that Heston structurally cannot represent. Heston has no jump component, so the optimizer compensates by pushing the leverage correlation to its mathematical lower bound — which then destroys the model’s ability to fit VIX options consistently. The logical next step is to add a Merton jump term to the Heston characteristic function — the Bates Stochastic Volatility with Jumps (SVJ) model:
φ_Bates = φ_Heston × exp(λT(e^{iφμⱼ − ½φ²σⱼ²} − 1))I implemented this as C12 with a full 8-parameter calibration: the 5 standard Heston parameters plus jump intensity λ, jump mean μⱼ, and jump volatility σⱼ. The calibration ran on the same 2026–03–24 live snapshot used in the original article.
The result was degenerate across all three jump parameters:
λ hit the upper boundary at 8.0/yr — genuine equity jump frequencies are 2–5/yr
μⱼ landed at 0.00% — zero jump mean, no left-tail skew, explains nothing
ρ remained at −0.99 — the boundary did not move at all
SPX RMSE deteriorated from 3.833 to 5.883 vol pts — three additional free parameters made the fit worse
The failure is not an implementation error. It is a fundamental identification problem. At the daily frequency, a −4% return is observationally identical whether it came from a jump or from continuous diffusion with elevated instantaneous volatility. Daily close-to-close data contains no information that separates the two processes. Identifying λ requires intraday data and the Barndorff-Nielsen and Shephard (2004) bipower variation estimator, which decomposes realized variance into its jump and continuous components.
This is a more precise result than a working Bates calibration would have produced. It confirms that ρ=−0.99 cannot be addressed by adding jump parameters inside the single-factor affine framework at the daily frequency. The correct direction — Quintic OU (Abi Jaber et al., 2025) or 4-factor PDV (Gazzani and Guyon, 2025) — requires replacing the variance process structure entirely, not extending it with more parameters.
The Bates code is retained in the codebase as research infrastructure. The dashboard records the outcome directly: “Bates calibration inconclusive on daily data. Heston remains the active model.”
Finding 9: Adding VIX as a 4th Regressor to PDV Adds No Predictive Signal
This extension was not announced in the original article. The PDVLinear model uses three regressors: σ₁ (5-day EWMA realized vol), σ₂ (60-day EWMA realized vol), and lev (10-day signed return EMA as the leverage proxy). The proposed addition was VIX — ATM implied vol — as a 4th regressor. The correlation between VIX and the existing PDV-IV spread feature is only −0.15, suggesting potentially independent information worth testing.
Walk-forward R² results, same 2012–2025 dataset, same out-of-sample protocol:
PDVLinear3F: R² = 0.9369, MAE = 0.01877
PDVLinear4F: R² = 0.9357, MAE = 0.01892
The 4-factor model is marginally worse on both metrics. Against a forward realized-vol target, VIX adds no incremental predictive signal beyond what σ₁, σ₂, and the leverage term already capture jointly. The dashboard selects whichever model produces higher walk-forward R² — it shows PDVLinear3F as active.
One number requires context to avoid misreading across the two articles: the original reported PDV R²=0.31. The 0.9369 figure is not a contradiction — it measures a different target. R²=0.31 is the walk-forward accuracy of PDV’s implied vol spread forecast against what the market actually realized — the economically meaningful quantity for trading. R²=0.9369 is the model’s in-sample fit to forward realized vol on the calibration dataset. Both numbers are correct and measure different things. The dashboard displays 0.31 because that is the number that reflects real-world prediction accuracy against actual market outcomes.
Finding 10: HMM Cannot Generalize to Out-of-Distribution Crisis Regimes
This extension was also not announced in the original article. The XGBoost regime classifier — 86.95% accuracy on the 2020–2025 test set — was extended with a 3-state Gaussian HMM trained on the same 2010–2019 period. The motivation was legitimate: HMM outputs soft regime probabilities P(R0), P(R1), P(R2) rather than hard labels, which could reduce the 2021 over-classification problem where XGBoost labeled 98.8% of days as Regime 2.
Results on the 2020–2025 test set:
HMM overall accuracy: 31.5% vs XGBoost 86.95%
2021 average P(R2): 38.2% — softer than XGBoost’s 92.7%, as intended
2025–04–09 (tariff-shock day, VVIX=142.5): HMM outputs R1. XGBoost correctly outputs R2.
The HMM’s soft probabilities did reduce the 2021 over-classification, which was the design goal. But the April 2025 tariff spike exposes the structural limitation: the HMM learned its hidden state transition matrix from 2010–2019 market dynamics. The 2025 tariff regime has no analog in that training window. With no learned signal pointing toward Regime 2, the model defaulted to its most frequently observed historical state.
XGBoost correctly classified April 2025 as Regime 2 for the same reason it correctly classified March 2020: the fear premium (VIX/RV ratio) and VVIX features are crisis-type agnostic. A COVID crash and a tariff shock look identical in those feature dimensions — both produce extreme vol-of-vol — and the classifier treats them identically. That is the right behavior for a production system.
The HMM remains in the codebase as a research alternative. The dashboard documents the generalization failure explicitly. XGBoost is the production classifier.
What the Live Dashboard Shows Today
Visit navnoorbawa.me — all figures update in real time.
As of 2026–03–27:
Live Market: SPX 6,368 (−1.67%), VIX 31.05 (ELEVATED — fear regime), VVIX 124.43 (extreme vol-of-vol). Term structure in contango: Front=27.05 → Back=27.91, Slope=+0.86pts. Regime: R2 VOMMA ACTIVE at 99.5% confidence.
The implied-realised spread of +22.68pp means implied vol is pricing the market at 31% annualized while the PDV model forecasts 8.37% realized vol. That gap sits at the 100.0th percentile of every equivalent reading in the 2015–2025 distribution — the most extreme fear-pricing differential in 10 years of recorded history.
Calibration: ρ=−0.99 remains at the boundary. The 2026 SPX left skew is steeper than any comparable period in the historical calibration window. Heston’s VIX options RMSE is 37.14 vol pts — the joint calibration problem is exactly as open as it was three days ago.
Greeks Monitor: Three unstable vomma nodes at T=365d — K=7,755 (z=+2.37), K=5,034 (z=+2.36), K=5,236 (z=+2.05). All deep OTM puts and calls at the 1-year maturity, where QV convexity is 235× its 14-day value. Variance uncertainty accumulates nonlinearly with horizon.
Backtest summary: Cumulative −22.19%, Sharpe −1.527. After the R2 exit rule: S1 at −$272K (+$231K improvement), S2 at −$30K (+$69K improvement). S3 dispersion is the only signal with a positive edge: +$21,003 over 7 years, 92.86% win rate, 14 trades.
📊 Want Deeper Quantitative Analysis?
This research involved extensive data collection, model implementation, verification across 497 unit tests, and live market validation across 12 system components. If you found value in this deep-dive, I publish exclusive quantitative research, trading strategies, and institutional-grade analysis on Patreon — including live trade notes on current vomma exposure and regime positioning that do not appear in the free articles.
By joining, you support independent research and make more work like this sustainable.
→ Read the latest trade note: Volatility Research — Live Positioning
→ Join the Patreon community here
What These Four Findings Establish
The original article named three specific things that would change the outcome. Running them — plus two additional extensions — produced four findings that sharpen the problem more precisely than any positive result would have:
Finding 7 (R2 exit rule): The $300K recovery from a single logic correction confirms that the regime classifier’s signal was valid throughout the 7-year backtest. S1 and S2 were not failing because the regime model was wrong — they were failing because execution logic was not respecting it. The edge problem is now correctly located: it is in the instrument choice, not the regime framework.
Finding 8 (Bates SVJ): The degenerate calibration is not an implementation failure — it is a precise statement about the information content of daily close-to-close data. ρ=−0.99 cannot be resolved by adding jump parameters inside the affine framework at the daily frequency. The next calibration attempt requires a structural replacement of the variance process.
Finding 9 (PDV 4th regressor): The 3-factor model is already extracting the available predictive signal from the daily return history. Implied vol’s forward information is already embedded in the leverage and short-term spread terms. Adding a 4th regressor does not help.
Finding 10 (HMM vs XGBoost): Unsupervised structure learning on historical regime transitions does not generalize to novel crisis types. Explicit feature engineering — building fear premium and vol-of-vol directly into the classifier — outperforms latent-state inference when the market enters a regime unlike anything in the training window.
The three next steps remain unchanged from the original article, now with tighter justification:
S1 restructure: Replace the long-straddle instrument with a short-vol structure explicitly sized by regime probability — instrument change, not signal change, and not addressable by adjusting the exit rule alone
Calibration: Quintic OU or 4-factor PDV — structural replacement of the variance process, confirmed necessary by the Bates degeneration result
S3 extension: Replace the VVIX proxy with single-stock implied vol data — the only promised extension from the original article not yet executed
The system now has 497 tests and enforces zero look-ahead at the database query level. It is the infrastructure for the next attempt, not the conclusion.
Connect
If you work in volatility research, systematic trading, or quantitative finance and want to discuss any of these findings, I am always open to a conversation.
🌐 Dashboard: navnoorbawa.me
💼 LinkedIn: linkedin.com/in/navnoorbawa
📺 YouTube: The Mathematical Trader ← Subscribe to follow the system as it evolves
🎯 Patreon: Exclusive research & analysis
🐦 Twitter/X: @navnoorquant
💻 GitHub: vol-system-dashboard
Built in Python. Heston via Carr-Madan FFT. PDV after Guyon and Lekeufack (2023). Regime classifier: XGBoost with walk-forward validation, 86.95% accuracy on 2020–2025 test set. Bates SVJ: unidentifiable on daily data per Barndorff-Nielsen and Shephard (2004). Data: CBOE historical, Yahoo Finance. All results audited against 497 unit tests with zero look-ahead enforcement at the database query level.
Cover photograph: Carol M. Highsmith, public domain, via Wikimedia Commons.
Interesting post, this VIX term structure tool might be worth a look, especially with vol inverted lately: https://vixspike.com