


Nearly half the retail options Citadel Securities fills now expire the same day, on its own review dated 30 June 2026. In the S&P 500, the exchange’s own records show that flow mostly netting and the dealer’s hedge staying small. The growth is now in single stocks, where nobody has shown the same.
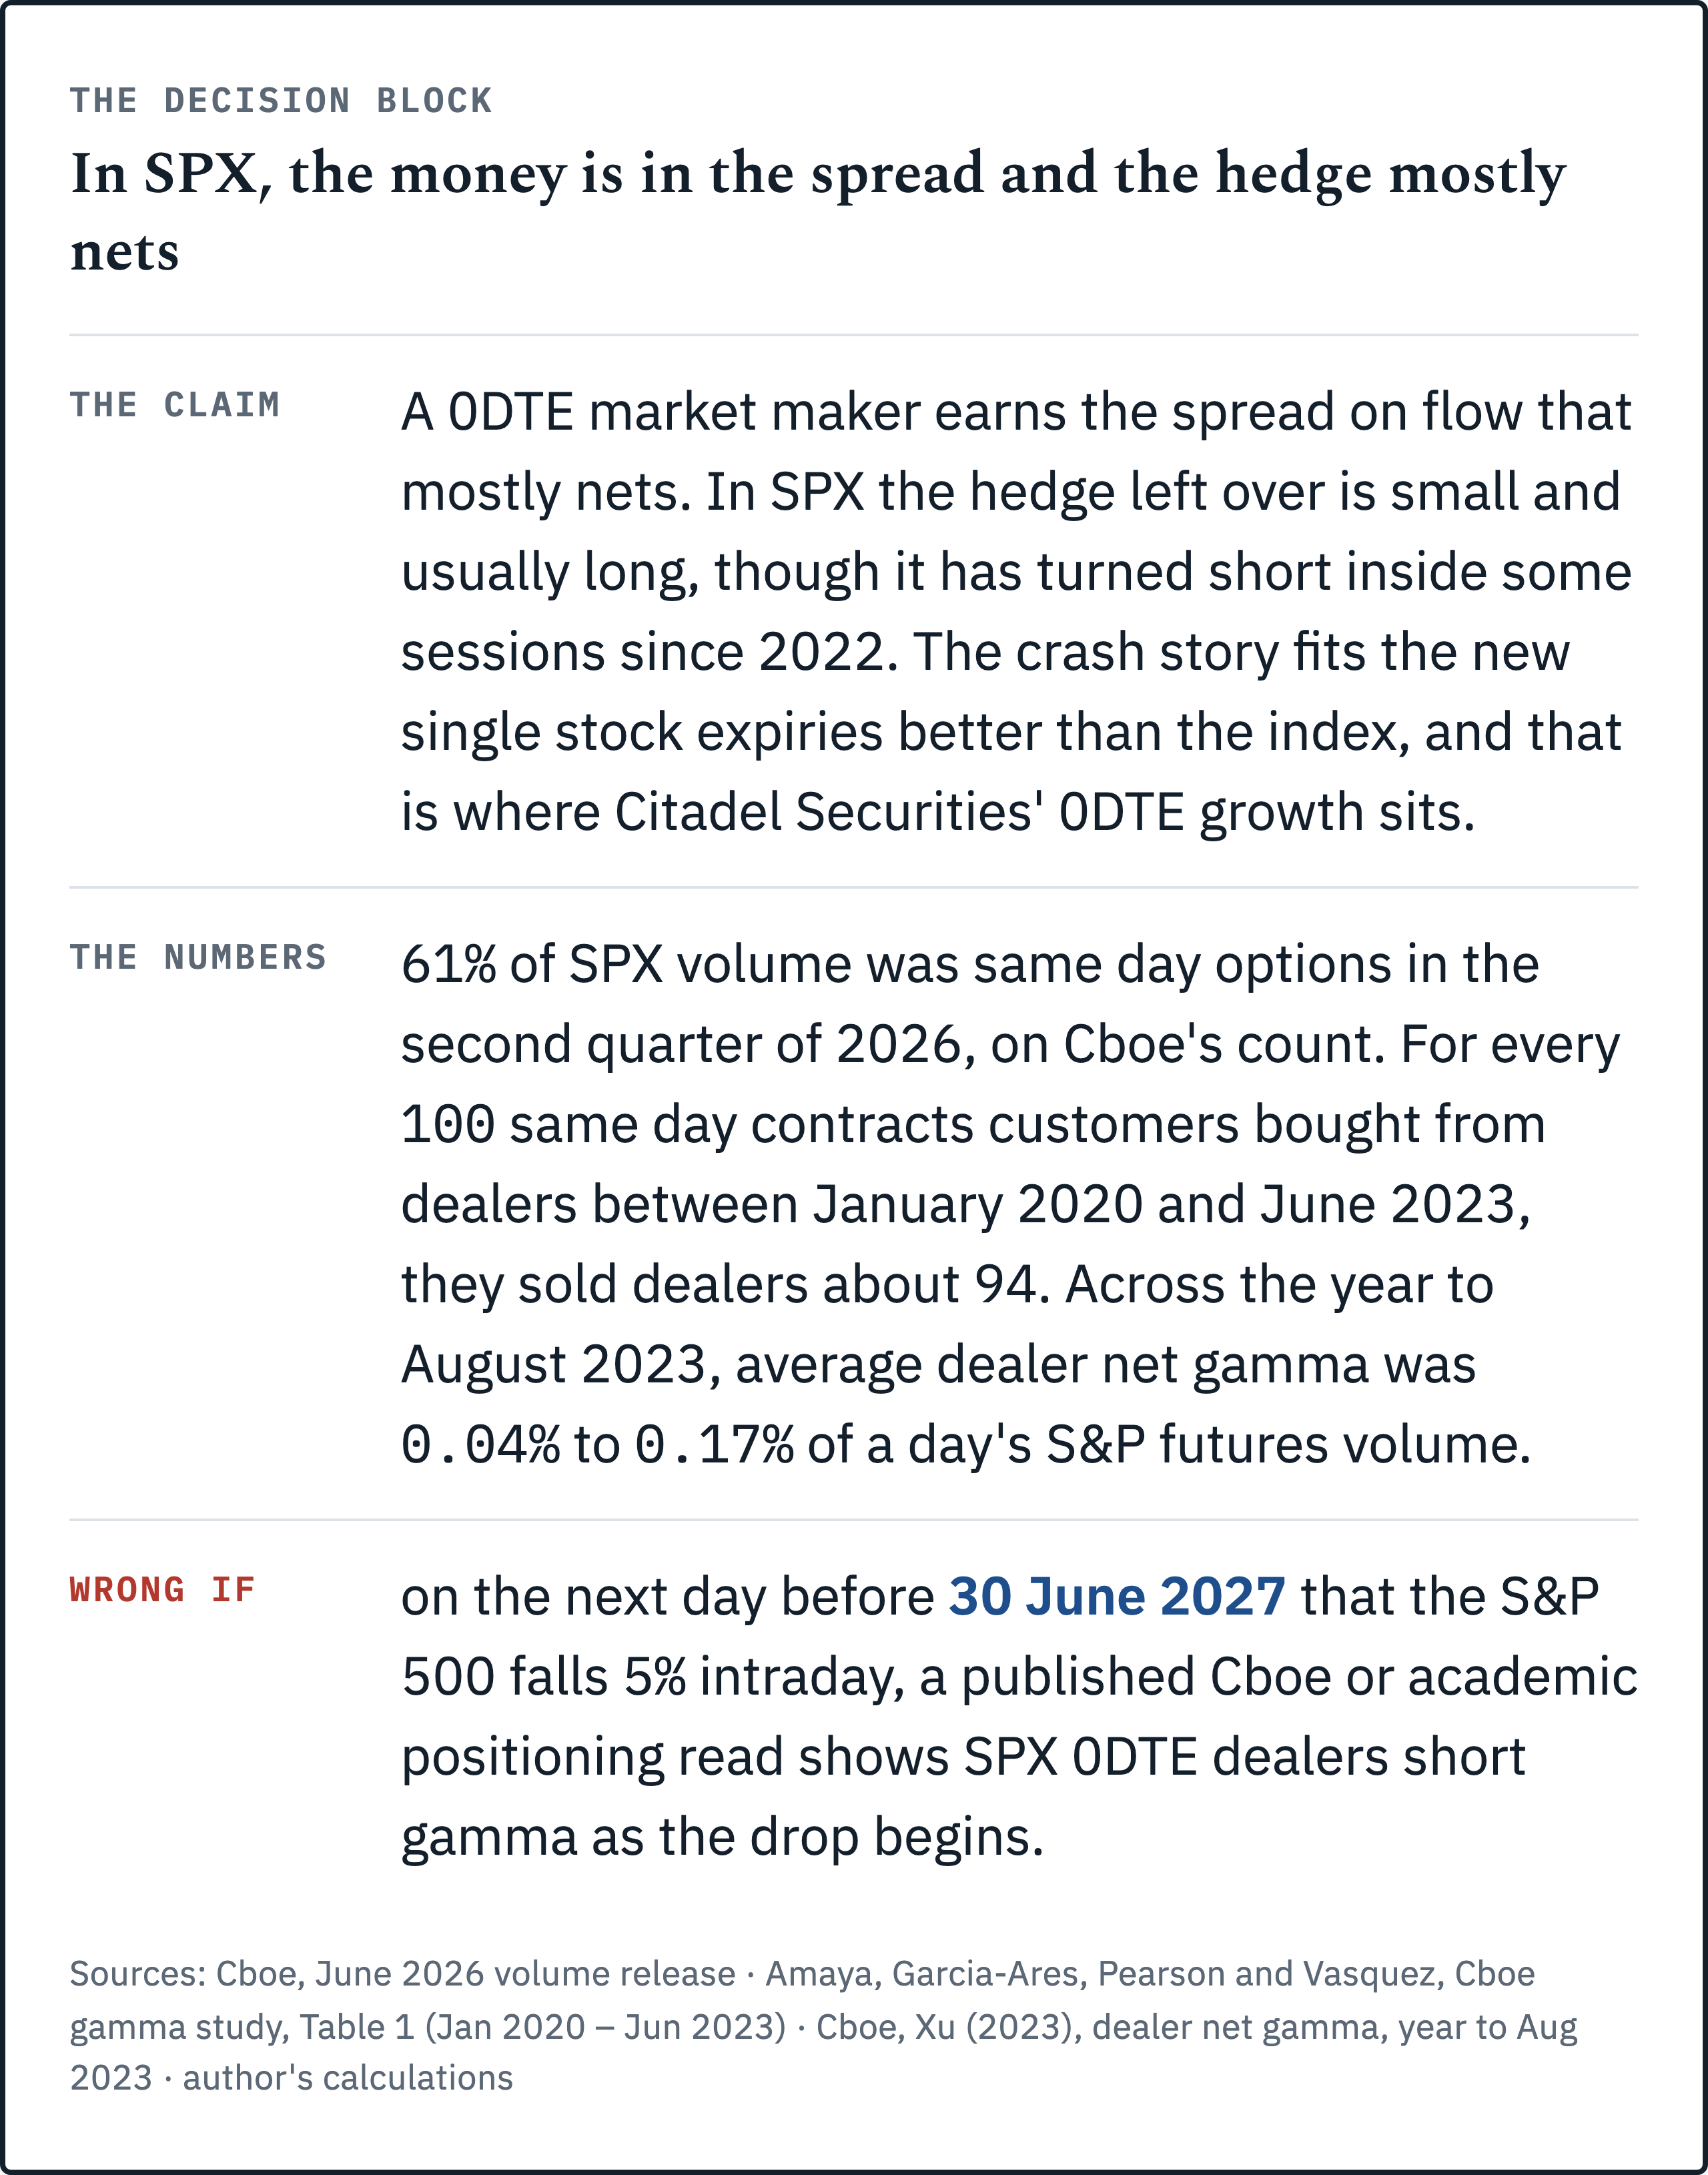
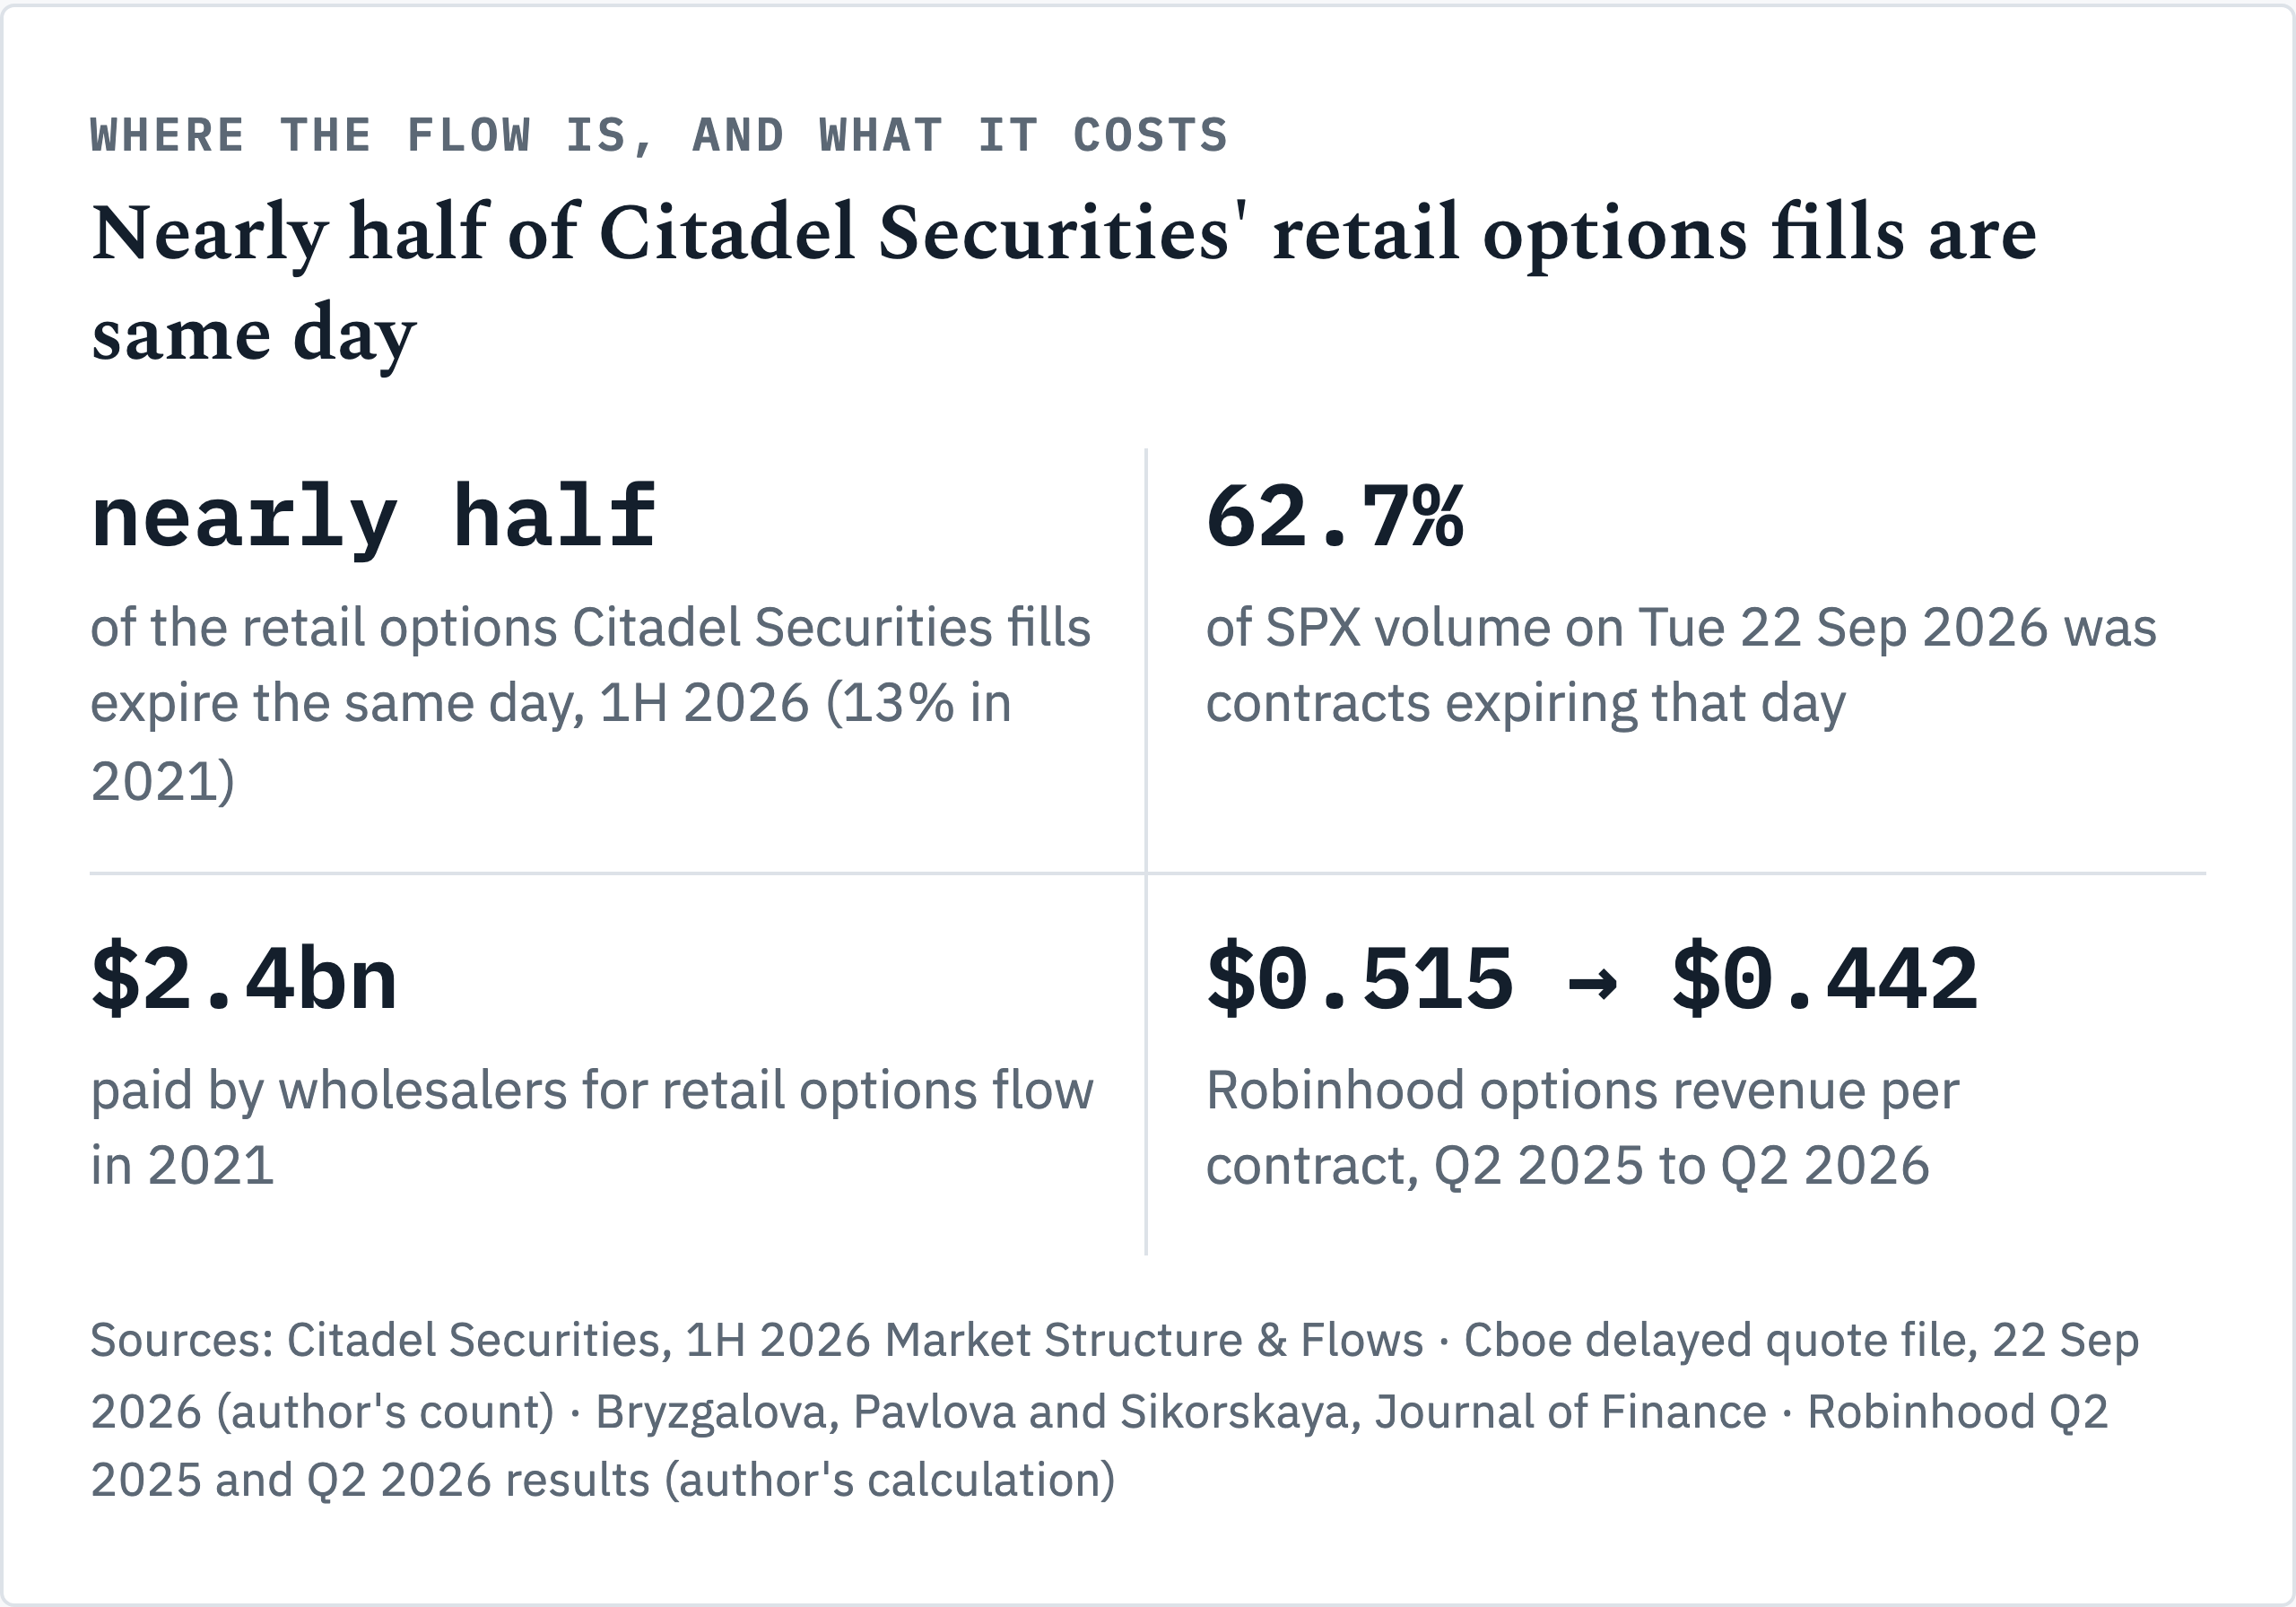
On its own figures, Citadel Securities executes approximately 35% of all retail volume in US listed securities. Its first half market structure review, dated 30 June 2026, says nearly half of the retail options it fills now expire the same day, up from 13% in 2021, following the single stock Monday and Wednesday expirations launched this year. The popular story says that business is a bomb. I went through Cboe’s positioning work, the academic papers built on its records, an SEC staff study and two companies’ filings. No public data shows Citadel Securities’ own positions, so every positioning figure below covers the whole market. In the index, the money is in the spread and the hedge mostly nets. The growth isn’t in the index.
JPMorgan’s 25% rout scenario, at its strongest
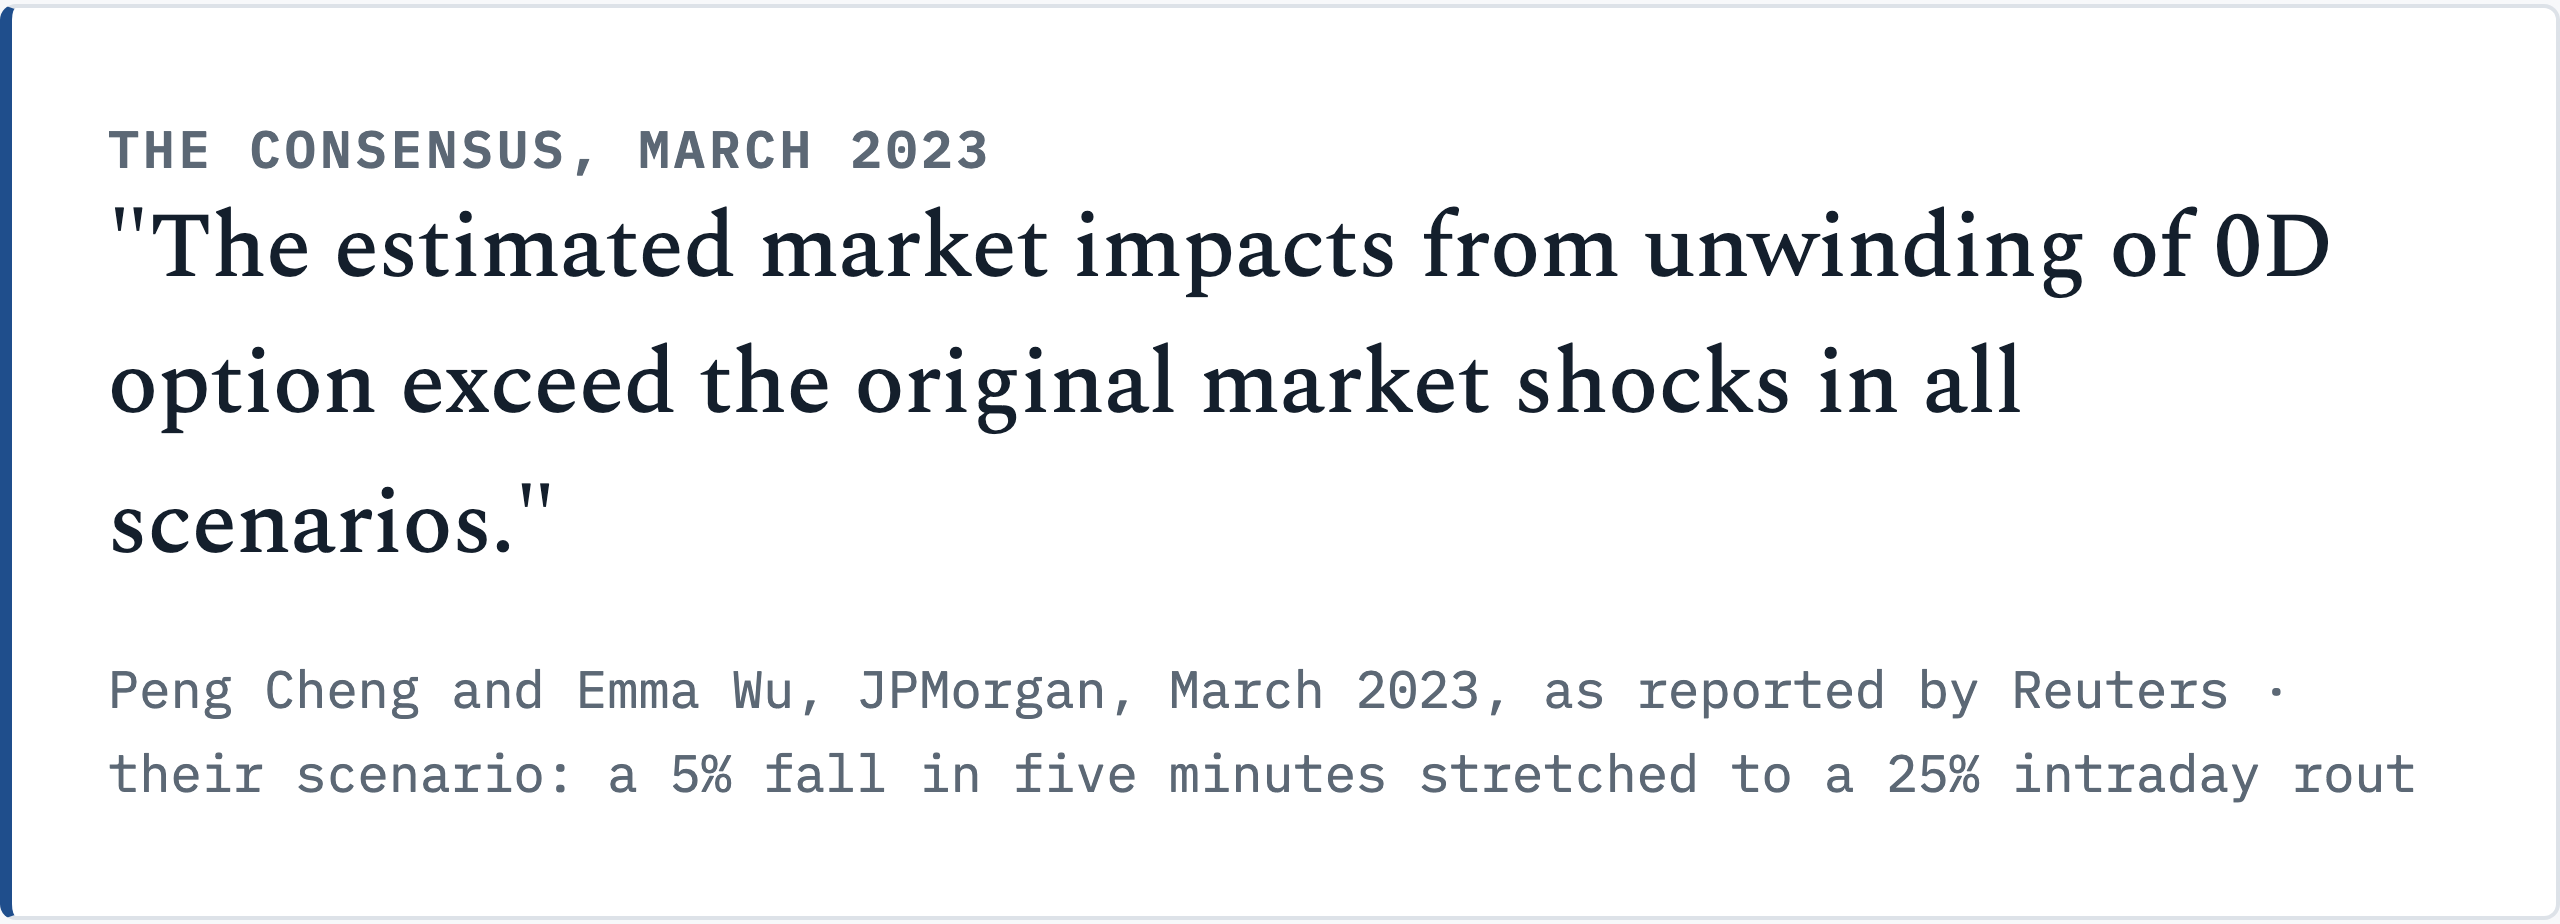
In March 2023, JPMorgan analysts Peng Cheng and Emma Wu estimated that if the S&P 500 fell 5% in five minutes, $30.5 billion of 0DTE related trading could add another 20 percentage points to the decline, a 25% intraday rout, in a note reported by Reuters. Their line was blunt: “The estimated market impacts from unwinding of 0D option exceed the original market shocks in all scenarios.”
That is the consensus, and I want it in its strongest form, because the mechanics are sound. A same day option at the money carries enormous gamma. A dealer net short those options has to buy futures as the index rises and sell as it falls, so the hedge trades with the move. Large enough, the hedge becomes the move. Nobody serious disputes the direction of that arithmetic. I don’t either.
The view has not gone away. Citadel Securities’ own review says “options, leveraged ETFs, and systematic strategies are increasingly amplifying moves in the underlying market.” Bloomberg reported record trading revenue of $7.3 billion for the second quarter, more than triple a year earlier, crediting heightened market volatility. That figure covers the whole firm, with no options line.
It’s still a fair question to put to anyone calling this a quiet utility. My answer is volume. The same review reports a record ~$6.8 billion of retail options premium a day on its platform in June, and a spread business earns more when that surges and quotes widen. A gamma bet would show up as losses on one way days, and on the SPX days examined below, dealers weren’t on the wrong side as the move started.
What the crash scenario needs is size and sign, meaning dealers net short in amounts that matter against a futures market that trades hundreds of billions a day. Both are empirical questions. For SPX, both now have answers in exchange data.
Same day options: 61% of SPX, nearly half of Citadel Securities’ retail fills
Same day contracts made up 61% of SPX volume in the second quarter, by my count from Cboe’s June 2026 volume release: a record 3.1 million SPX 0DTE contracts a day, out of a record 5.1 million SPX contracts a day. I also pulled Cboe’s delayed quote file for SPX before the open on 23 September: on Tuesday 22 September, 2,861,688 contracts expiring that day traded, against 4,567,527 across every SPX expiry. I make that 62.7%. Three contracts in five now expire before dinner.
The regulator sees the same shift across all listed options. The SEC’s staff study for its April 2026 options roundtable puts expiration day trading at 28% of all options volume by 2025. In December 2025, it finds, individual customers were 73.5% of expiration day trading outside market makers, against 54.3% on other days. Henry Schwartz’s Q2 2026 industry review adds that short dated Monday and Wednesday expirations in nine names, Tesla, Nvidia and Apple among them, “now approach 6 million contracts a day in combined volume.”
Scott Rubner’s review calls Citadel Securities “the #1 retail market maker in the US.” Its same day share was 30% in 2025, so most of the jump came this year. Average time to expiry on its platform is under three days.
My read is that the firm describes a retail book that has collapsed toward the shortest contract listed, with the latest leg in single stocks. The flow is the product. Whether that flow earns a spread or carries a risk depends on how well it nets, and that answer differs by product.
Where the money comes from: four steps from order to spread
The money is what remains of the customer’s price after the payment for flow and the cost of the hedge. It is earned in four steps, and I set them out before any number.
A retail customer sends an options order to a broker, commission free.
The broker routes it to a wholesaler, which pays for the flow.
The wholesaler brings the order to an exchange auction and fills it inside the screen’s quote.
The wholesaler keeps the price the customer paid, less the payment for flow, less what it costs to hedge or offset the position.
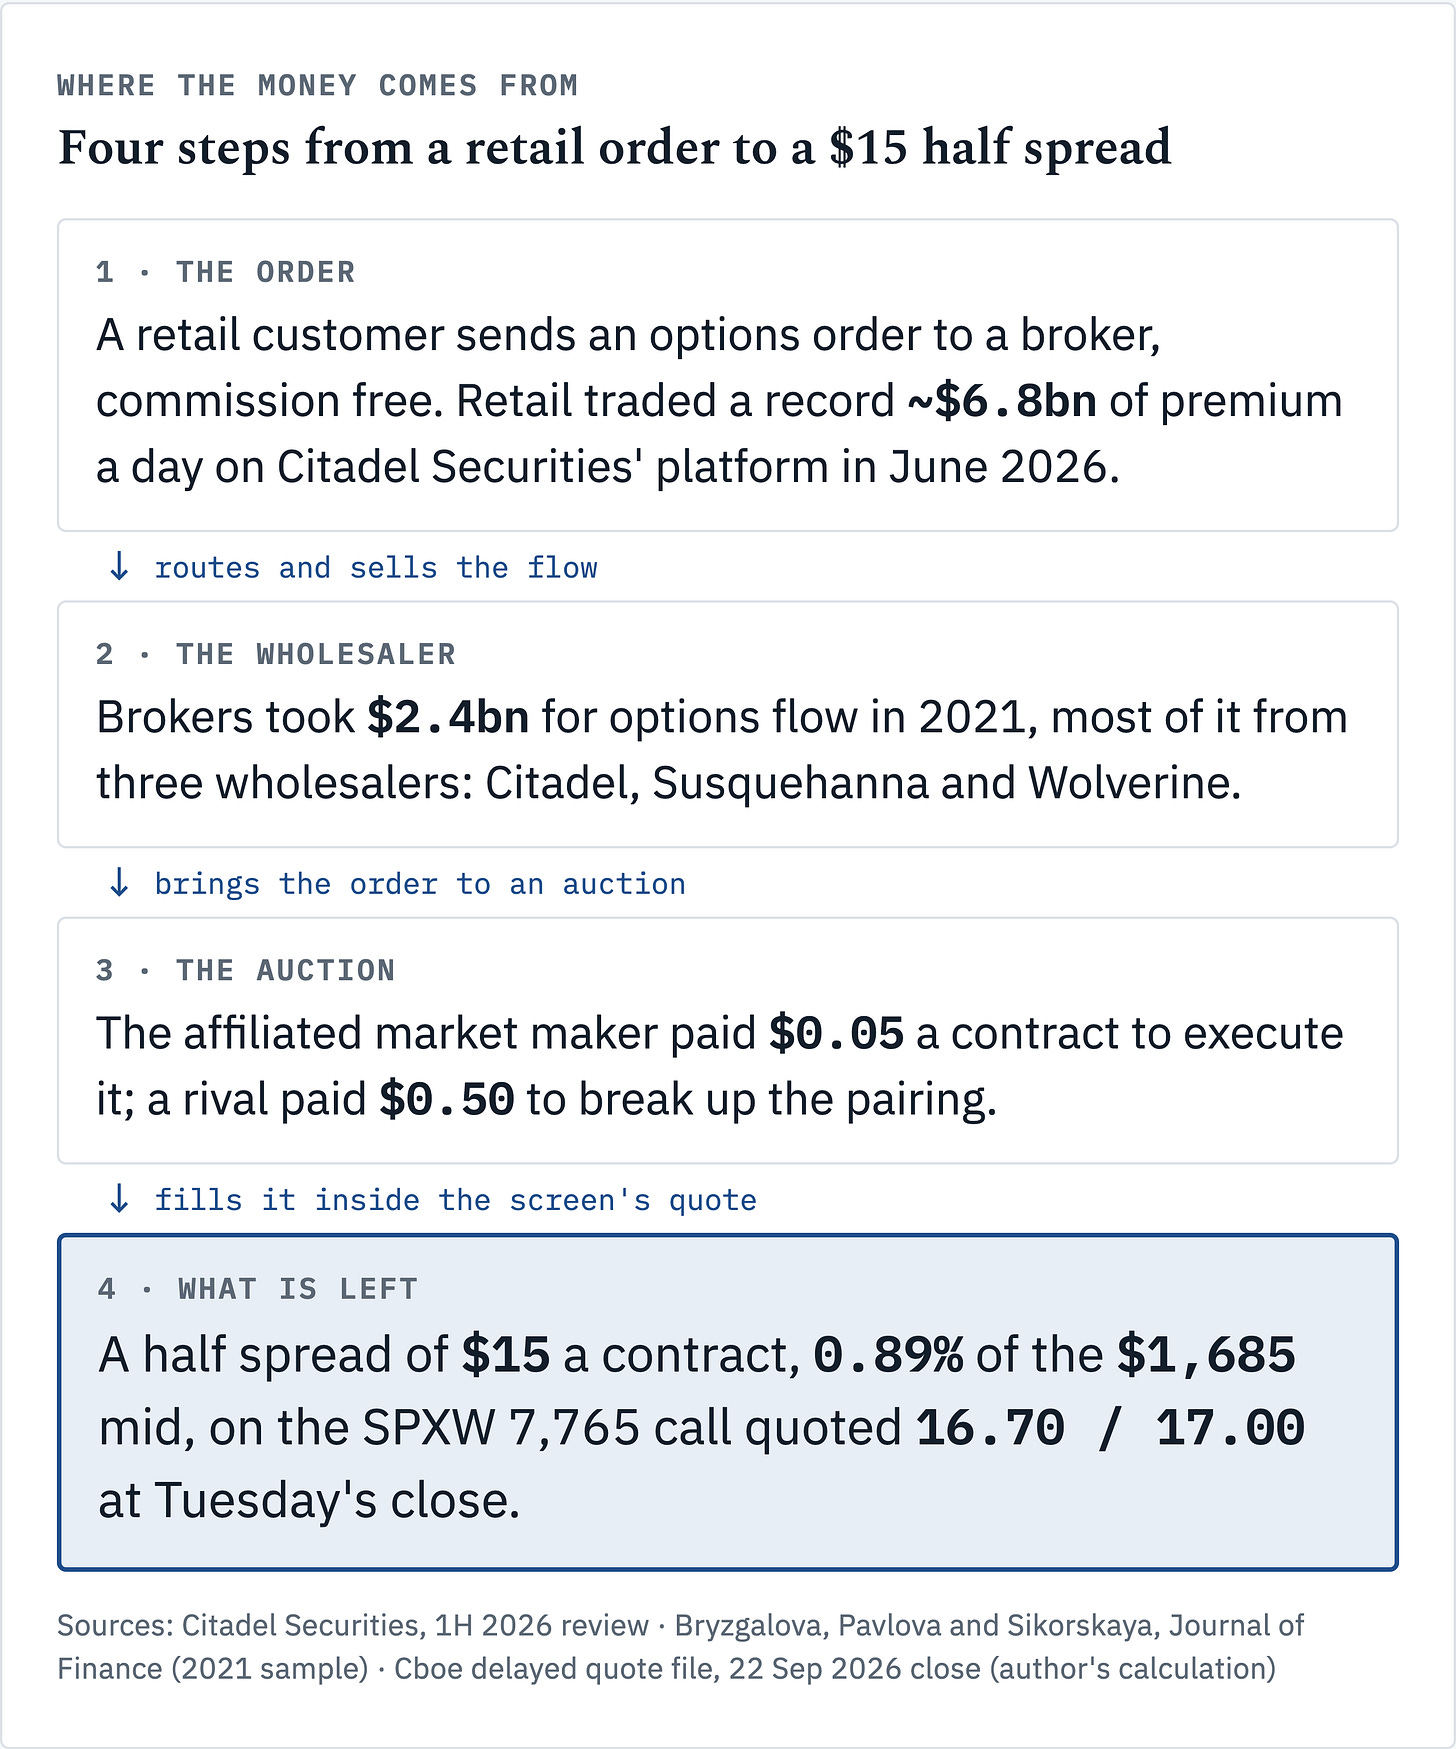
Step two is where Citadel’s name comes from. The SEC staff study calls payment for order flow “a dominant economic driver in retail options execution,” with options now two thirds of all payment for flow and the top three providers at as much as 90%. Svetlana Bryzgalova, Anna Pavlova and Taisiya Sikorskaya’s Journal of Finance study of retail options named them for 2021. In their words, “the lion’s share of PFOF for options came from only three wholesalers: Citadel, Susquehanna, and Wolverine.” Brokers took $2.4 billion for options flow that year and $1.3 billion for stocks.
Step three had a built in edge in their sample. On most exchanges, a market maker affiliated with the wholesaler paid $0.05 a contract to execute the order it brought in, while a rival paid $0.50 to break up the pairing. When a rival did, the wholesaler still collected a net rebate of $0.30 simply for bringing the order. Three firms took the flow.
Step four is the one retail pays for. Heiner Beckmeyer, Nicole Branger and Leander Gayda identified retail orders in S&P 500 options through Cboe’s retail price improvement mechanism, and their retail 0DTE study tracked them from February 2021 to September 2023. Retail lost $241,000 on an average day. On the paper’s own daily table, $184,000 of that was trading costs, 76%. After daily expirations arrived in May 2022, the loss rose to $350,000 a day, of which I make $244,000 costs. Most of it was friction.
That finding is disputed. Diego Amaya, Pedro Garcia-Ares, Neil Pearson and Aurelio Vasquez work with Cboe data, in this case under a Cboe Options Institute grant. Their 2025 paper on customer options performance argues that auction based proxies catch only 4% to 6% of S&P 500 options trading, “an implausible low estimate of retail trading.” It estimates Cboe customer auction trades made $0.34 million a day, with a t statistic of 0.29 that the authors themselves call not significant.
My read is that the dispute is about direction, and the dealer’s revenue survives either answer. Whether retail wins or loses on the index, it pays the spread whenever it crosses the quote. Cheaper than the screen is still the dealer’s margin.
One quote, worked: the 7,765 call on 22 September
At Tuesday’s close, with the S&P 500 at 7,764.64, the SPXW 7,765 call expiring Wednesday was quoted 16.70 bid, 17.00 offered in the same Cboe file, which I have archived. That quote is one session before expiry; the contract became a same day option at Wednesday’s open. Each index point is $100 a contract.
I make the half spread $15 a contract, 0.89% of the $1,685 mid. That is what a market maker collects, before hedging, from a buyer who crosses to the offer. Cboe’s model put theta at −10.895 points, about $1,090 a day at Tuesday’s level. On the final day theta understates the cost: had Wednesday settled at Tuesday’s close, 36 cents under the strike, the call would expire worthless and the buyer would lose all $1,700.
Cboe’s model put gamma at 0.0114. Multiplied out linearly, that is $687,000 of S&P exposure per 1% move for one short contract, the same dollars per 1% convention Cboe’s positioning studies use. A real 1% move hedges for less, because delta saturates. Repricing the option at its quoted 10.2% implied volatility, I get about $360,000 to $370,000 per contract either way. Short a thousand of these and a 1% drop means selling roughly $365 million of futures. The question is how many a dealer is actually short.
Volume overstates that badly. Tuesday’s same day 7,770 to 7,785 calls traded 797,404 contracts between them and closed quoted 0.00 bid, 0.05 offered. The index closed below all four strikes, but three were in the money at the day’s high of 7,782.19. Open interest of roughly 2,500 to 3,300 contracts per strike, against 130,000 to 230,000 traded, says most of that volume opened and closed inside the day. I read that as a warning about volume. At the close, the whole nickel is spread.
Why the SPX book mostly nets: 14.95% sold, 14.06% bought
The SPX book mostly nets because customers sell dealers nearly as many same day contracts as they buy from them. Amaya and his coauthors rebuilt market maker positions minute by minute from Cboe’s proprietary SPX trade records. On the average day from January 2020 to June 2023, in their study of dealer gamma, customers buying 0DTE options from market makers made up 14.952% of all SPX and SPXW volume. Customers selling them to market makers made up 14.062%. I make that about 94 contracts sold back to dealers for every 100 bought from them. Those customers are everyone who isn’t a market maker, institutions included, and Citadel Securities’ retail slice cannot be separated out in public data.
Matched volume is necessary and it is not sufficient. Gamma depends on which strikes are left over and when. Cboe’s strike level work matters here. Mandy Xu’s 2023 study of SPX 0DTE market impact looked at 15 August 2023, when more than 100,000 contracts of the 4,440 put traded and dealers ended net short about 3,000, 52,000 bought against 55,000 sold.
I went looking in Cboe’s reconstruction for the short dealer book the commentary implied, since it blamed the 4,440 put for the 3pm drop. It wasn’t there. Dealers were long about $2 billion of gamma at 3pm when the selloff started, which leans against the move, and turned short, about −$500 million, only at 3:30pm, after the index had already stabilized. The sign flipped. The size stayed small.
I’d add that dealers aren’t the only other side. An SEC staff paper on 0DTE limit orders, by Lei Fu, Su Li, David Musto and Neil Pearson, finds that “a quarter of all 0DTE trades are customer MTOs and POs that got filled,” and auction trades between two customers rose from 10% to 18%. Retail trades both sides too: Xu’s full 2025 report puts 27.6% of retail 0DTE volume in vertical spreads and 7.7% in iron condors. Roundhill’s XDTE fund says in its SEC prospectus that it “generally sells out-of-the-money 0DTE call options on the S&P 500” every business day, one filed example of the other side.
Still, trades between two customers are only 1.659% of SPX volume in Amaya’s table, about 5% of 0DTE volume once divided by the 34.8% same day share. The dealer sits on one side of most trades. It just gets most of them back.
Size and sign separate a spread book from a short gamma bet
Two numbers separate them, size and sign. A spread book stays small against the futures market; a short gamma bet runs persistently negative and needs a premium large enough to pay for hedging it. I can check both.
Chukwuma Dim, Bjørn Eraker and Grigory Vilkov’s paper on 0DTE gamma risk measures that premium as the return on a short variance swap. They put it at about 0.01% a day, “which makes it hardly profitable given the required delta-hedging intensity for high-gamma instruments and realistic transaction costs.” A desk cannot live on that. It can live on the quote.
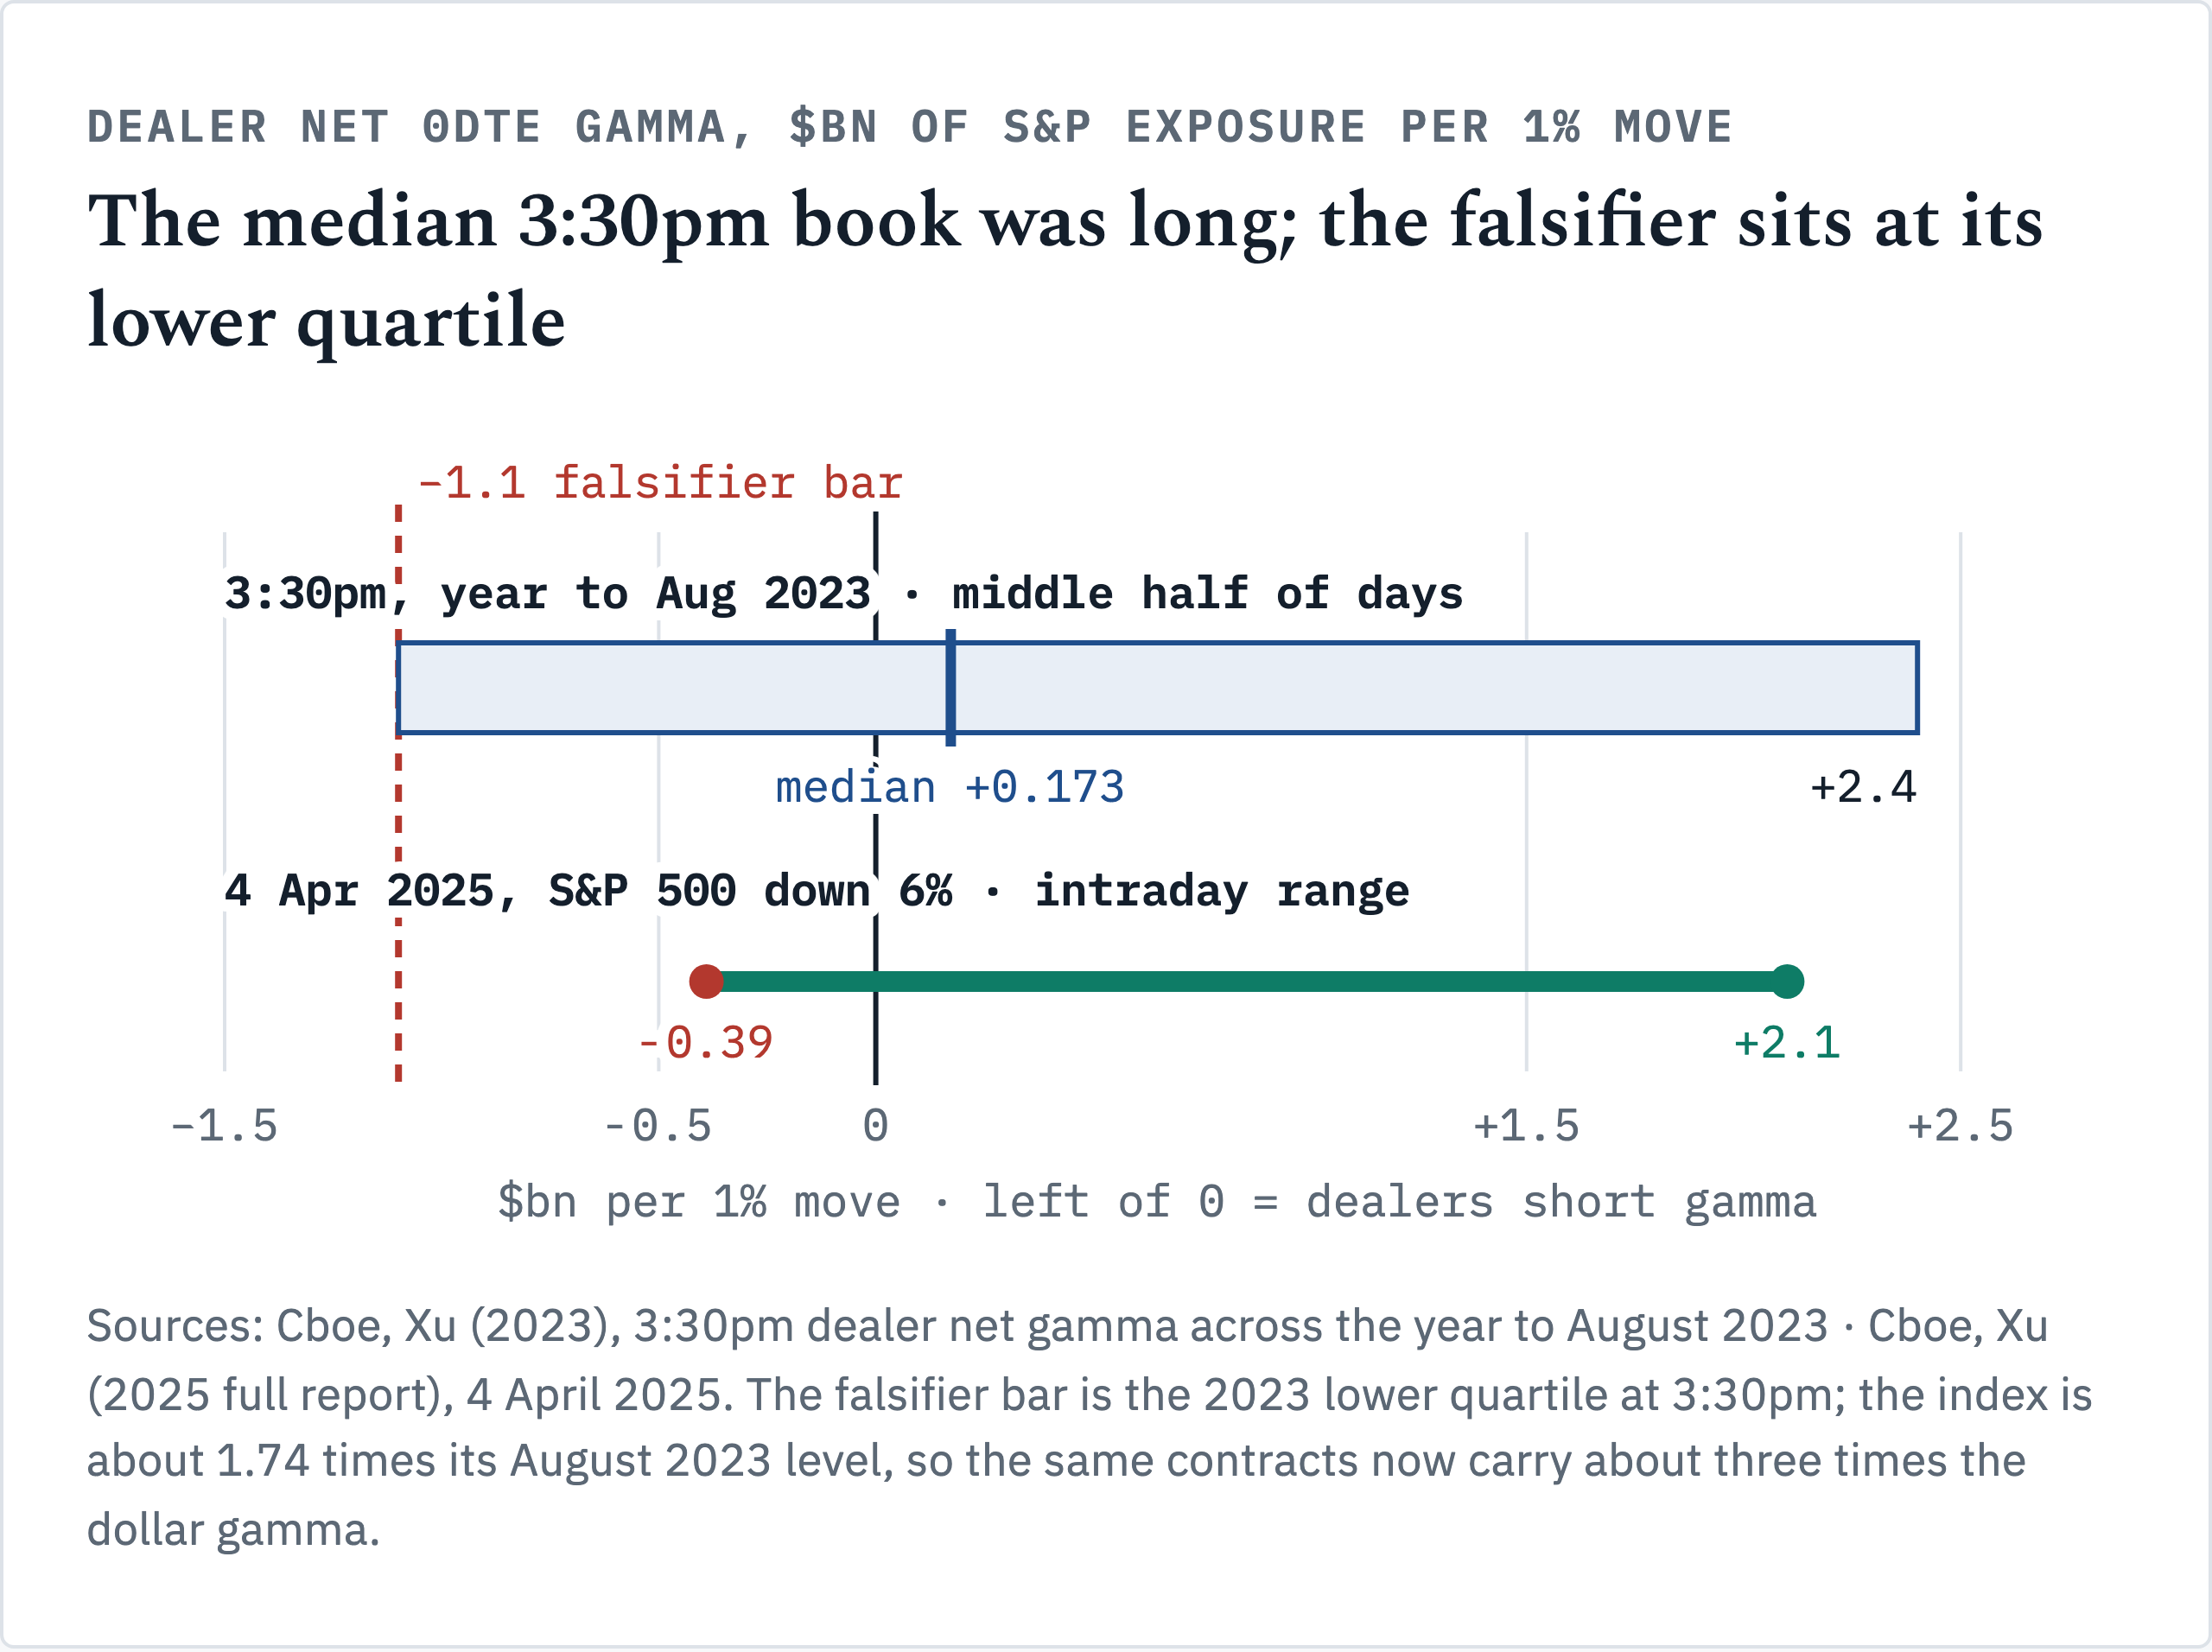
The size looks like a spread book too. I checked it two ways. Across the year to August 2023, Cboe put average dealer net gamma through the day at $170 million to $670 million per 1% move, against roughly $400 billion of daily S&P futures. I make that 0.04% to 0.17%. At 3:30pm the median was +$173 million, with the middle half of days between −$1.1 billion and +$2.4 billion.
The one public stress read is thinner than it sounds. Xu’s 2025 report examined two days: on 4 April 2025, with the S&P 500 down 6%, dealer 0DTE gamma ran from +$2.1 billion to −$390 million, mostly long; on 9 April, up 10%, it stayed long. Against futures volumes of $850 billion to $940 billion, roughly double the 2023 base, that came to “at best, just 0.2%.” The doubled denominator flatters the ratio, I think. Even so, the sign was mostly right.
The broader dealer book is drifting. Amaya’s gamma covers every SPX expiry, and “daily average gamma is rarely negative before 2022, but is often negative starting in early 2022.” After May 2022 the median day dipped below zero at some point. In the 0DTE only data that exist, the hedge leaned against the move on most days. I’d hold that more loosely than the averages suggest.
What the flow costs: $0.51 to $0.44 a contract at Robinhood
By my arithmetic, Robinhood’s options revenue fell from $0.515 a contract to $0.442 in a year, down 14.1%. Its second quarter 2026 results report $342 million of options revenue on 774 million contracts, and the same release a year earlier showed $265 million on 515 million. The broker side prices the flow.
Robinhood’s quarterly report gives the reason: “lower option rebate rates due to the mix of ticker symbols traded.” That is a cost to the wholesaler, so a lower rate per contract makes the raw material cheaper. It tells me nothing about the spread thinning.
My read is that the threat to this business is competition for the flow, and so far it is intent. Optiver, Virtu and Akuna back Optimal Market Technologies, which announced on 19 February 2026 a model where market makers “compete for the right to trade against a retail broker’s order flow based on their execution quality.” Its first clients are wholesalers. The SEC staff’s April 2026 data also put auction design and payment for flow on the table, a year after the Commission withdrew proposals including the Order Competition Rule, an equities routing rule by Virtu’s account.
Capacity sits with whoever holds the flow agreements. My read is that scale protects the incumbents in one specific way: a wholesaler that sees 35% of retail volume nets more of it internally, pays less to hedge, and can bid more for the next order. A fund can’t rent that edge, as I see it.
Three things I can’t rule out
Three things could still break my read: the tail, a published dissent, and data that mostly ends in 2023. First comes the tail. Amaya’s paper measures what negative gamma cost in its 2020 to 2023 sample: at most 3.3 percentage points of annualized daily volatility, and 6.4 points over 30 minutes. Ordinary 30 minute changes run from −11.6 to +14.2 points at the 1st and 99th percentiles. Bounded in that sample isn’t bounded going forward.
Second comes the dissent. Beckmeyer and his coauthors reach the opposite sign: “Option market makers have negative Gamma exposure,” so their hedges trade “in the same direction as the previous market move.” Dim and his coauthors note their own results “contrast those of” Brogaard, Han and Won, among others. They also find the link between index volatility and 0DTE trading has grown “marginally stronger.” I couldn’t open Brogaard’s paper through SSRN, so I state it only as that dispute.
Third, the samples are old, and they share a source. The dealer gamma studies end in 2023, plus Cboe’s two April 2025 days, while SPX 0DTE volume has nearly tripled since the start of 2024. For 5 August 2024 and 7 April 2025 I found only vendor models. Most of this evidence also runs through Cboe’s data, including the academic work, and Cboe sells the product. The SEC’s staff data is independent. It doesn’t measure dealer gamma.
Retail share needs one warning. JPMorgan put individuals at about 5% of S&P 500 same day volume in 2023, Beckmeyer’s proxy more than 6%, Cboe 50% to 60% in 2025, and the SEC staff 73.5% of expiration day trading outside market makers. I count four measuring sticks, and I won’t average them.
In July I argued the Volmageddon mechanism had relocated into 0DTE options and called the evidence contested, in my piece on the 895x gap. For SPX I’d now narrow that claim, and I’m not going to dress it up. The mechanism lives in a minority of sessions there. The average day works against it.
What would change my view by June 2027
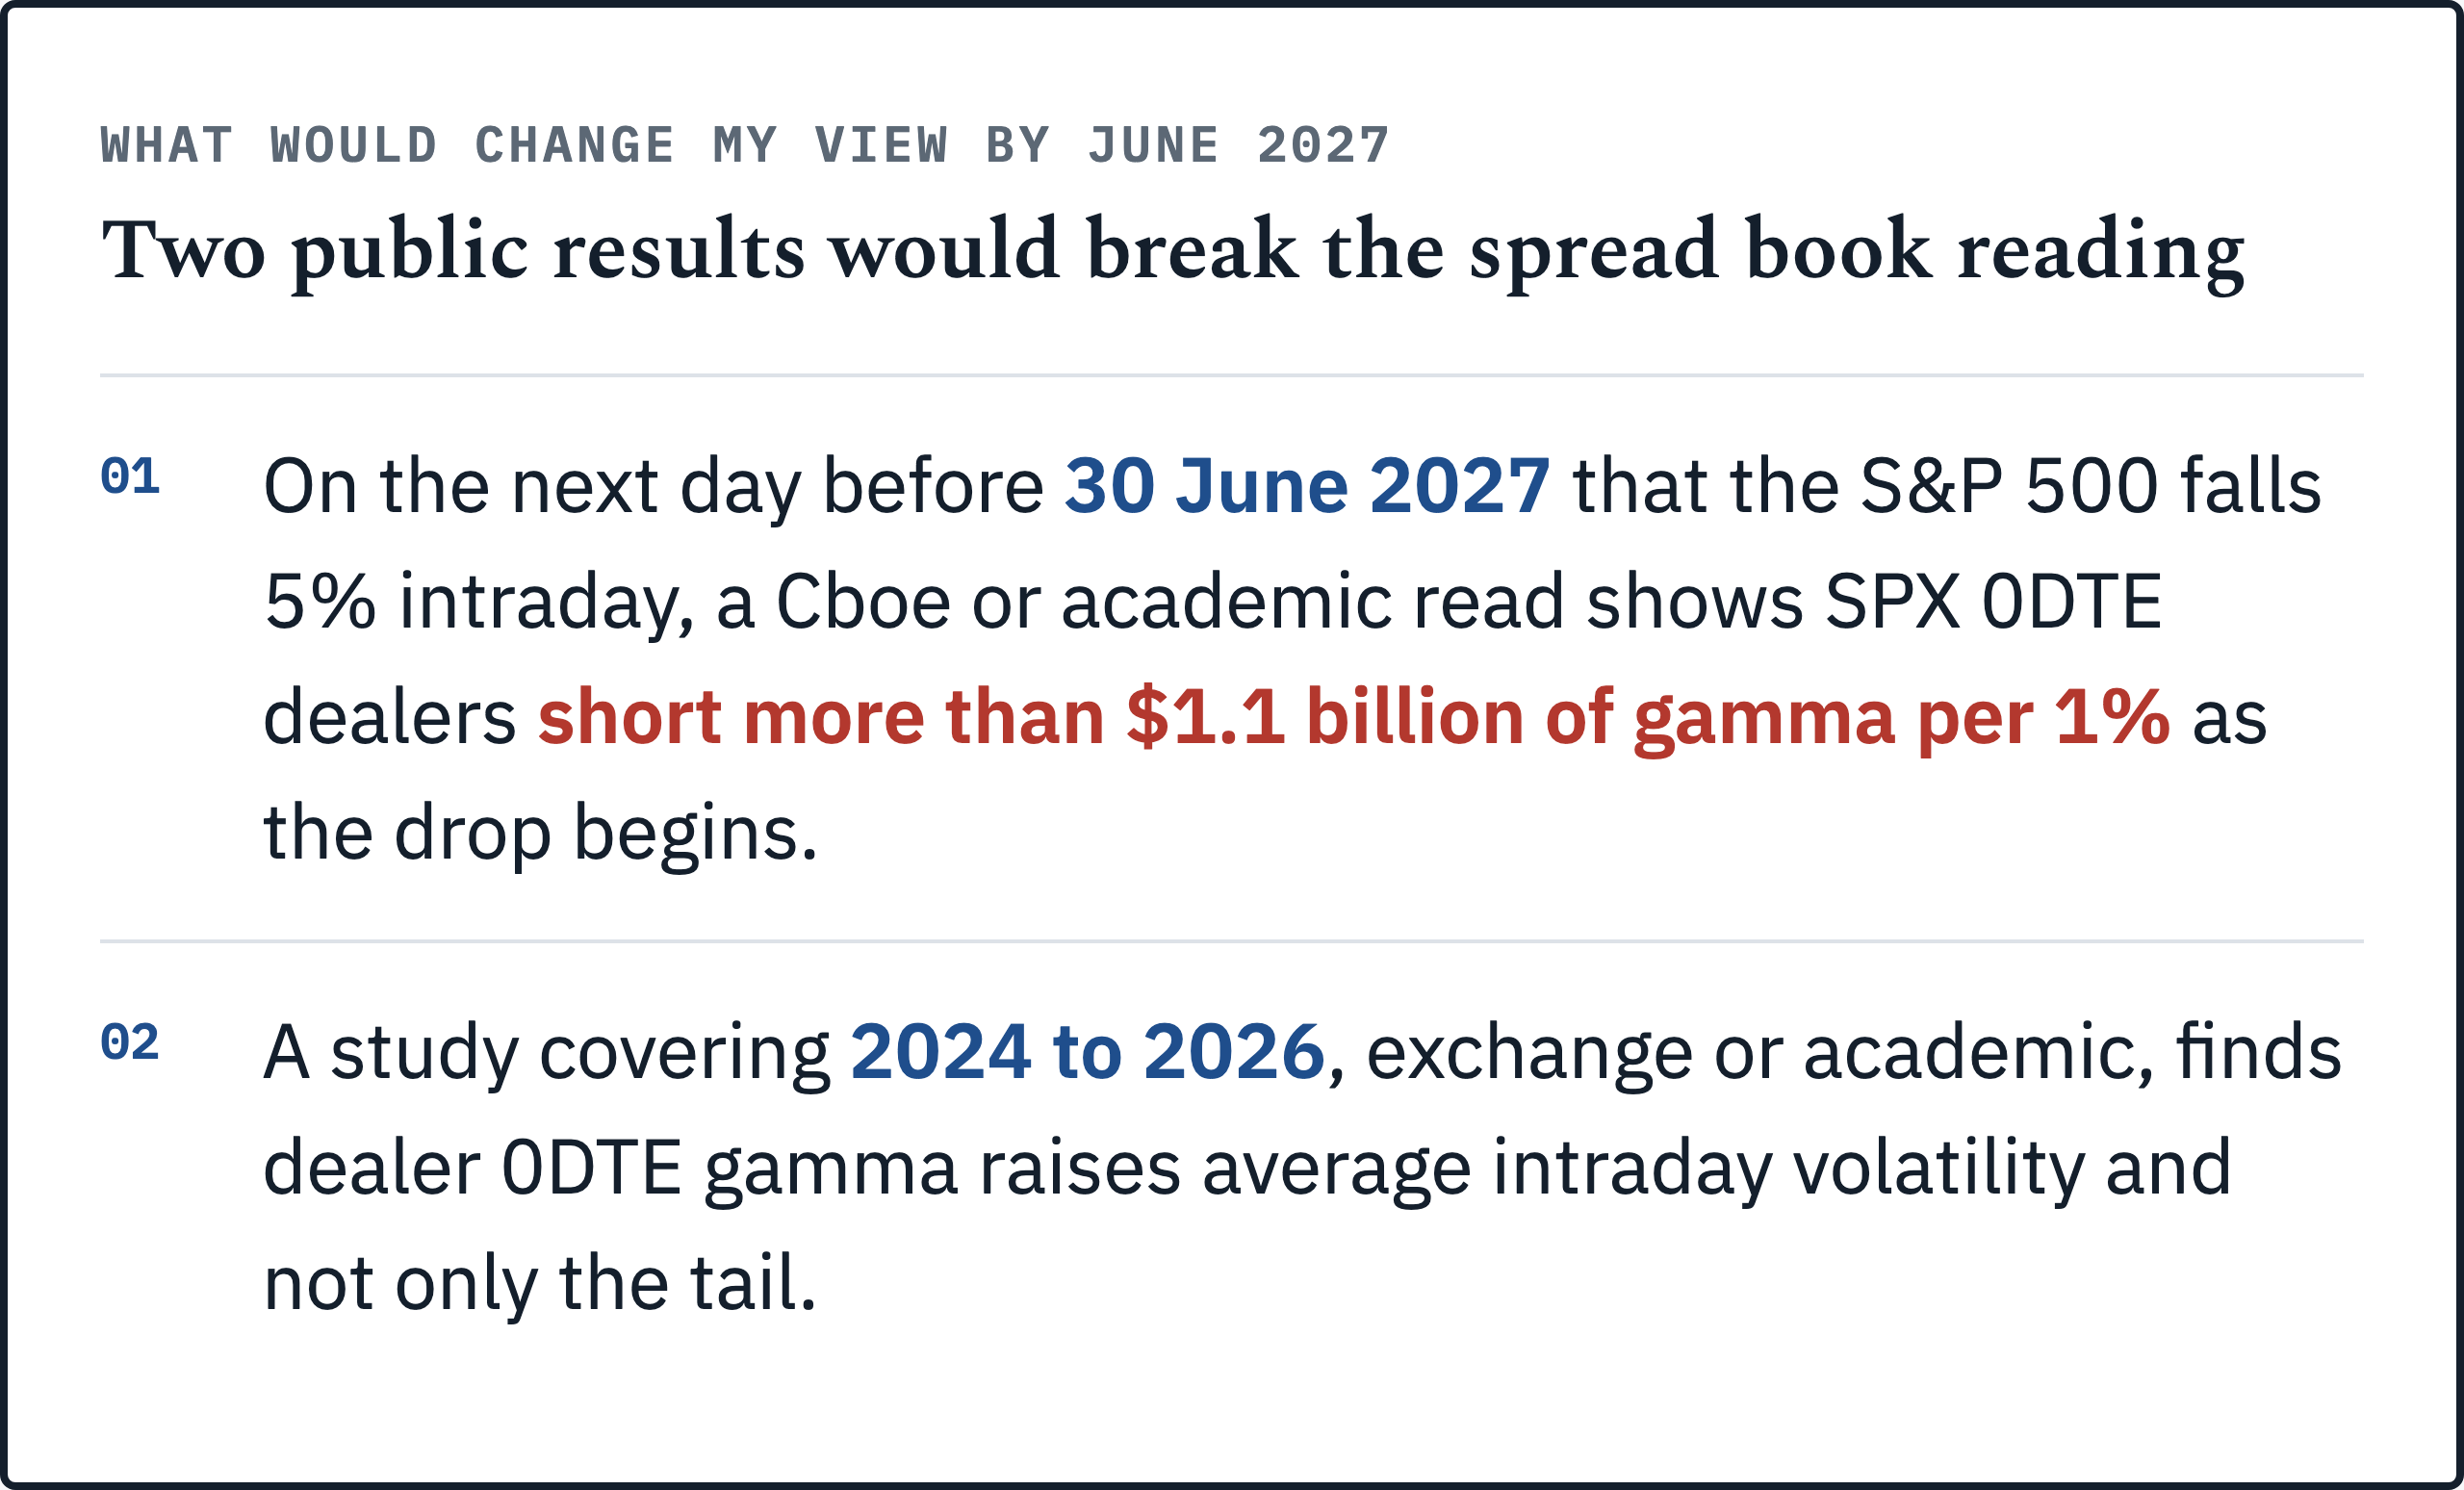
Two public results would change my view: a short dealer book on the next 5% down day, or a 2024 to 2026 study tying dealer 0DTE gamma to everyday volatility. The first is event driven. The last day like that Cboe examined was 4 April 2025, when the S&P 500 fell 6%. On the next such day before 30 June 2027, if a Cboe or academic read shows SPX 0DTE dealers short more than $1.1 billion of gamma per 1% as the drop begins, the balanced book is wrong at today’s volumes. That bar is the 2023 lower quartile at 3:30pm. With the index about 1.74 times its August 2023 level, the same contracts carry about three times the dollar gamma, so the bar is easier to cross. I’d rather the test be harsh on me.
The second is slower. If a study covering 2024 to 2026, exchange or academic, finds dealer 0DTE gamma raises average intraday volatility and not only the tail, my reading loses its main support.
Either result would mean the flow stopped netting. That’s the variable. The spread would still be there. The risk wouldn’t be small any more, and the JPMorgan scenario would stop being a stress test and start being a forecast.
The Monday expiry in Nvidia is where I’d look
I’d look next at the Monday expiries in single stocks, Nvidia’s among them, because that’s where Citadel Securities’ growth came from. Rubner’s own numbers describe a call heavy book: in June, retail traded about $1.9 billion of semiconductor options premium a day, “with ~75% of that activity concentrated in call options.” Call heavy isn’t the same as one way. It nets if the same customers also sell calls, and the buy and sell split is the number nobody publishes.
Amaya’s gamma paper also cites work by Lipson, Tomio and Zhang finding “0DTE trading of single-name options is associated with increases in the volatility of the options’ underlying stocks.” I found no exchange or academic dealer positioning read for those Monday expiries, so I can’t size that book. Across the nine names they approach 6 million contracts a day, a count of contracts rather than of money at risk. That’s the book I’d want to see.
I did build the worst case bound on it. From Cboe’s own delayed quote files, it asks how many shares a 1% move would force dealers to trade if they were short every open contract in the expiring series, and it runs before the open: the same day gamma screen, worked on all nine names, on Patreon.
For a PM, my practical read on SPX is narrow. On an ordinary day, 0DTE dealer hedging is too small to explain an afternoon move, so I wouldn’t blame it by reflex. On a day when customer flow runs one way, the sign can flip, and that’s where the tail lives.
Which runs out of the other side first: SPX at 3:30pm on a down day, or a Monday expiry in a single stock with three quarters of the premium in calls?
Further reading
How to Read a Market Maker’s 13F Options Line: Jane Street and Susquehanna’s SpaceX Book, Ranked Against Their Own, where I worked out what one public filing can and can’t show about a dealer’s options book.
Market Making Alpha: How Virtu Won 1,237 Days, the spread business I’d set beside this one, measured through one market maker’s own disclosures.
How Institutional Traders Exploit Gamma Explosion at Options Expiration, where I set out why gamma concentrates as an expiry nears.
Paid subscribers get the position, the levels, the sizing and the dated falsifier calendar on every piece. The next paid piece reads one named fund’s bet from its own filing, with the position.
The Decision-Grade Version
This piece is complete on its own. The thesis, the evidence, and what would kill the view are all above, and nothing was held back to sell you a next step.
The Patreon note is a separate piece of work rather than a deeper cut of this article. It takes the same day gamma screen and works it end to end, open to everyone. Members get one on every piece; the paid notes carry the second trade, the stress test and the model behind the levels.
→ Read the same day gamma screen note
→ Or join the Patreon community for every note
Navnoor Bawa · LinkedIn · The Mathematical Trader on YouTube
Cover photo: Paul Elledge · CC BY-SA 4.0, adapted (cropped) · via Wikimedia Commons
