


BH Macro, the London-listed fund investing in Brevan Howard’s flagship, lost 6.22% in March, the worst of its 236 months. It then dropped from its April report the table splitting each month by book, or asset class.
Brevan Howard is known as the rates house: BH Macro’s Board, in its 30 March annual report, calls interest rate and currency trading “the two historically principal drivers of return”. In a year of rate shocks its flagship lost on rates, and BH Macro’s dollar shares, its US dollar class, are about flat for 2026.
Rates made its worst months and stocks its best; the dollar shares, after fees, trailed a three-month Treasury bill three calendar years running; and the 31 December estimate decides whether 2026 is a fourth.
I compounded BH Macro’s own monthly table back to March 2007, matched every year it states, and set each year against the Fed’s three-month bill rate.
The paid part settles, with my odds, whether 2026 is a fourth year behind a bill. The deciding number is the November–December return a bill requires.
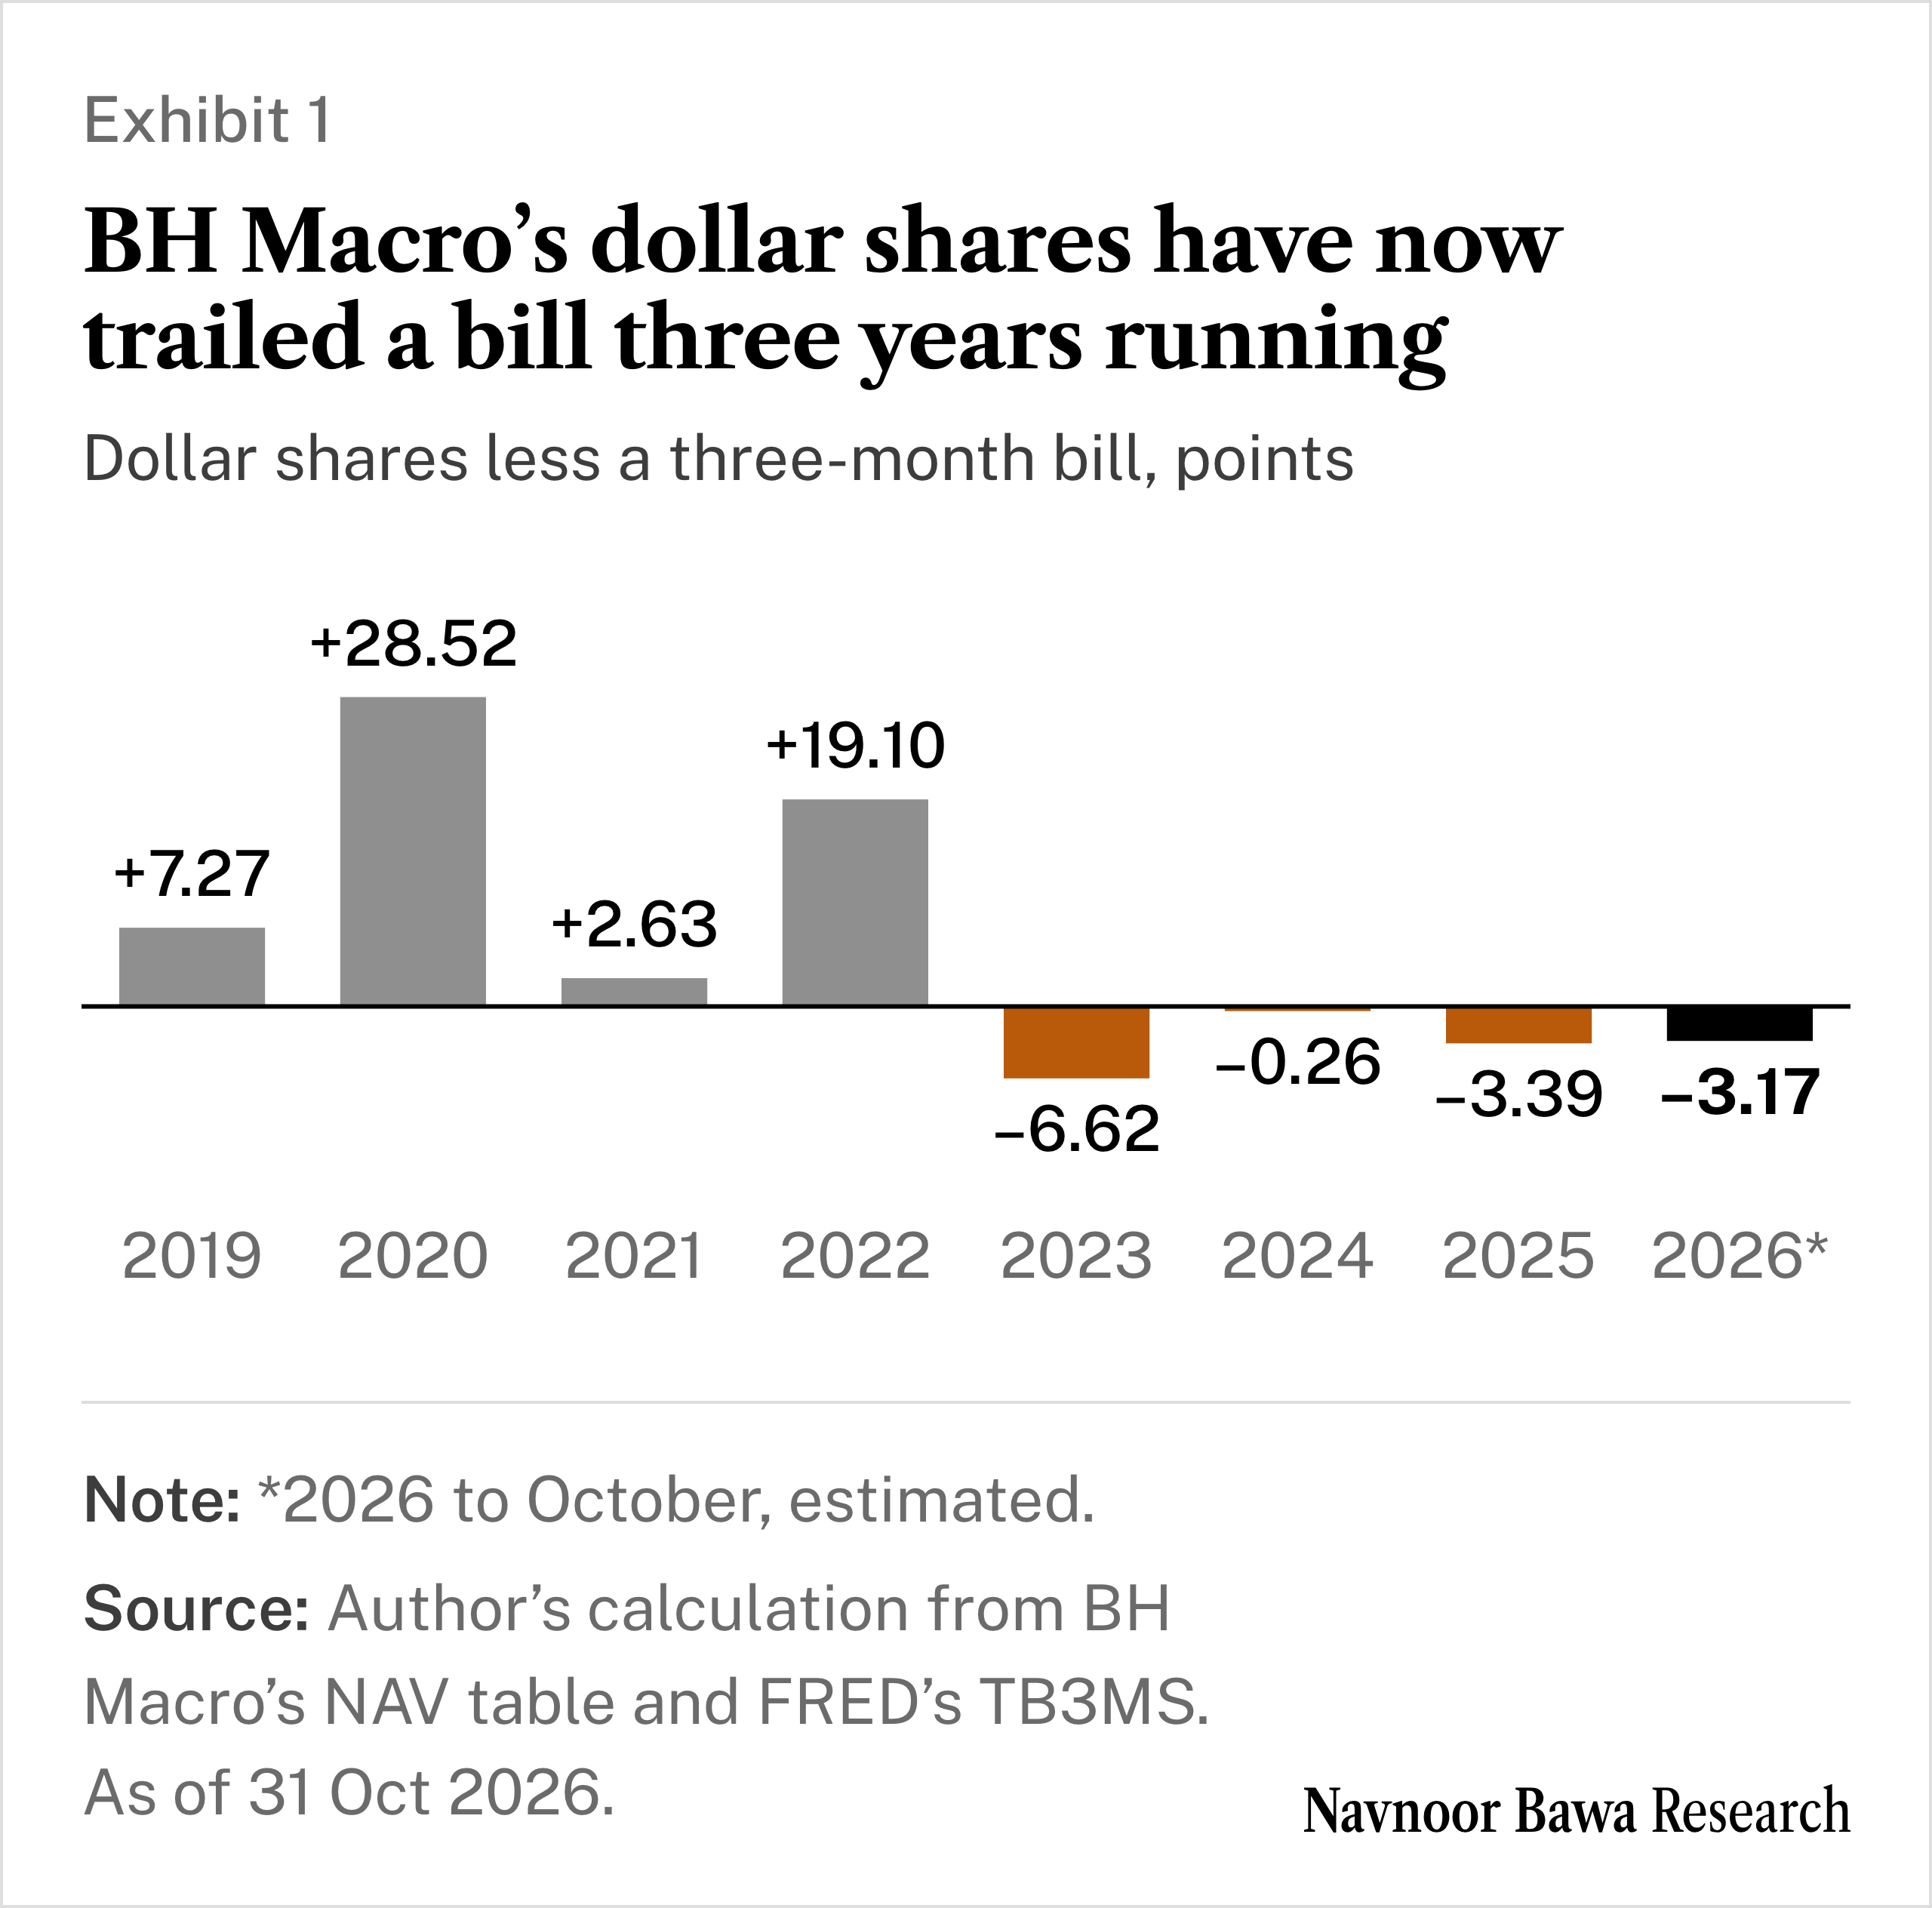
Source: Author’s calculation from BH Macro’s net asset value (NAV) table (years as stated; 2026 the 31 October estimate) and FRED’s TB3MS. Every year from 2007 to 2014 was ahead of a bill; before 2023, a year behind was always followed by one ahead.
The worst month in 236
Those 236 months are the record since March 2007 of BH Macro’s dollar shares, one of its two share classes beside the sterling shares. Every return here is theirs, on net asset value (NAV) per share rather than the share price, unless named otherwise. The year’s months compound to +0.01%, against the +0.02% BH Macro printed to October. Every year it states since 2007 comes back within 0.04 points.
Nothing on that record comes near March; the next worst month is −4.11%, in March 2023. The manager, Brevan Howard Capital Management, gives the backdrop in BH Macro’s interim report of 29 September: “The second major development was the war with Iran, which began at the end of February.”
By the March report’s own table, rates contributed −3.71 points to the month’s estimated loss and equities −1.61. Over the first quarter, equities added 2.00 points while rates lost 4.06. The split is the manager’s estimate, “produced at the instrument level, with adjustments made based on risk estimates”, and no revised split followed the final figure.
The Master Fund, the flagship BH Macro invests in, held $11.39bn of net assets at 30 June, about a sixth of it BH Macro’s. It lost 6.6% in March, Bloomberg reported via Hedgeweek, its worst month in more than 20 years. A war explains that month. It does not explain September’s −2.14%, or the three years behind cash before it.
Brevan Howard’s listed feeder trailed a three-month Treasury bill on its dollar shares in 2023, 2024 and 2025, after fees; in the 16 years before, it never trailed one two years running.
Then the table went
That split by book ran in all seven monthly reports I read from March 2025 to March 2026. From the April report, the first after the worst month on record, a sentence naming the lead book took its place, with no size for any book. The reports give no reason for the change, and the 2025 annual report still printed the split.
With the January and February tables, those sentences show equities leading four of 2026’s five gaining months and commodities the fifth; rates led none, and September’s named detractor was rates.
Bloomberg reported the first part on 21 May: “Stocks Drive Gains for Brevan Howard Macro Hedge Fund After Rates Losses“. The reports since add September; no coverage I found sets BH Macro’s dollar shares against cash.
Stocks paid, rates cost
The pattern predates the war. Across 2025, the annual report’s table put equities at +6.18 points of the dollar shares’ return. Currencies cost more than rates did, −4.84 points against −1.38, so both books the Board calls principal lost money.
The risk did not follow the money. At 30 June, by the interim report’s count, rates made up 24% of the Master Fund’s value at risk, a model’s estimate of a loss it should rarely exceed, summed by product. Volatility trading made up 27% and equities another 24%. Its capital still leaned to rates: by the annual report, 69% sat at the end of 2025 in directional strategies, bets on which way markets move, where “the majority of risk in this category is in rates”.
The manager, co-founded by Alan Howard and run by chief executive Aron Landy, gives each core trader a slice of capital sized to the same severe loss, which it calls “adjusted capital”. Beside them it runs temporary books for tactical bets, called risk-overlay books. In January Brevan made Fash Golchin lead portfolio manager of the Master Fund, where he is expected to oversee the largest cash allocation, and wound down his $1.4bn FG Fund, Bloomberg reported via Hedgeweek.
After March the allocations changed again. By the September report, the risk-overlay books had fallen from 15% of capital to 7%. Core traders holding more than a tenth of capital went from four to two, and the top three held 40% between them, the kind of concentration our October piece found.
On its own, the change did not make the year flat; April and May made 5.2% between them after it. Nor does it explain which book lost in September.
Long rates into the rise
September cost the dollar shares 2.14%, and the report named the book: “Interest rate trading was the primary detractor during the month, with broad-based losses from long exposure across DM rates, led by EUR and with further losses in US, GBP and AUD directional positions.”
In plain terms, the book was long developed-market (DM) rates, which gains when yields fall, and euro rates lost the most. The German 10-year yield averaged 3.47% in September against 3.19% in August. The same report named equity trading as “the next largest detractor”, with gains in “rates volatility and swap spreads” as a partial offset: bets on how much rates swing, and on the gap between the fixed rate banks quote on interest rate swaps and government bond yields.
What surprised me in the documents was September: after a year of rates losses, the book stood long developed market rates into a selloff that took the US 10-year yield from 4.75% to 5.29%.
On 16 September the Fed raised its target range by a quarter point, to 3.75% to 4%, with no dissent. The manager’s interim report called the move a “downpayment” on a “path to reverse the 75 bps of insurance rate cuts from last year”, its phrase for precautionary cuts. BH Macro’s Board saw “a richer but less forgiving macro opportunity set” in the second half.
The weekly estimates had the dollar shares up 1.57% on 2 October and 1.39% on 23 October. Over the month the US 10-year yield fell from its 5.31% high on 5 October to 4.94% on 30 October. The Fed held rates on 28 October, two voters dissenting. The month closed at an estimated +0.41%, a figure BH Macro warns “may be materially different” once final.
Three years behind a bill
The streak holds however the bill is counted, and the case against it is a start date. I compounded FRED’s three-month rate two ways, as a 91-day bill bought at its discount price and as the plain rate divided by 12, and both give the same verdict in every year. From January 2022 the dollar shares are ahead of bills, +26.5% against +21.6%, because 2022 alone made 21.17%. From January 2023 they are behind, +4.4% against +19.1%.
The streak is the dollar shares’. In 2024, by Hedgeweek’s report of 9 January, the Master Fund itself made 5.14%, within 0.04 points of a bill, and the sterling shares made 5.86%. The sterling shares, which hold most of BH Macro’s money, beat sterling cash that year and trailed it in 2023 and 2025. Ongoing charges, performance fee included, ran about 2.1% to 3.1% of NAV a year on the dollar shares from 2023 to 2025.
Richard Horlick, BH Macro’s chair, judges by another yardstick, citing in the interim report the company’s “low structural correlation to equity or bond markets” and “steady returns with occasional periods of significantly higher returns”. The occasional years are real: 20.3% in 2008, 28.9% in 2020.
Horlick has his own pension in it. “My own conviction is reflected in the fact that the Company’s shares comprise the majority of my pension portfolio.” The cash test is mine.
A hard year for discretionary macro explains part of 2026, not the streak. Bloomberg, as Hedgeweek reported on 5 November, put the Master Fund itself at −0.2% for 2026. Graham Capital’s discretionary macro fund was up 1.2% to October and Marshall Wace’s Eureka, an equity fund, 5.3%, by the FT’s figures via Hedgeweek; Citadel’s Wellington was up 15.3% by Bloomberg’s, via Seoul Economic Daily. The streak’s yardstick is cash, and in 2025 the dollar shares made 0.83% while a bill paid 4.22%.
This reading is wrong if BH Macro’s 31 December 2026 estimate, expected by mid-January 2027, shows the dollar shares ahead of a three-month bill for 2026.
→ Brevan Howard’s 2020 front-end rates trade, rebuilt from its own monthly reports, Trade File No. 9 on Patreon.
With two months left and the dollar shares about flat, does 2026 become a fourth straight year behind a bill?
Below the paid line:
The verdict, with my odds beside the record’s, and what the streak is made of: charges or trading.
The model behind them, and what would move them.
The book of record in three tables: each month’s lead book, charges against a bill, sterling against UK cash.
What this changes for a holder, a test for any macro fund, and the dated checks.