
Navnoor Bawa

Navnoor Bawa

Dealer Vanna Just Hit a Two Year Extreme. The BOJ Meets September 18. Here's the Level Where It Flips

The Black Scholes flip level for September 18, worked from six live inputs

Navnoor Bawa's avatar
Navnoor Bawa
Sep 06, 2026
∙ Paid

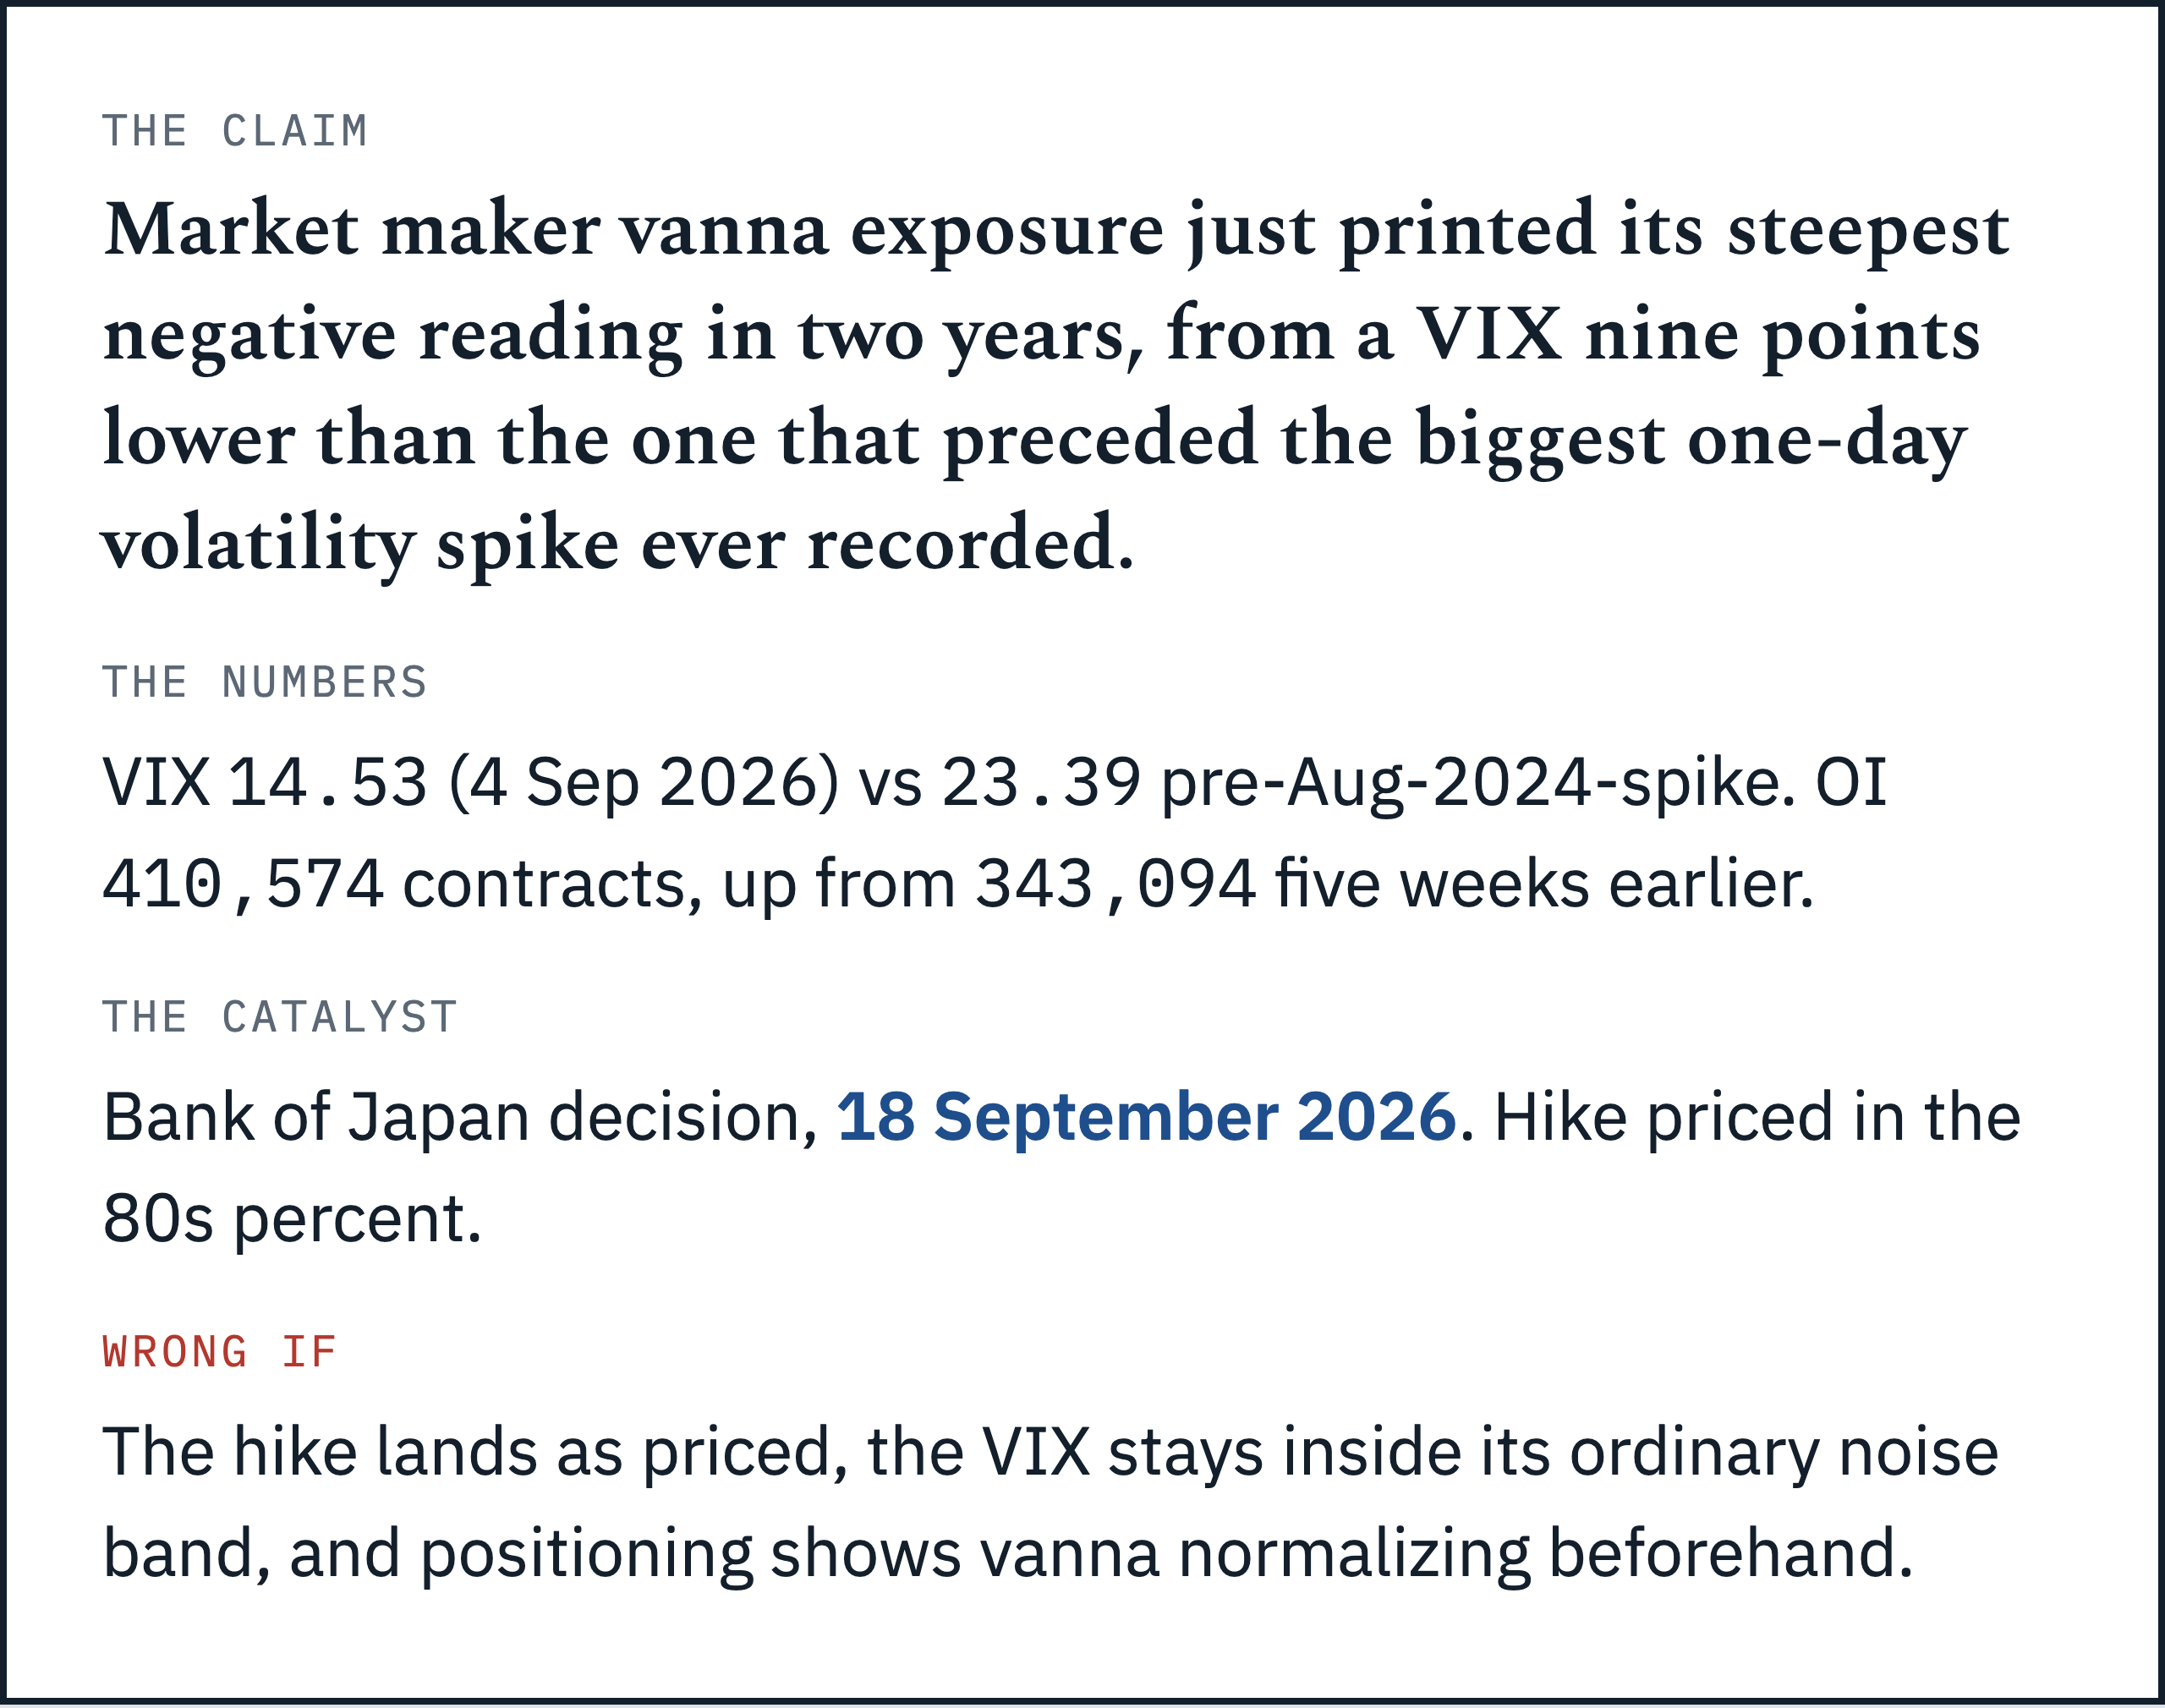
Market maker vanna exposure, the Greek that decides whether dealer hedging dampens a selloff or force feeds it, just printed its steepest negative reading in two years, from a VIX nine points lower than the one that preceded the biggest one day volatility spike ever recorded.
Below the paid line:

  • The full Black Scholes vanna calculation, six inputs shown, landing at a d1 of 1.19 and a vanna near -1.40.

  • The two scenario BOJ playbook: the under two point non event case against the three point plus confirming case, sized against the current vanna extreme.

  • The exact CBOE SKEW reading, 151.58 as of 4 September, that would make me stand down the whole trade if it reverses.

  • The three point VIX threshold and the two week dated calendar that confirms or kills this call.

Photo: Wikimedia Commons · Public domain · via Wikimedia Commons

The consensus, stated the way its believers would state it

Ueda has telegraphed this hike for weeks. Swap markets price it in the 80s percent, which most desks treat as effectively decided. A textbook efficient market puts the information in the price before the meeting starts. On that reading, the meeting itself should pass quietly, because there is nothing left to learn from it. That is the standard case, and I want it at full strength before I argue with it. Nothing left to trade, on this reading.

There is a second leg, and it is the stronger one. The VIX sits at 14.53, near the low end of its 2026 range. The S&P 500 closed at 7,718.60 on 4 September, close to its 2026 highs. A calm market has, historically, gone on being calm for long stretches, and the base rate on any single quiet Tuesday resolving into a crisis is small. September itself carries a documented seasonal headwind, the weakest calendar month for US equities since 1950 (Chase, on S&P 500 seasonality) and the one where the VIX typically climbs off its summer lows, and that pattern shows up most years with no vanna story required. Trade every low VIX print as a warning and you spend years paying for insurance nothing collects on. Most Septembers, that’s the whole story.

Both legs describe the setup correctly. I think they draw the wrong conclusion from it, because the mechanism that actually moves the index sits one layer beneath the level everyone is reading. Wrong layer, right facts.

The variant view: vanna at a two year extreme, from a nine point lower VIX

My read is narrower than “a crash is coming.” The market has priced the BOJ’s decision correctly. What it hasn’t priced is how elastic its own reaction will be, because the structural condition that turned an unremarkable jobs miss into 2024’s largest one day spike is back. It carries more room to run this time than it did in 2024.

Risk.net reported on 28 August 2026 that market maker vanna exposure, a second order Greek measuring how an option’s volatility sensitivity shifts as the underlying moves, hit its steepest negative level in two years. No other outlet or vol analytics shop has independently corroborated that specific magnitude claim; it traces to this one paywalled report, and I flag that plainly. Repeating the headline elsewhere does not count as a second source. The newsroom’s own framing calls it an echo of August 2024, “when the VIX volatility index made its biggest ever intraday surge on a relatively muted stock fall.” I can’t reproduce a dealer’s book from public data, and I’ll say exactly where that limit sits below. One source, real claim, named limit.

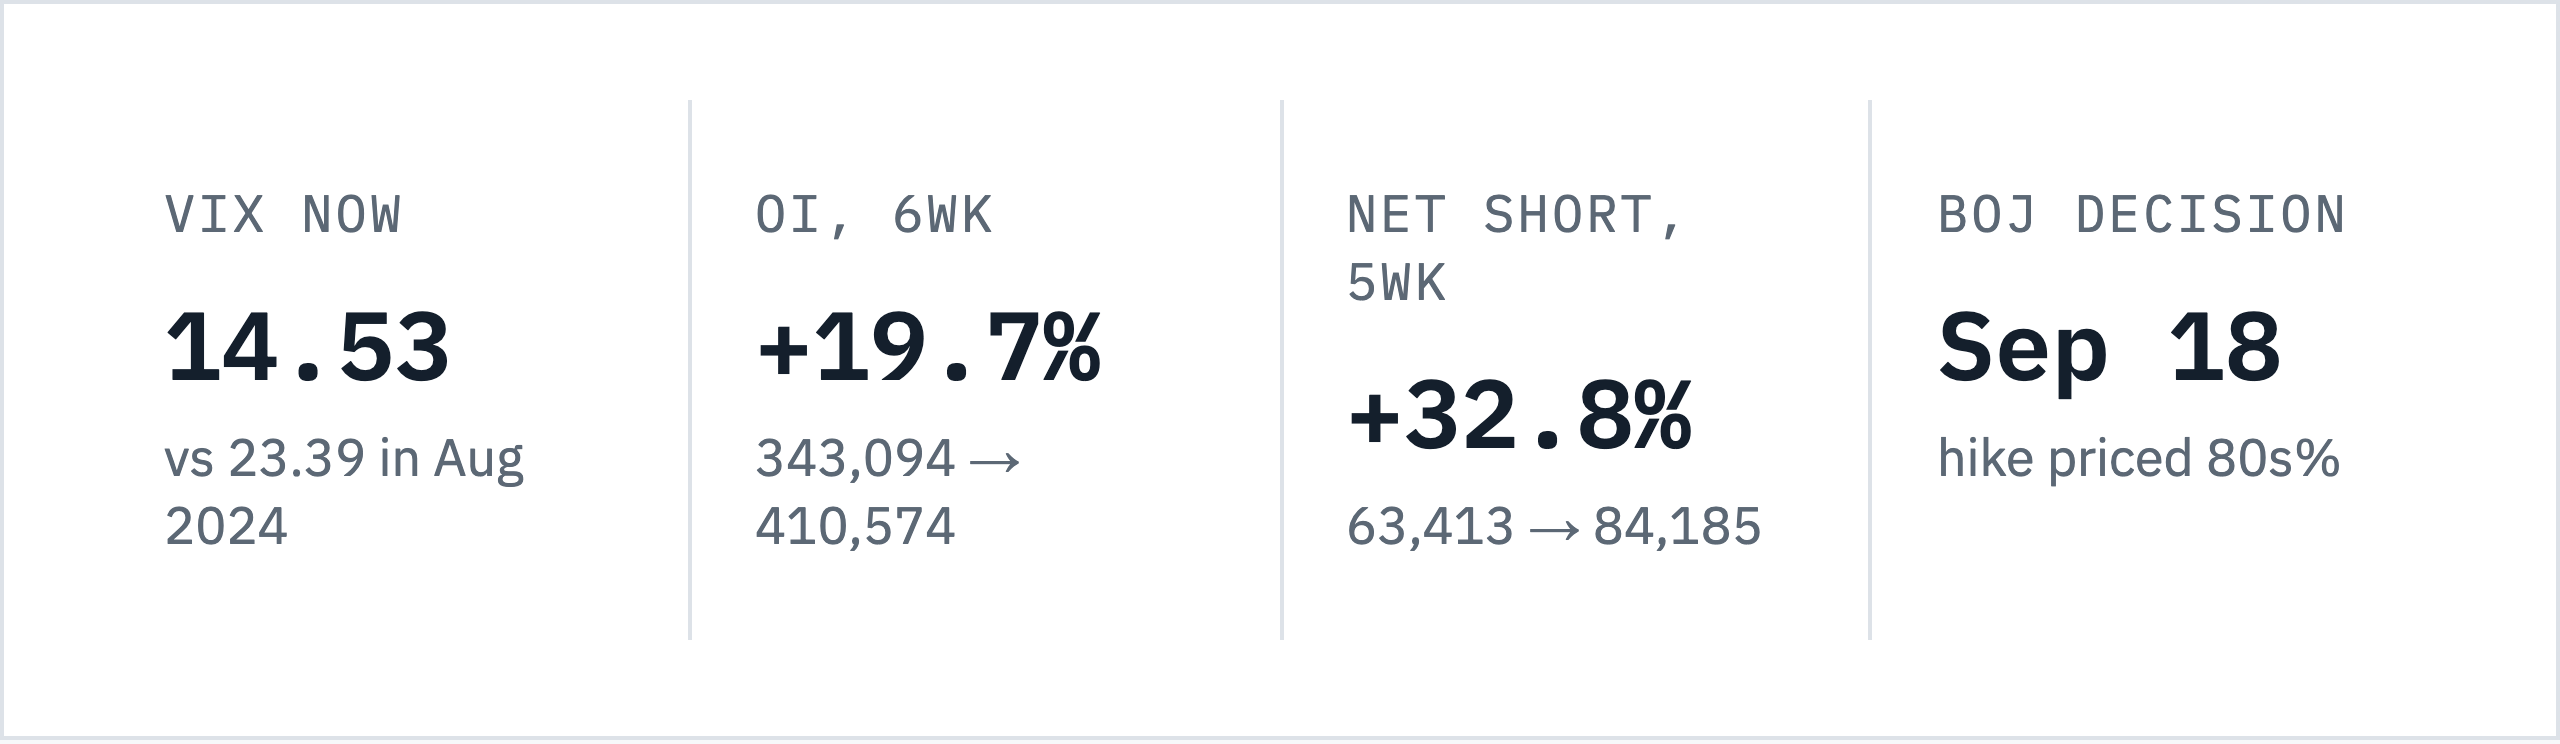
What I can verify is the setup it’s landing on: a VIX that opened this cycle nearly nine points under where 2024’s spike began, and VIX futures open interest that climbed from 343,094 to 410,574 contracts in five weeks. That’s a 19.7% jump, and it arrived as a series of sharp steps over five weeks (CFTC). The level itself is not unusual on its own; open interest ran higher than today’s print twice already this year, 440,161 in May and 417,768 in August, with no crisis attached to either reading. What stands out is the shape of the last five weeks against the two years of dealer positioning Risk.net describes, not the raw count. Five weeks, one direction.
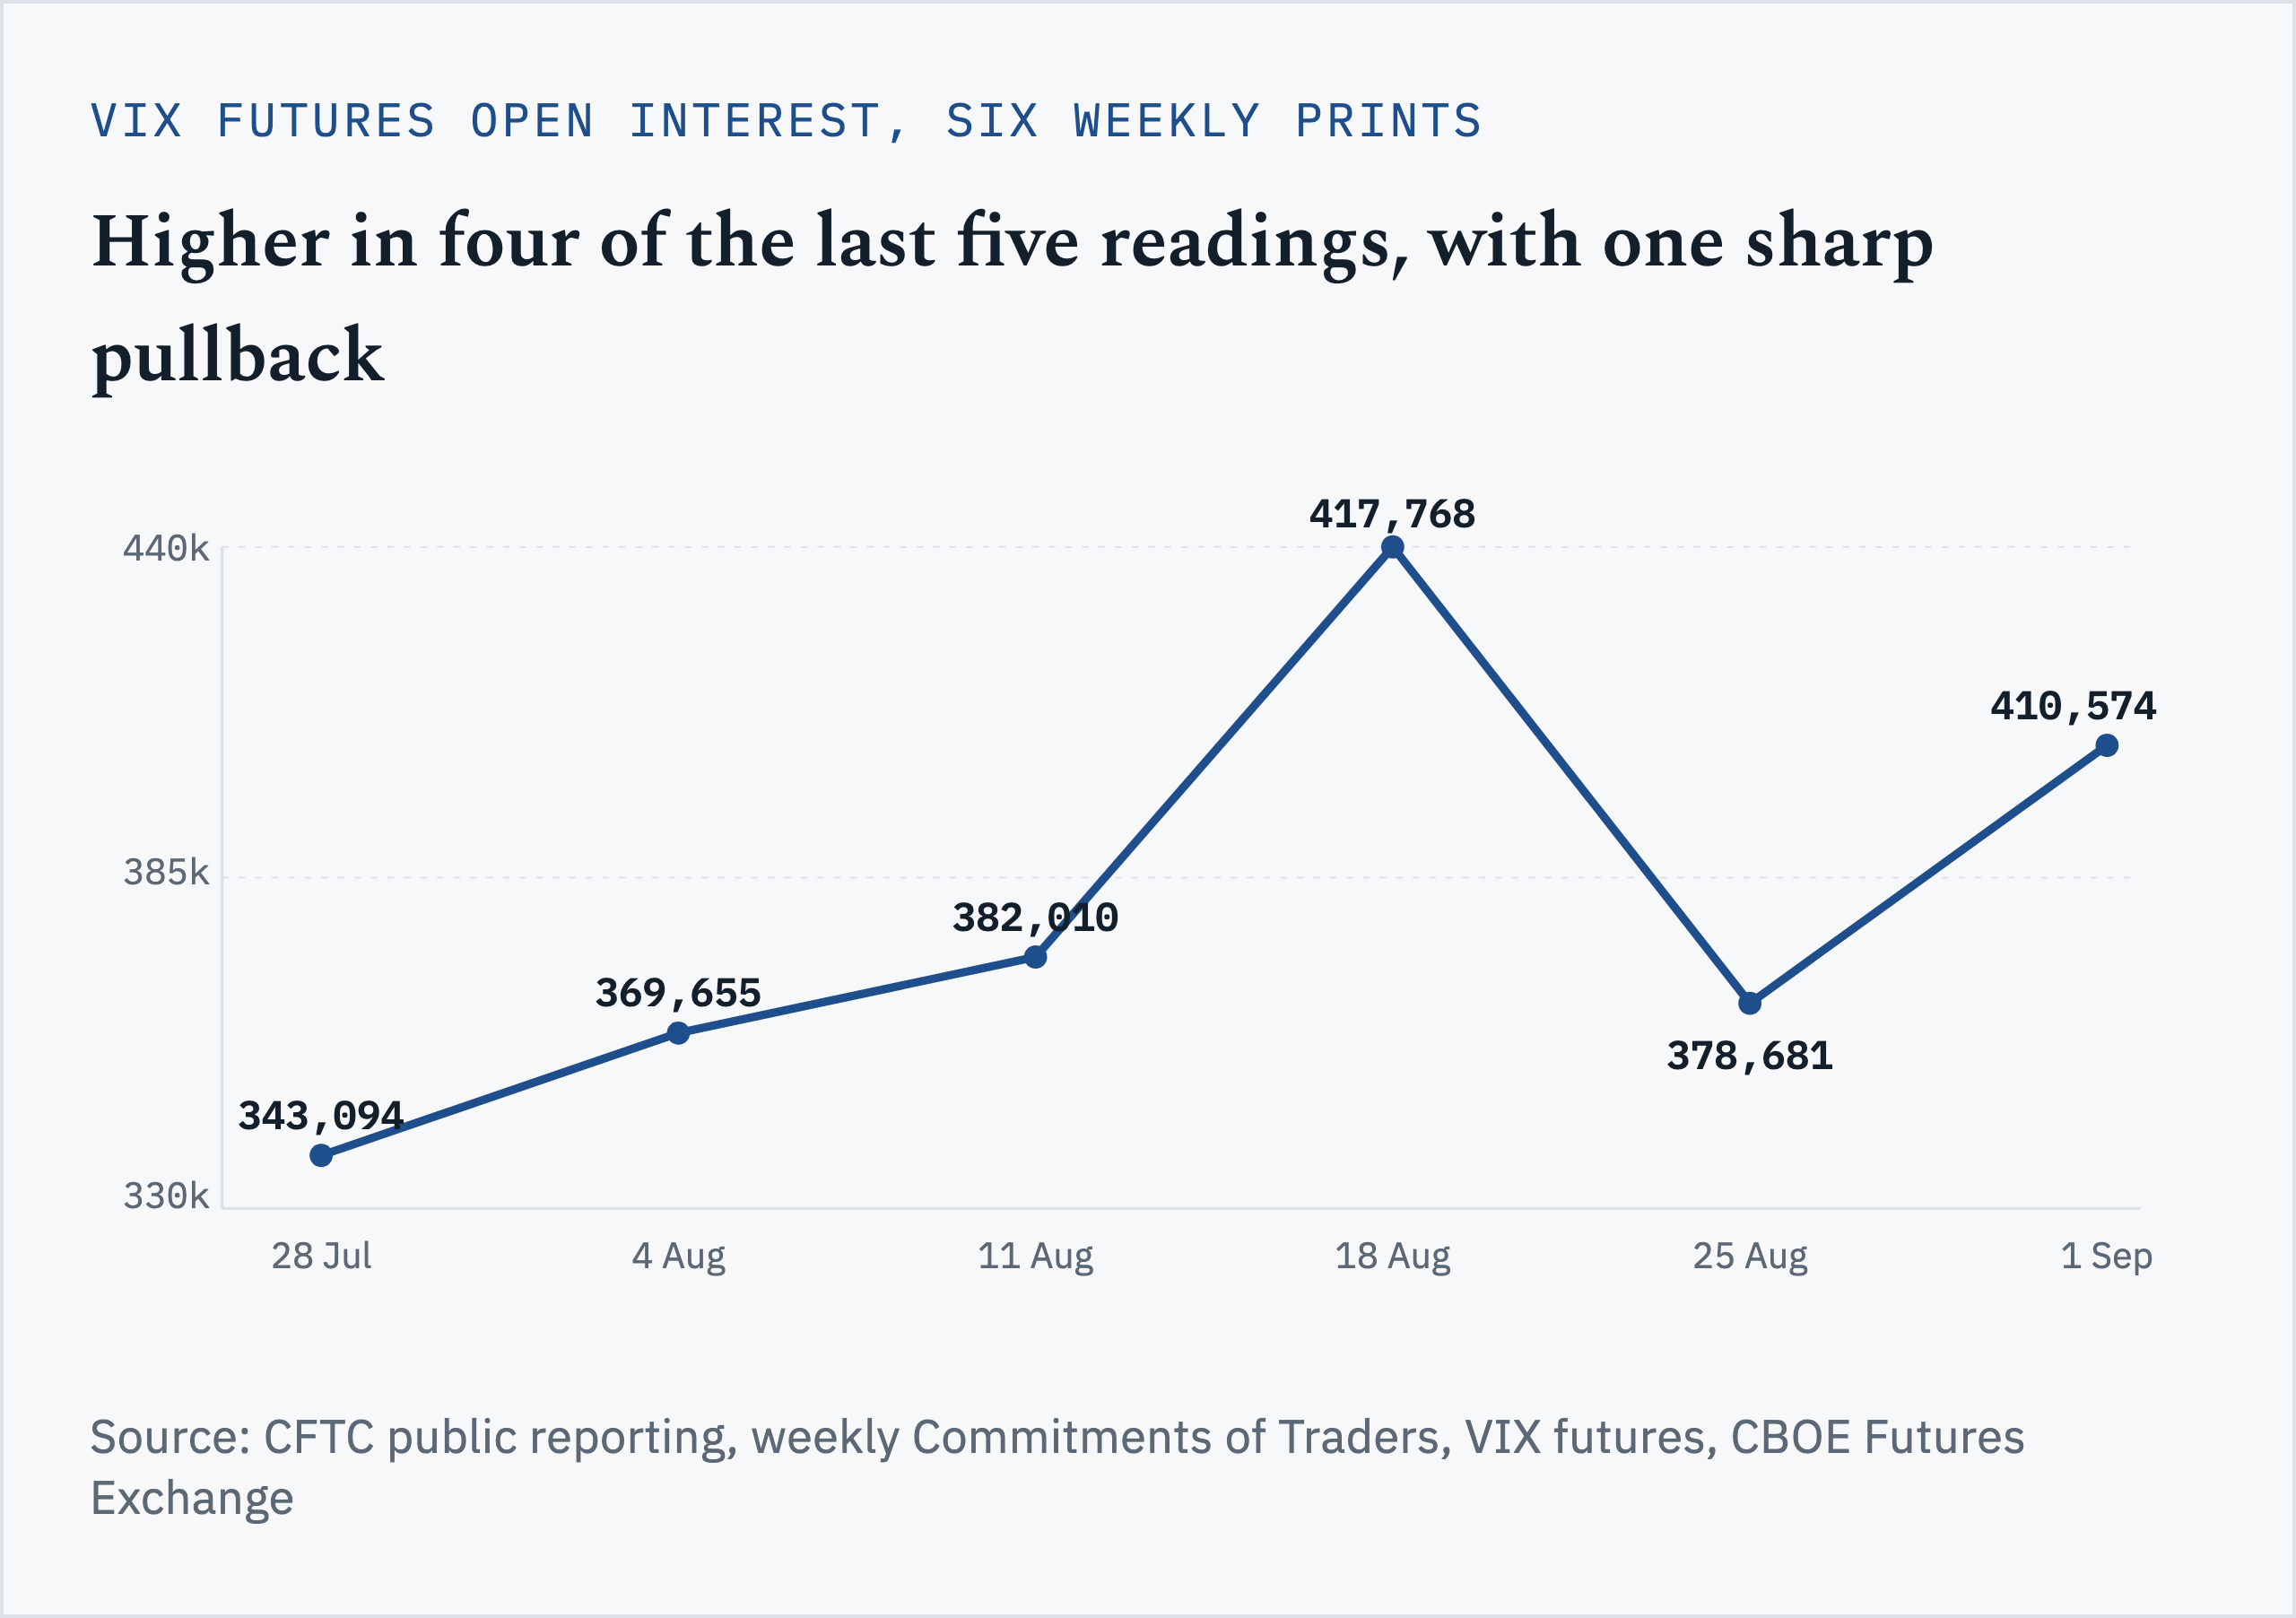
A positioning extreme sitting under a complacency priced index is the exact signature of the last two vol events this severe. The size of the coming shock doesn’t worry me much. What a shock of ordinary size does when it lands on a structurally short vanna book does.

The mechanism: why dealers are structurally short vanna

Start with why dealers carry this position at all. Their own client flow hands it to them. Garleanu, Pedersen and Poteshman’s 2009 study documents that end users, mostly institutions buying downside protection, hold a persistent net long position in S&P 500 index puts. Every long put an institution buys sits as a short put on a dealer’s book. Dealers cannot fully offset that inventory when the market structurally wants more protection than anyone wants to sell. Somebody always holds the other side.

A short put position is short vanna. Here is the plain version. Vanna tells you how much an option’s delta, its sensitivity to the underlying, moves when implied volatility moves. A dealer short vanna, watching volatility rise at the same moment the index falls (the well documented negative correlation between spot and vol, sometimes called the leverage effect), sees a hedge requirement that grows in the same direction as the price move. That is the whole mechanism. A hedge that grows toward the move does not slow it down. It adds fuel.

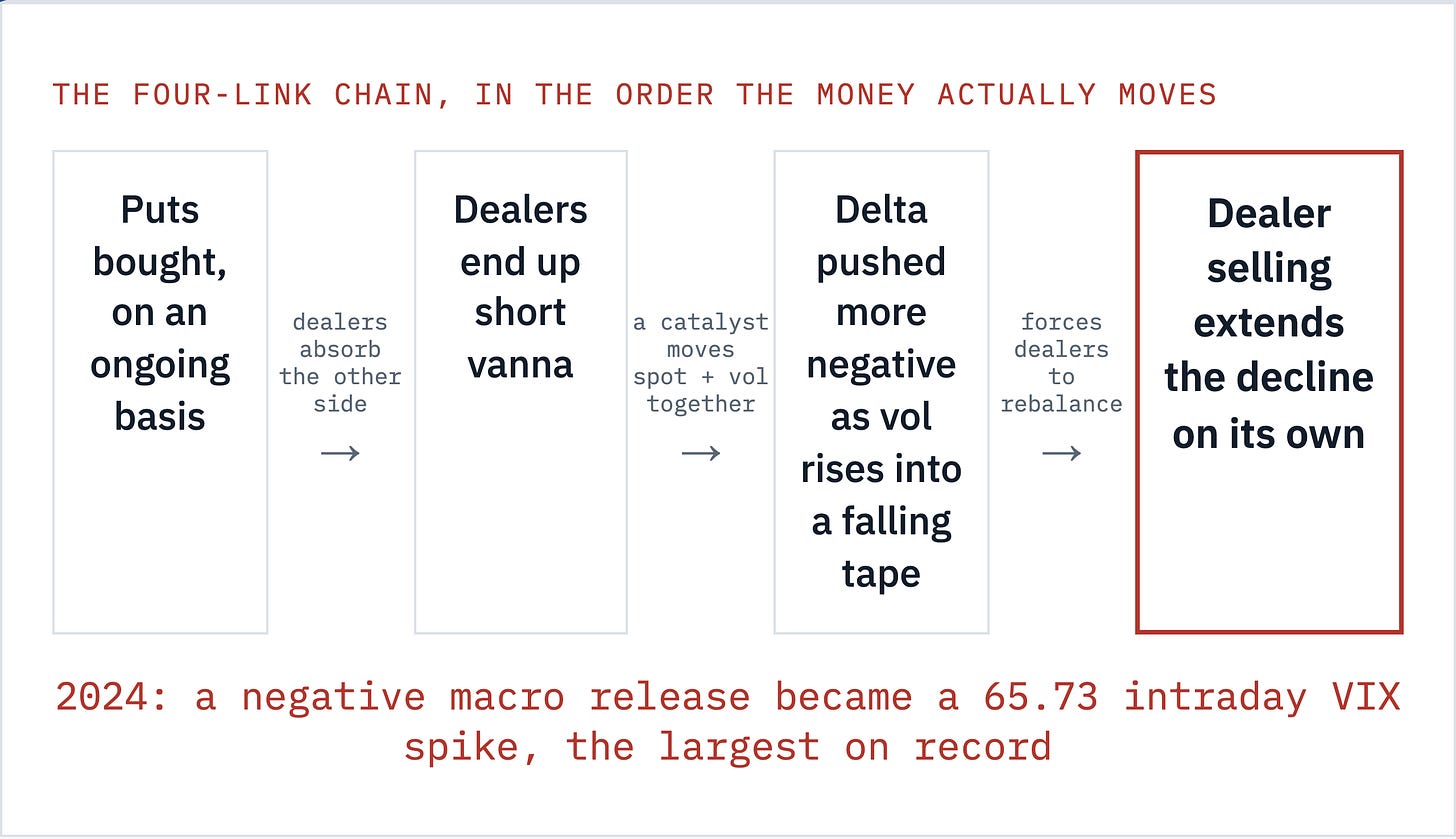
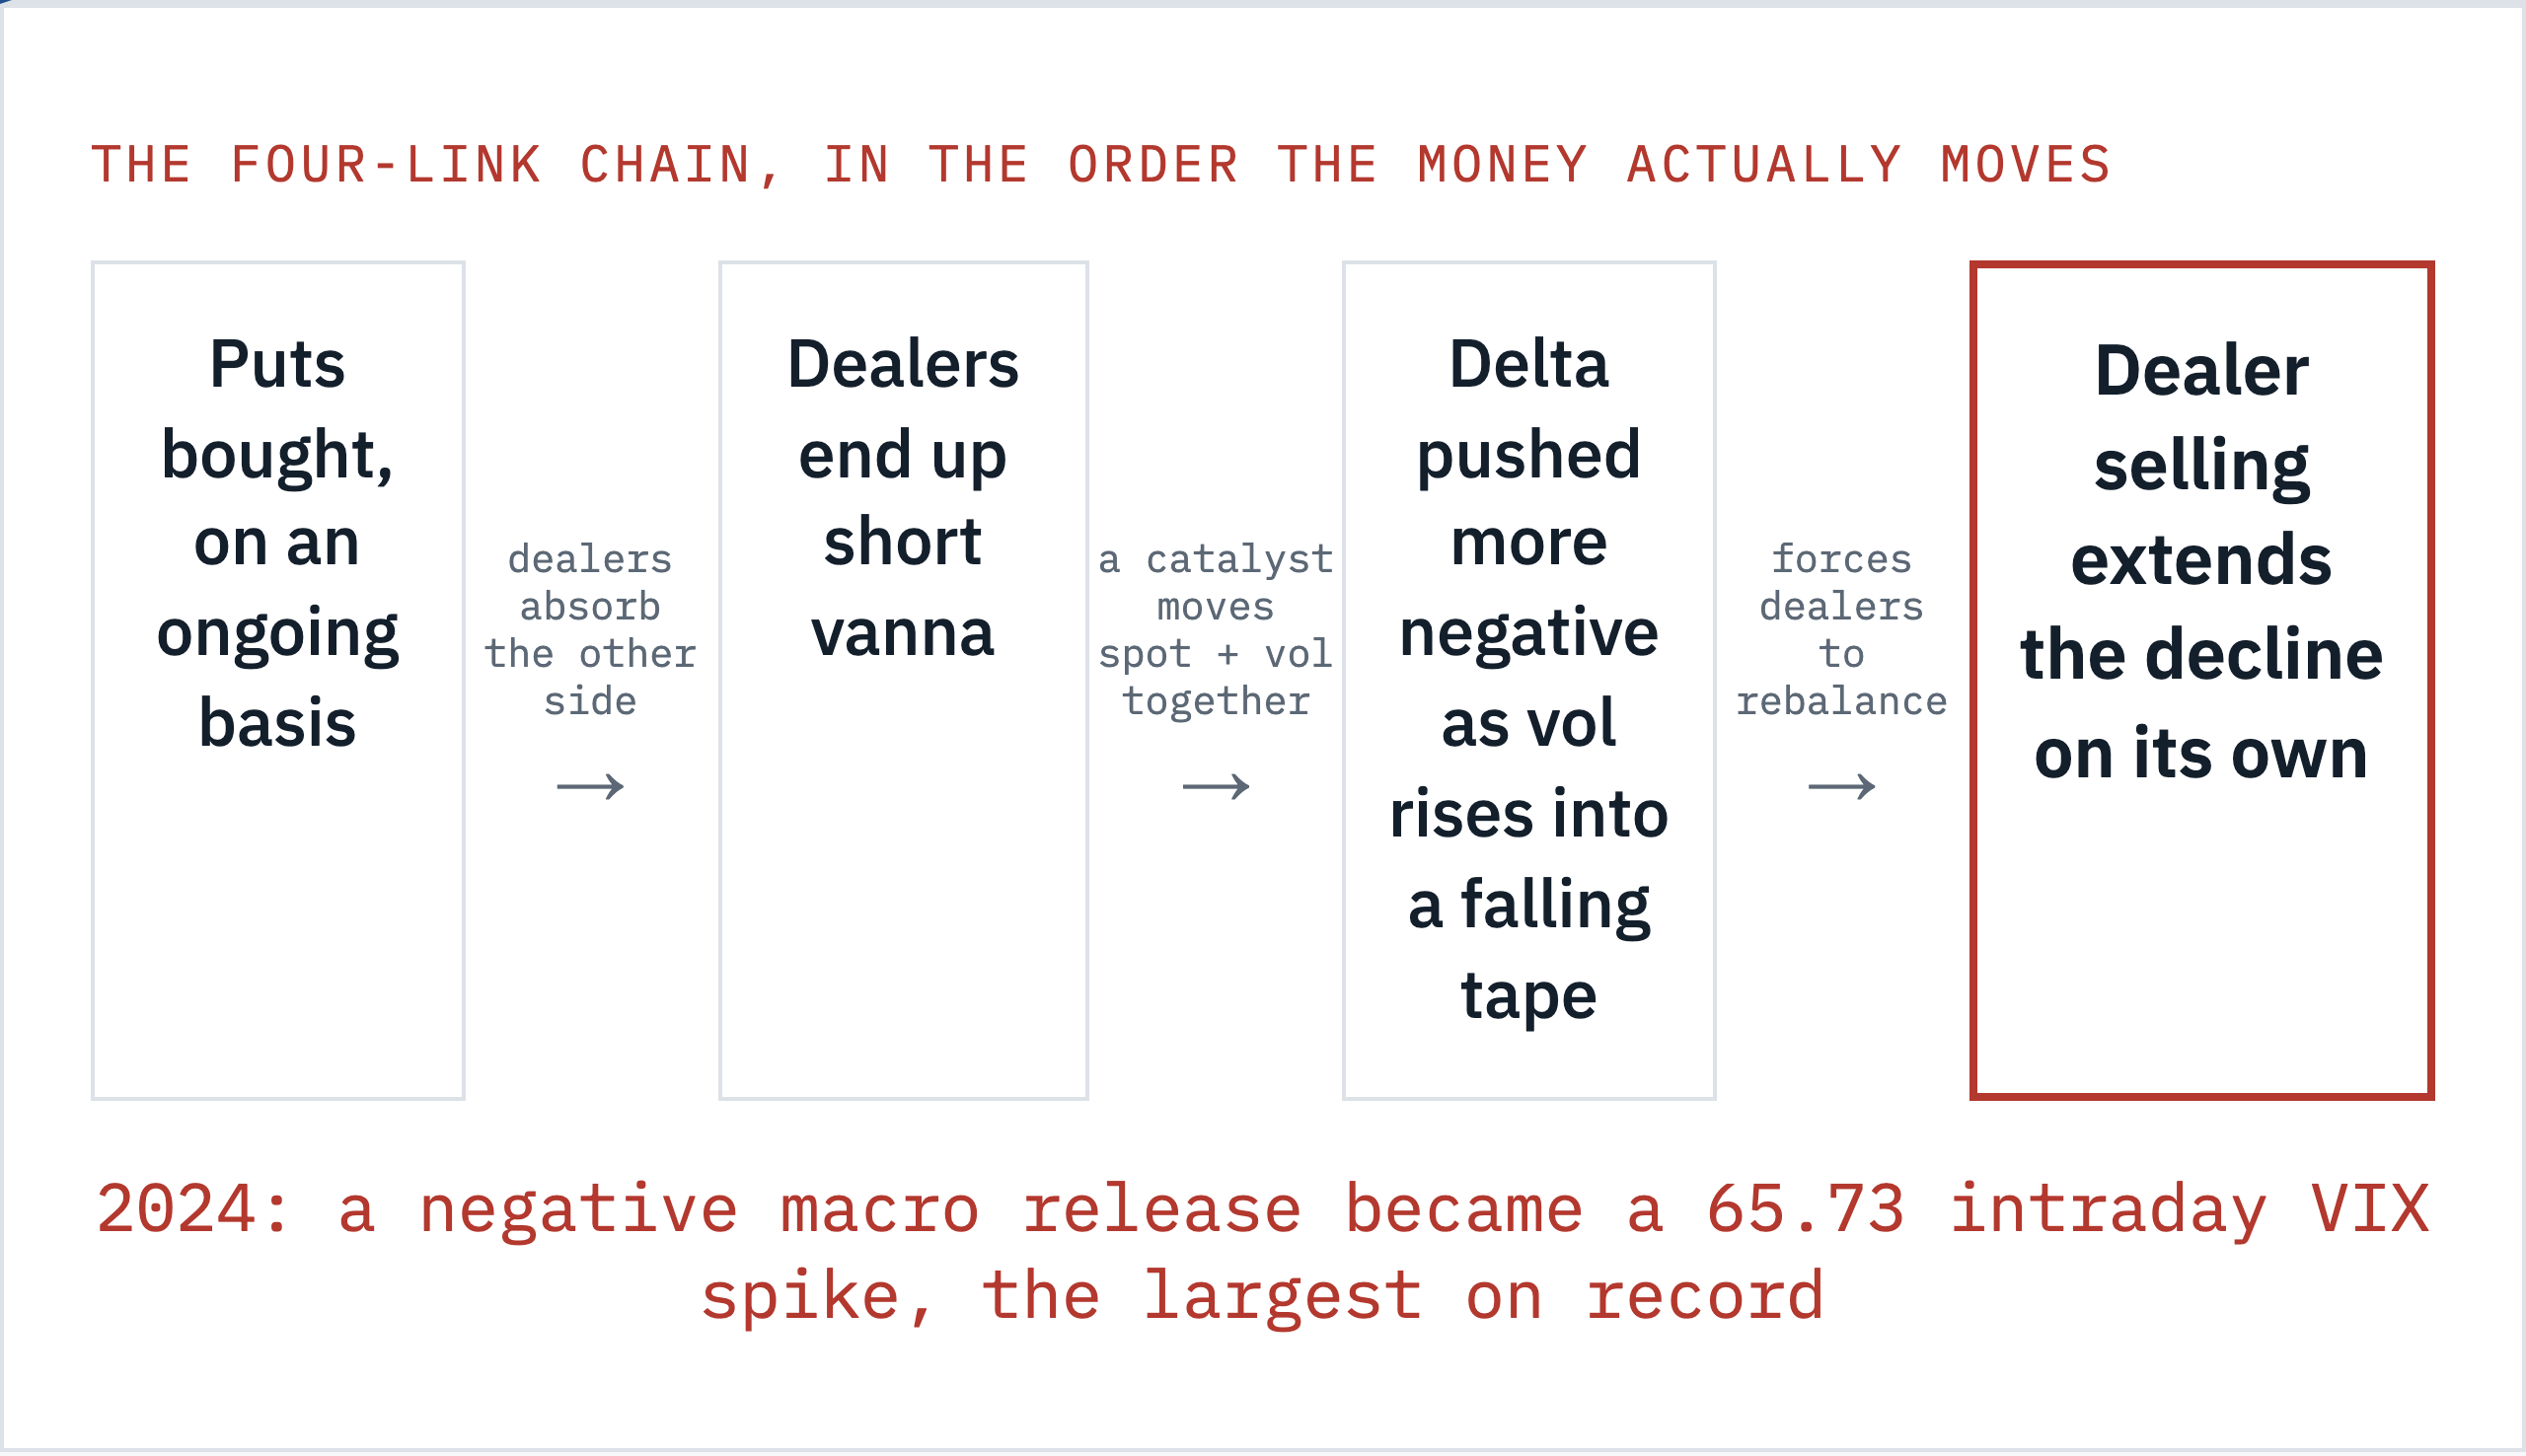
The causal chain deserves to be stated as a chain, because a compressed version of this is where most writing on the subject loses the reader. Four links, in the order the money actually moves.

  1. Institutions buy downside protection continuously. Dealers absorb the resulting short put inventory because somebody has to take the other side. That inventory is structurally short vanna. Ordinary flow, permanent position.

  2. A macro catalyst, here a BOJ decision priced in but still carrying surprise risk on magnitude and language, moves spot and implied vol together. This is the trigger, and it is not the cause. It’s the weather, never the fault line.

  3. As vol rises into a falling tape, the dealer’s negative vanna position pushes the short put book’s effective delta further negative. The dealer needs more short exposure, or less long exposure, to stay hedged. The hedge moves with the pain.

  4. The dealer sells into the decline to rebalance. That selling is a new market input the original catalyst never generated on its own. It is what turns a jobs report miss into a 42 point premarket VIX spike. Four links, one spring.
Every vol analytics shop that publishes on dealer flow, from SpotGamma’s gamma exposure work to the practitioner literature on charm and vanna more broadly, describes negative gamma and vanna positioning the same way. It makes hedging procyclical: dealers sell into weakness and buy into strength. That is amplification, stated plainly, and it is consensus among the practitioners who watch this for a living. Nobody outside the dealer desks can measure precisely how loaded the spring sits right now. That part remains a genuine unknown. Risk.net’s reporting puts it at a two year high. It stays unmeasurable from here.

The coverage has undersold one point worth adding. The BIS’s own postmortem on August 2024 attributes the amplification to procyclical deleveraging in the yen carry trade, roughly ¥40 trillion, about $250 billion, of on and off balance sheet positioning unwound inside days (BIS Bulletin 90), a figure the BIS itself flags as biased down by gaps in the underlying data, so the real unwind was probably larger than the headline number. Understated by the source’s own admission. That is a real and separate channel from options vanna, probably the larger dollar amount in motion. The two channels do not compete for the same explanation. They run in sequence: the carry unwind sells yen and the assets funded by it, that selling shows up in equity indices, and the equity move is what then meets whatever vanna position dealers are carrying. Both channels were loaded at once in 2024. My read is that two loaded channels together made that spike historic.

The discriminator: what convexity predicts that a proportional read cannot

I want to name a third explanation head on before laying out the test, because it comes from the same BIS research team and this piece would be dishonest to skip it. A separate BIS bulletin on the VIX print itself, covering the same event, attributes the spike’s extraordinary size mainly to a mechanical artifact: bid ask spreads on out of the money puts widened asymmetrically as dealers repriced in illiquid pre market conditions. The BIS calls that quote construction effect the main driver, and states that VIX ETFs and dispersion trades were unlikely to be central. Hedging-driven selling in the underlying is a separate mechanism this piece has to reckon with, on that reading. Same event, two named causes.

My own read treats it as a complement to the vanna story. A dealer who is short vanna and watching volatility rise into a falling tape has every reason to widen the quotes on exactly the puts this piece is about, precisely because rehedging them is getting more expensive by the minute. The widened spread and the hedging flow both describe the same short vanna dealer under stress. One dealer, two symptoms. I flag the distinction because a reader who opens BIS’s own VIX-mechanics bulletin deserves to see this piece answer it directly.

Here’s the honest rival explanation, and it fits most of the same facts. Any BOJ meeting with a live hike on the table produces a genuine macro shock if the outcome or the language surprises, no vanna story required. On this reading, September 18 moves markets roughly in proportion to how far the actual decision departs from the priced outcome. Current options positioning changes nothing about that proportionality. This is also where September’s own seasonal pattern lives: equities drift lower and the VIX drifts higher most years in this window with nothing structural behind it, so a rival explanation doesn’t even need the BOJ to do the work alone. The calendar alone could do it.

The two stories split on convexity, and here is the number behind that shape. If the rival explanation is right, a small surprise produces a small move and a large surprise produces a large one, close to linear: a hawkish tone only surprise with no change to the hike itself should move the VIX by roughly what a comparable non event central bank meeting moves it, which historically sits under a point either way. If the vanna story is right, that same modest surprise produces a move I’d put at several points, because dealer hedging flow adds energy the original catalyst never carried. That’s the BIS’s own documented signature for August 2024: the trigger was “a negative macro release” (BIS Bulletin 90), not a crisis scale shock, and the output was the largest VIX spike on record (BIS Bulletin 95). Small input, extreme output, is the vanna story’s fingerprint. Proportional input and output is the rival’s. That’s the whole test.

I’ll flag the one fact that complicates my own case. The BOJ’s hike prices in the 80s percent by most trackers, not 60% or 70%. A market already this confident has less room to be surprised than the market did heading into 2024’s jobs report, which nobody treated as a coin flip either, but which wasn’t priced this high. If this meeting is discounted this fully, the convexity channel has a thinner trigger to work with. I can’t rule that out. Less room, not none.

Four limits: no dealer book, thin positioning data, high pricing, and the seasonal base rate

Four confounds, named before a reader who trades this finds them alone.

I do not have a dealer’s book. Risk.net’s report is the primary evidence for the two year superlative. I cannot independently verify a bank’s aggregate vanna position from public data. What I have verified myself is the surrounding context: the VIX starting level and the options open interest. The specific claim about which direction dealers are positioned rests entirely on Risk.net’s sourcing. That’s the honest gap.

The positioning data I can check sits one step away from the real thing, and it reads as mixed. CFTC data on VIX futures splits large speculators from commercial hedgers, and neither maps cleanly onto “options dealers short vanna.” Non-commercial, leveraged fund, net short positioning grew from 63,413 to 84,185 contracts over the same five weeks, up 32.8% (CFTC Commitments of Traders). That is a crowded short volatility trade that would itself need covering into a spike. A crowded trade needs a door.

Commercial net long positioning grew too, from 67,389 to 79,343 contracts, up 17.7% (same CFTC series), which points the direction Risk.net’s report does, hedgers adding protection. But “commercial” in this dataset is a broader hedger category than options market makers specifically. Both series corroborate that something is building. Neither one is the dealer book itself. Adjacent evidence, not proof.

Pricing in the 80s percent still cuts against the setup, just less than a near certain print would. A hike this heavily discounted leaves less room for the kind of surprise that historically triggers the convexity channel than a genuine coin flip meeting would. If Ueda delivers exactly what is priced, in exactly the language the market expects, the mechanism above may find nothing to bite on this cycle. The flip level stays theoretical until the next live catalyst. High pricing, thinner trigger.

September is seasonally the weakest month for US equities, and the VIX seasonally climbs through it, independent of anything structural. That base rate has to be subtracted first, or a move on the 18th gets credited to this piece’s thesis when the calendar earned it. The discriminator above, small surprise against move size, is exactly the tool for that subtraction: a seasonal drift shows up as a small, roughly proportional move; the vanna channel activating shows up as a move too large for the surprise that caused it. I lean on that test precisely because the seasonal confound is real and I cannot wave it away with a caveat alone. The calendar owes this thesis nothing.

What would change this view

This is dated and specific. The BOJ decides on 18 September 2026. I’m wrong if the hike lands as priced, the language reads neutral, and the VIX stays inside its ordinary post meeting range, itself modest given how routine a fully priced hike from a well telegraphed central bank normally is.

I’d count the thesis confirmed if two things happen together. First, the VIX move on the day beats a concrete bar: more than three points on a hike that lands within the range already priced, with language scored no worse than mildly hawkish. A comparable non event BOJ meeting historically moves the VIX under a point; three plus on an outcome this well telegraphed is the disproportion the whole piece is staked on. Three points confirms it. Under two kills it. Second, futures open interest or options volume data in the days after shows dealer side hedging flow sitting behind the move, on top of whatever directional speculation is already there. A big move driven by legitimately bad news, a genuine hike surprise or a language shock nobody priced, would be the rival explanation working correctly. A three point plus move on news this anticipated would be the vanna story.

One earlier tell is worth watching. If positioning data, from further reporting or from the public options flow proxies I can access, shows dealers normalizing their book in the two weeks before the 18th, that’s the spring unloading before the trigger. It kills my case regardless of what happens on the day. The spring can unload without a headline.

What I’d actually do with this

If you’re running a book into September 18, the actionable read is more careful than “buy VIX calls because a spike is coming.” I don’t know that a spike is coming, and no honest reading of this setup does either. The actionable read is that the distribution of outcomes carries a fatter tail than a hike priced in the 80s percent would normally suggest, because the mechanism that turns an ordinary surprise into an extraordinary move sits more loaded than it has in two years. That argues for cheap convexity. It doesn’t argue for conviction.

Structurally, the trade lives in the shape of the exposure. A position that’s cheap if the meeting is a non event and pays off disproportionately if the vanna channel activates is a different construction from a directional bet on a hike or a pause, and it’s the one the setup above actually supports. It buys optionality cheaply. I work through the specific sizing, the two scenario BOJ playbook, and the exact SKEW versus VIX threshold I’d want to see before standing down, below the line.

For the actual position, priced and sized against this exact mechanism, entry, a numeric stop at VIX 13.80, and the profit target, that trade ticket is a separate note on Patreon: The BOJ’s September 18 Decision, priced and sized.

On capacity, this is not a crowded trade in the way a popular factor strategy gets crowded. VIX options and futures carry real depth, 410,574 contracts of open interest as of 1 September alone, and a dated convexity position sized in the low millions clears that market without moving it. The constraint that actually binds is timing. Everyone watching the same BOJ calendar reaches for the same cheap convexity in the same window, so the edge decays as the meeting approaches and the market prices in the crowd rather than the event. Timing is the real constraint here. I would rather be early and wrong on timing than late and paying up for insurance everyone else already bought.

Every falsifier above resolves inside two weeks of publication. I’ll check it against the tape myself. I’d rather be wrong in public on a dated call than vague in a way nobody can hold me to.

So here’s the question I’d put to anyone running vol risk into this meeting. If a fully priced central bank decision can still convexly reprice the whole equity complex through dealer hedging alone, at what point does “priced in” stop meaning anything for how you size the tail?

Below the line: the flip level, the playbook, the stand down signal

This piece is complete on its own. The claim, the mechanism, the discriminator against the rival explanation, and the dated falsifier all sit above. Nothing was held back to make the free version incomplete.

The paid section below works the arithmetic I’ve been referencing: the specific flip level calculation, the two scenario BOJ playbook sized against it, and the SKEW versus VIX gauge with the reading that would make me stand down. It’s written the way I’d actually size the position, in the register a desk uses to put money behind a view.

The Decision-Grade Version

The core thesis and its falsifier sit entirely above this line. Nothing here was held back to sell the next step.

The Patreon note is a separate piece of work rather than a deeper cut of this article. It takes one trade from inside this story, i.e. a sized VIX call structure into the BOJ’s 18 September decision, with an entry, a numeric stop, and a profit target, and writes it the way a desk would act on it: the position, the levels, the sizing, and the risk that would take it off. Written for people who put capital behind a view.

→ Read the BOJ decision trade note

→ Or join the Patreon community for every note

For related mechanism work: how funds actually profited when August 2024’s VIX spike hit, and where the VIX’s own formula creates a blind spot dealers have to hedge around.

Elsewhere: YouTube for the video breakdowns, and LinkedIn for the shorter reads.

Below: the flip level (vanna near -1.40), the two scenario BOJ playbook, and my SKEW stand down number.

User's avatar

Continue reading this post for free, courtesy of Navnoor Bawa.

Or purchase a paid subscription.
© 2026 Navnoor Bawa · Privacy ∙ Terms ∙ Collection notice
Start your SubstackGet the app
Substack is the home for great culture