



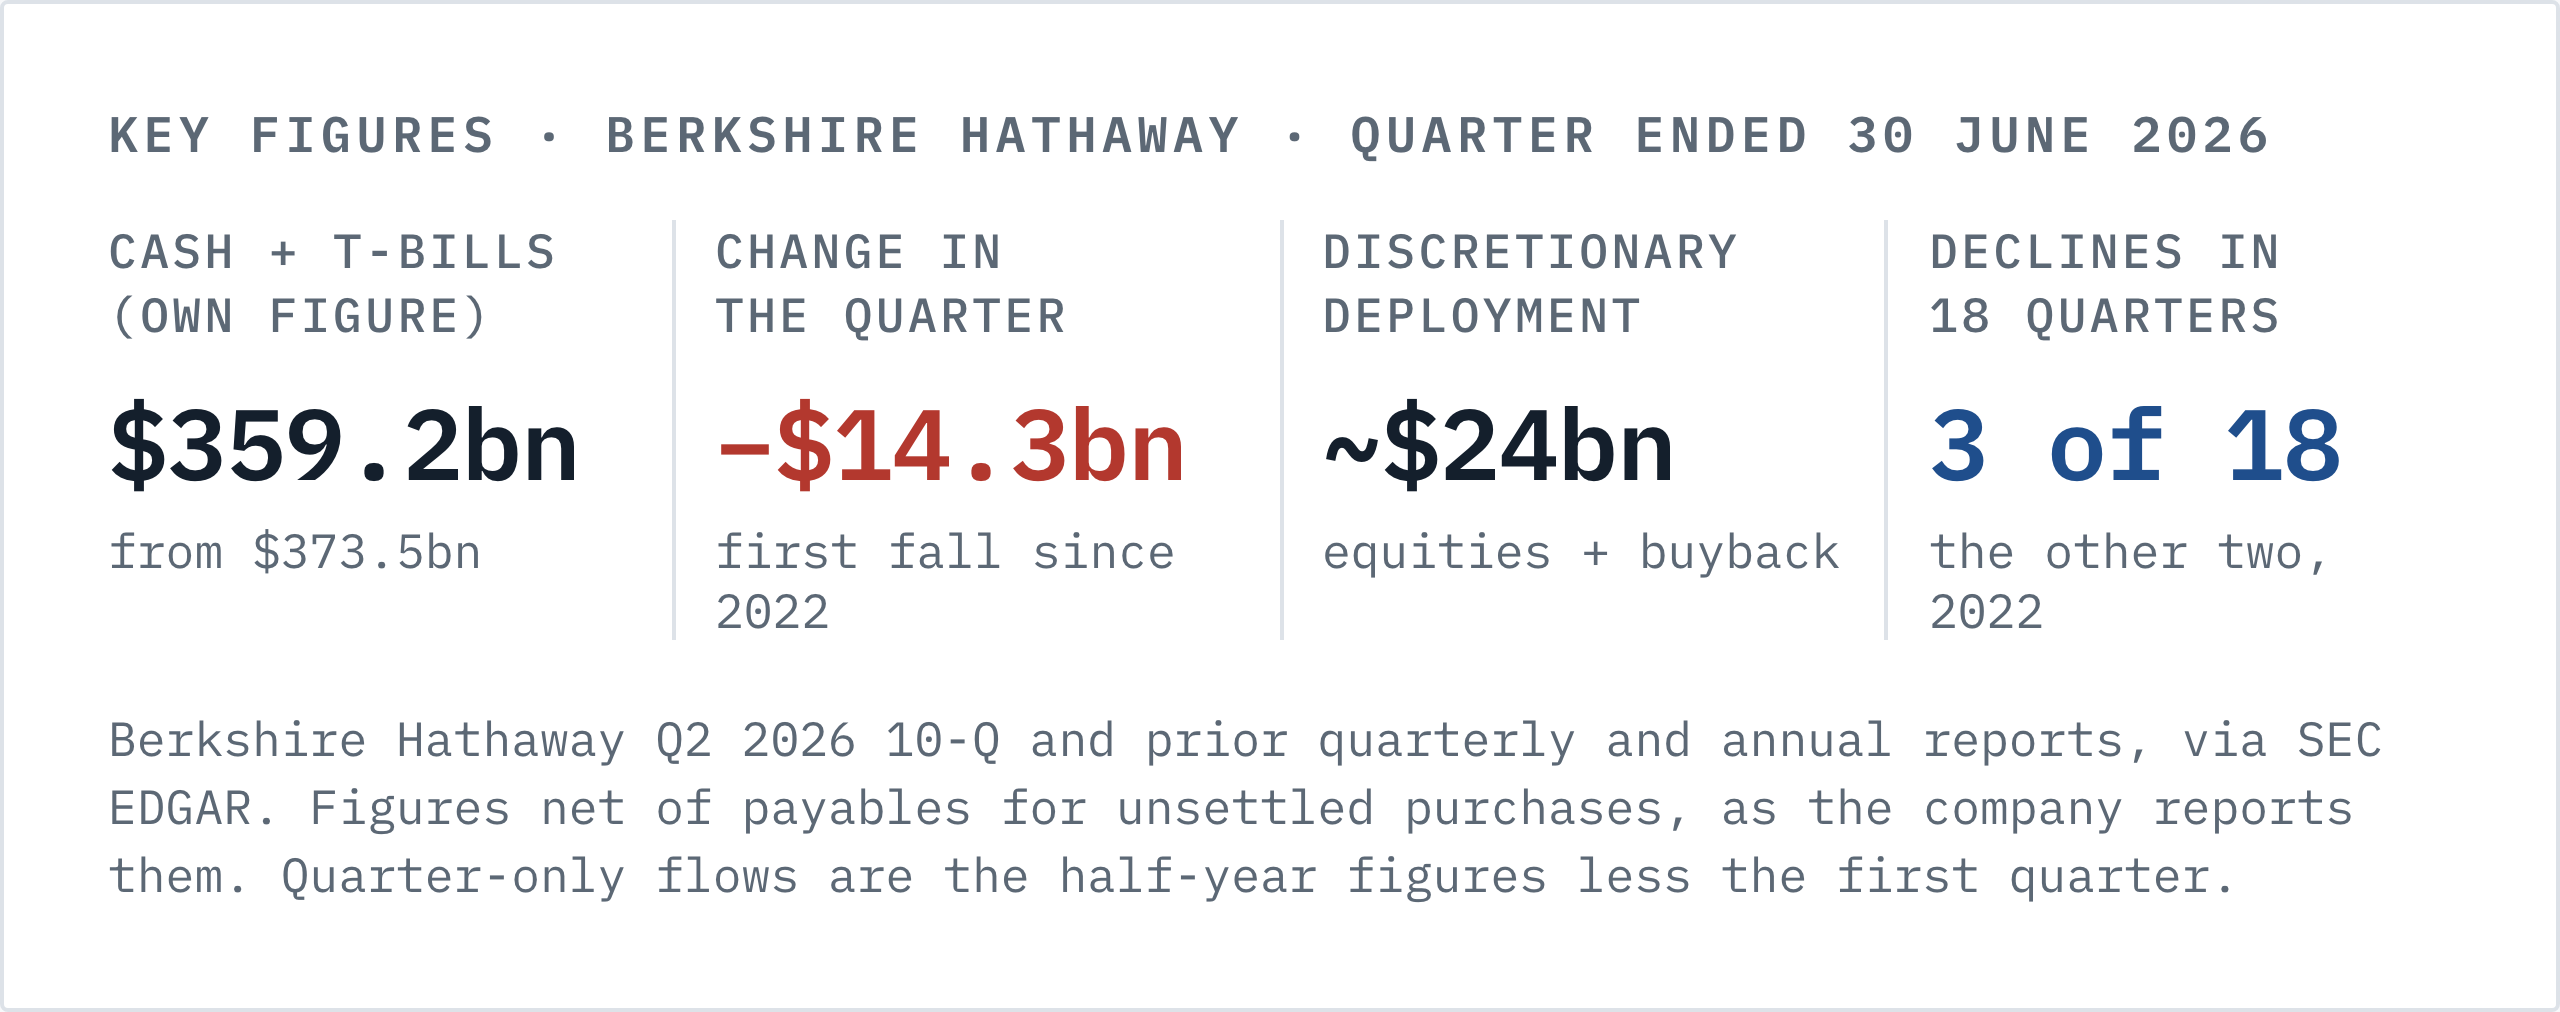
Berkshire Hathaway’s cash and Treasury bills fell to $359.2 billion at the end of June, from $373.5 billion three months earlier. That is the first decline since 2022 and the largest since the first quarter of that year. It is also the third decline in eighteen quarters, so the interesting question is what it took.
It took about $24 billion. Net purchases of equities ran $19.8 billion in the quarter, after the book handed $8.1 billion back to the pile in the three months before. The buyback went from $235 million to roughly $4.2 billion. Both of those are Abel’s, and both are new.
I had put the break-even at $14.5 billion a quarter, from Berkshire’s own inflows. This quarter cleared it by about nine billion, and the pile moved almost exactly as that arithmetic said it would. What I want you to keep is not the fall. It is the measure the fall has to be read on, because the widely quoted series and the company’s own series disagree about direction in two of the last six quarters, and one of them will be wrong about this one too.
I also made this as a film. It does the one thing text can’t: the adjustment is worked on screen, line by line, so you watch the published figure become the real one instead of taking my word for it.
Eighteen quarters, three declines, and the third one is his
Here’s Berkshire’s own figure, the one it prints in Management’s Discussion and Analysis, net of payables for unsettled purchases. I pulled it from every quarterly and annual report back to 2021.
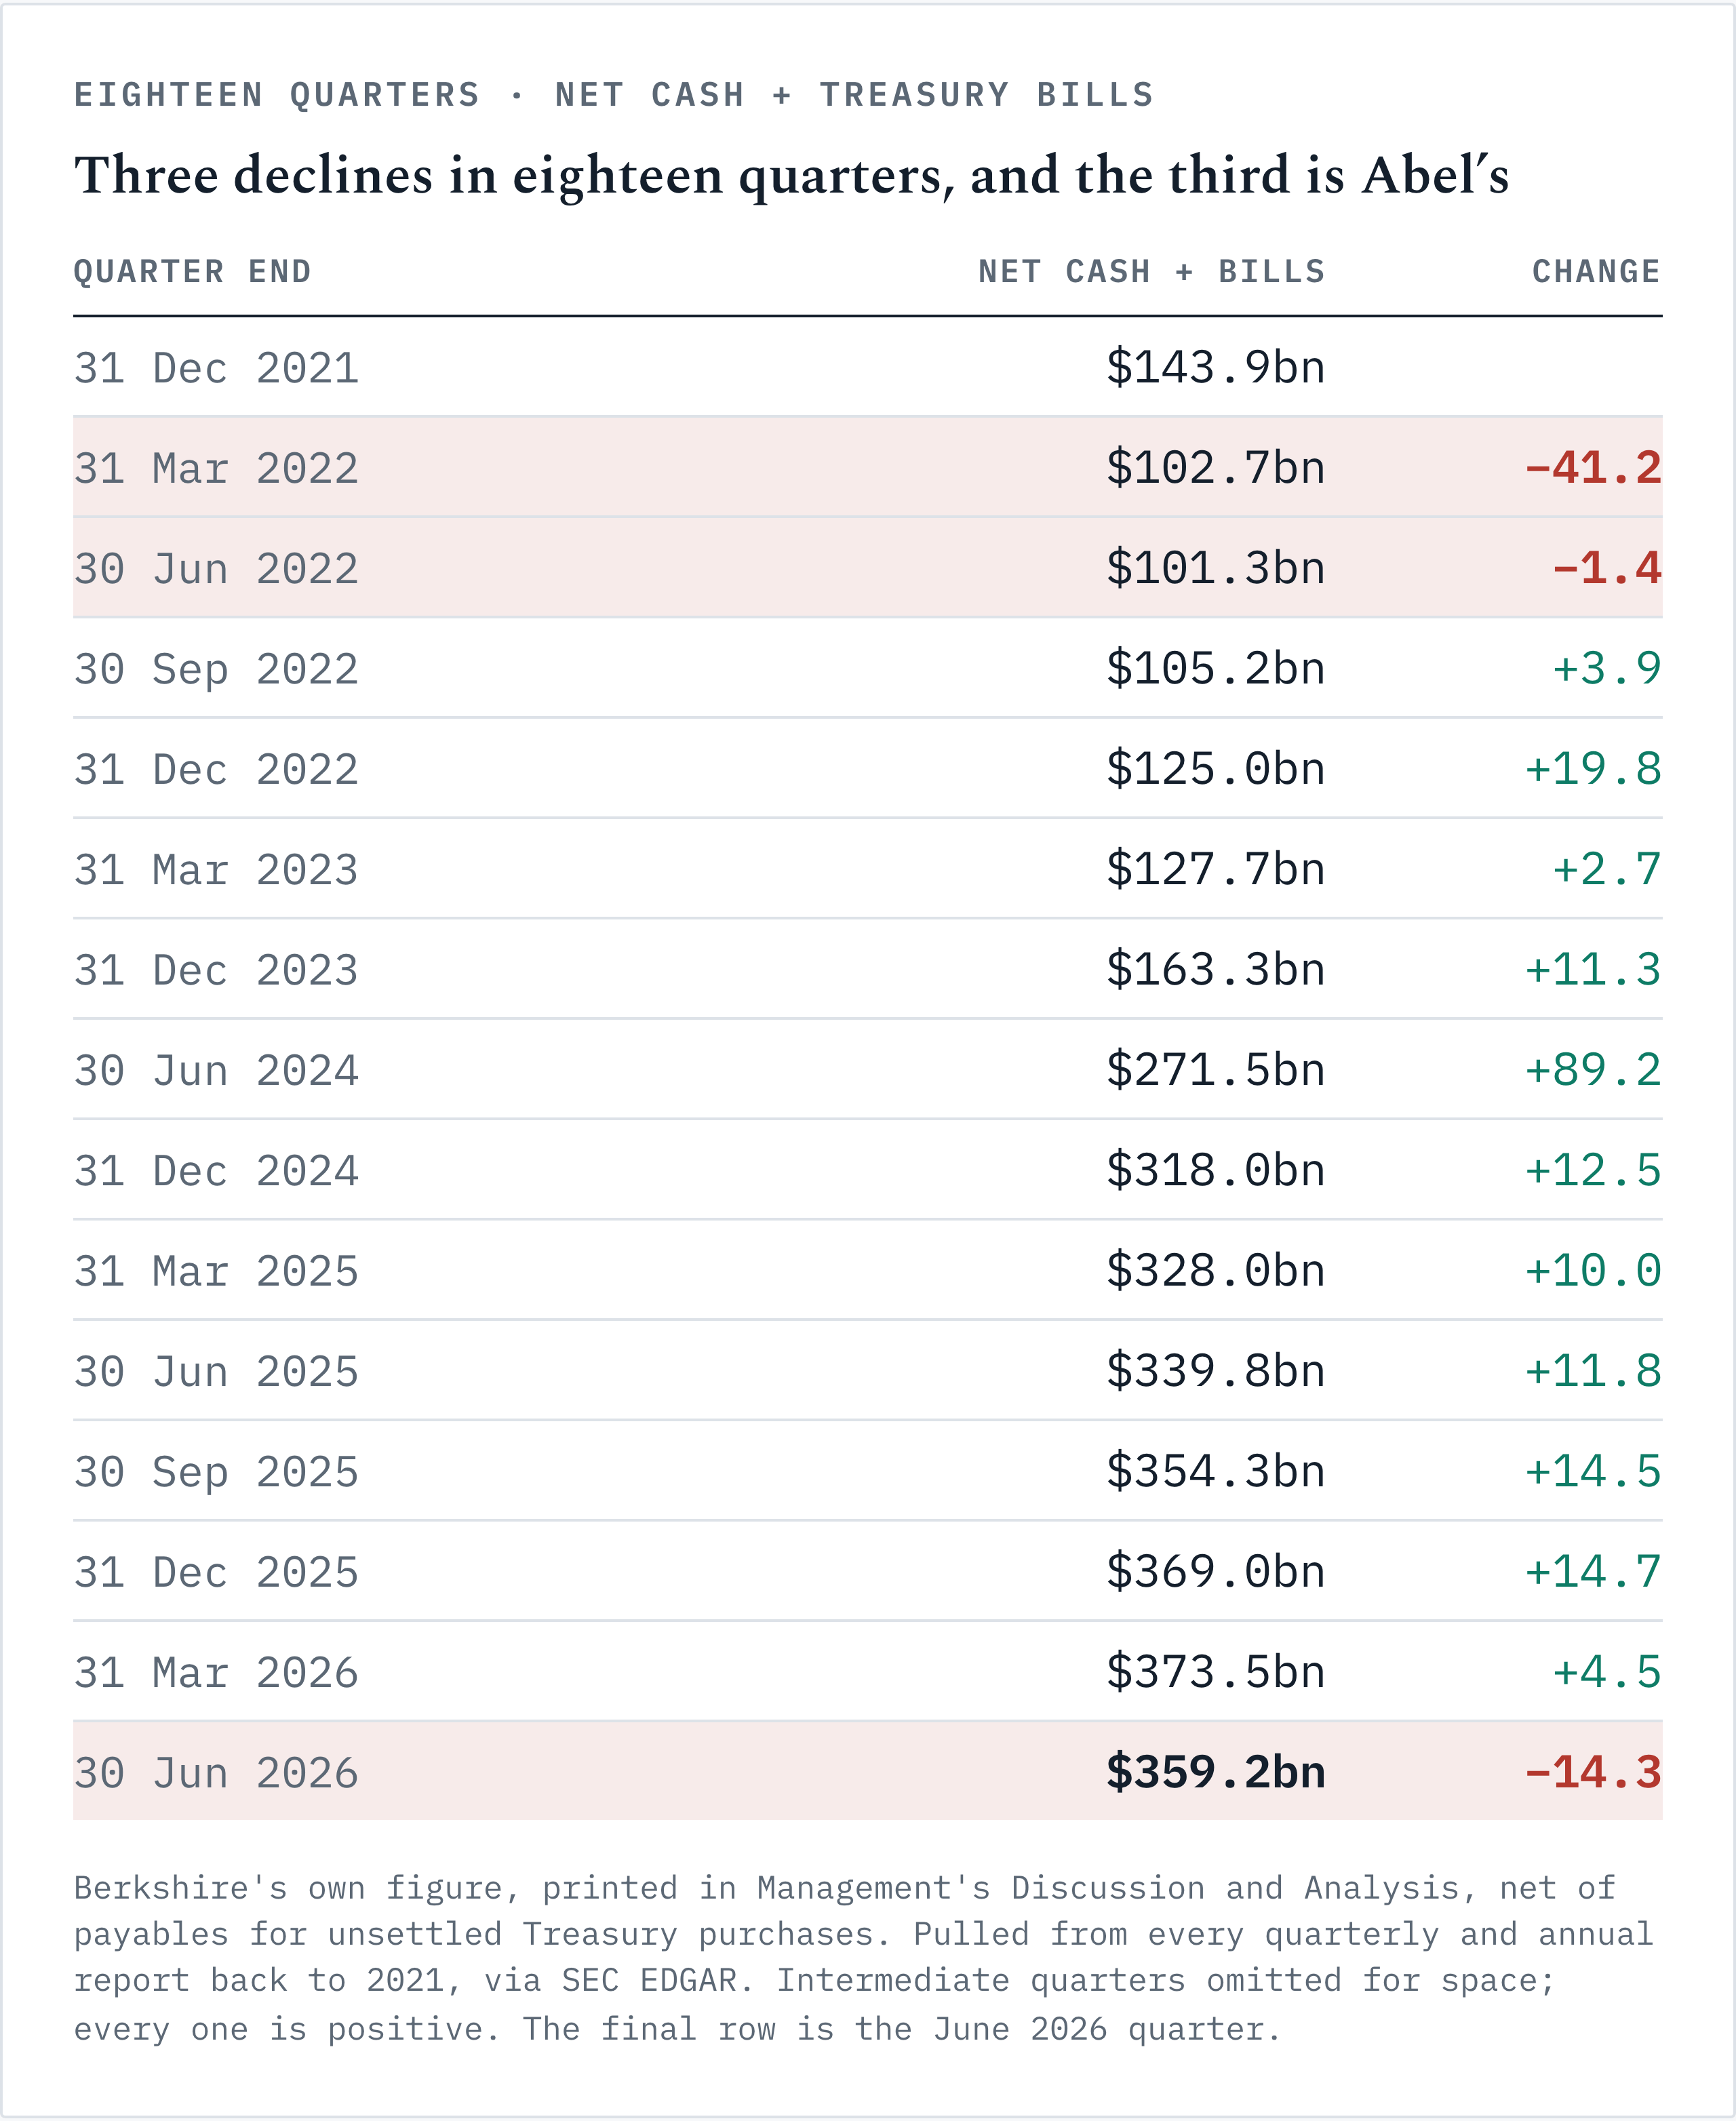
Intermediate quarters are omitted for space and every one of them is positive. Three declines in eighteen quarters, and the two before this one were both in 2022.
That matters for how much weight the June quarter carries. A single fall in a series that only falls when something large happens is not noise, and it does not need a significance test to be interesting. Abel’s first quarter, at +$4.5 billion, sat 0.72 standard deviations below the trailing twelve on my own calculation, which is nothing. This one is a different kind of event.
What he actually spent: $24 billion in thirteen weeks
The June 10-Q reports six months, so the quarter has to be backed out of it. Half-year operating cash flow was $21,653 million against $10,438 million in the first quarter, so the June quarter produced about $11.2 billion. Half-year equity purchases were $39,405 million and sales $27,780 million.
Take the first quarter off both. Purchases of $23.5 billion against sales of $3.7 billion, so the equity book absorbed $19.8 billion of cash in three months. Three months earlier that same book returned $8.1 billion. That is a swing of roughly $28 billion in one quarter, and it is the largest single change in this company’s behaviour that I can find in the Abel era.
Berkshire’s own stock moved the same way. Berkshire “acquired $4.8 billion of treasury stock in the first six months of 2026, most of which was in the second quarter,” and the cash flow statement carries $4,444 million for the half against $235 million in the first quarter. So the June quarter bought back something close to $4.2 billion of its own stock, against $235 million in the quarter before it. Eighteen times.
Add the two and I make discretionary deployment about $24 billion. Against a break-even near $14.5 billion, that is roughly $9.5 billion of genuine drawdown, and the pile fell $14.3 billion. The gap between those two figures is capex, debt and the accretion I set out below, and it is close enough that the arithmetic holds.
What a real spend down costs: $51.1 billion in three months
I keep going back to 2022, because it is the only larger decline Berkshire has produced in the era of a giant bill book.
In the first quarter of 2022 it bought $51,119 million of equity securities and sold $9,724 million. That’s $41.4 billion of net buying in thirteen weeks, into Occidental, Chevron and the Alleghany agreement. Net cash fell $41.2 billion over the same quarter. Almost exactly a dollar off the pile for each dollar of stock bought.
June 2026 is the same shape at about a third of the size. $19.8 billion of net buying, $14.3 billion off the pile. The ratio is looser because the buyback and a bigger operating inflow both sit inside it, but the mechanism is identical: this balance sheet moves when the equity book moves, and it moves by roughly what the equity book absorbs.
What 2022 says about willingness is unchanged. The pile stood at $143.9 billion then and Berkshire moved 29% of it in thirteen weeks, which tells me the machinery works and the constraint has never been operational. What it also showed was a trigger: an energy complex on mid cycle multiples, an insurer available whole, and a market falling. I could not see any of those three in March. I still can’t, which makes the June quarter harder to explain by conditions and easier to explain by the person.
The $17.2 billion line that moves the published number
Two series are in circulation and only one of them is Berkshire’s.
Add the two balance sheet lines for the insurance and other businesses at 30 June and you get $360.0 billion: cash of $35,096 million and Treasury bills of $324,905 million. Berkshire’s own figure for the same date is $359.2 billion. The difference is a payable of $771 million: bills bought before quarter end that hadn’t settled, sitting in short term investments with a matching liability. Nothing moved economically. Yet only one of the two figures reaches the reader.
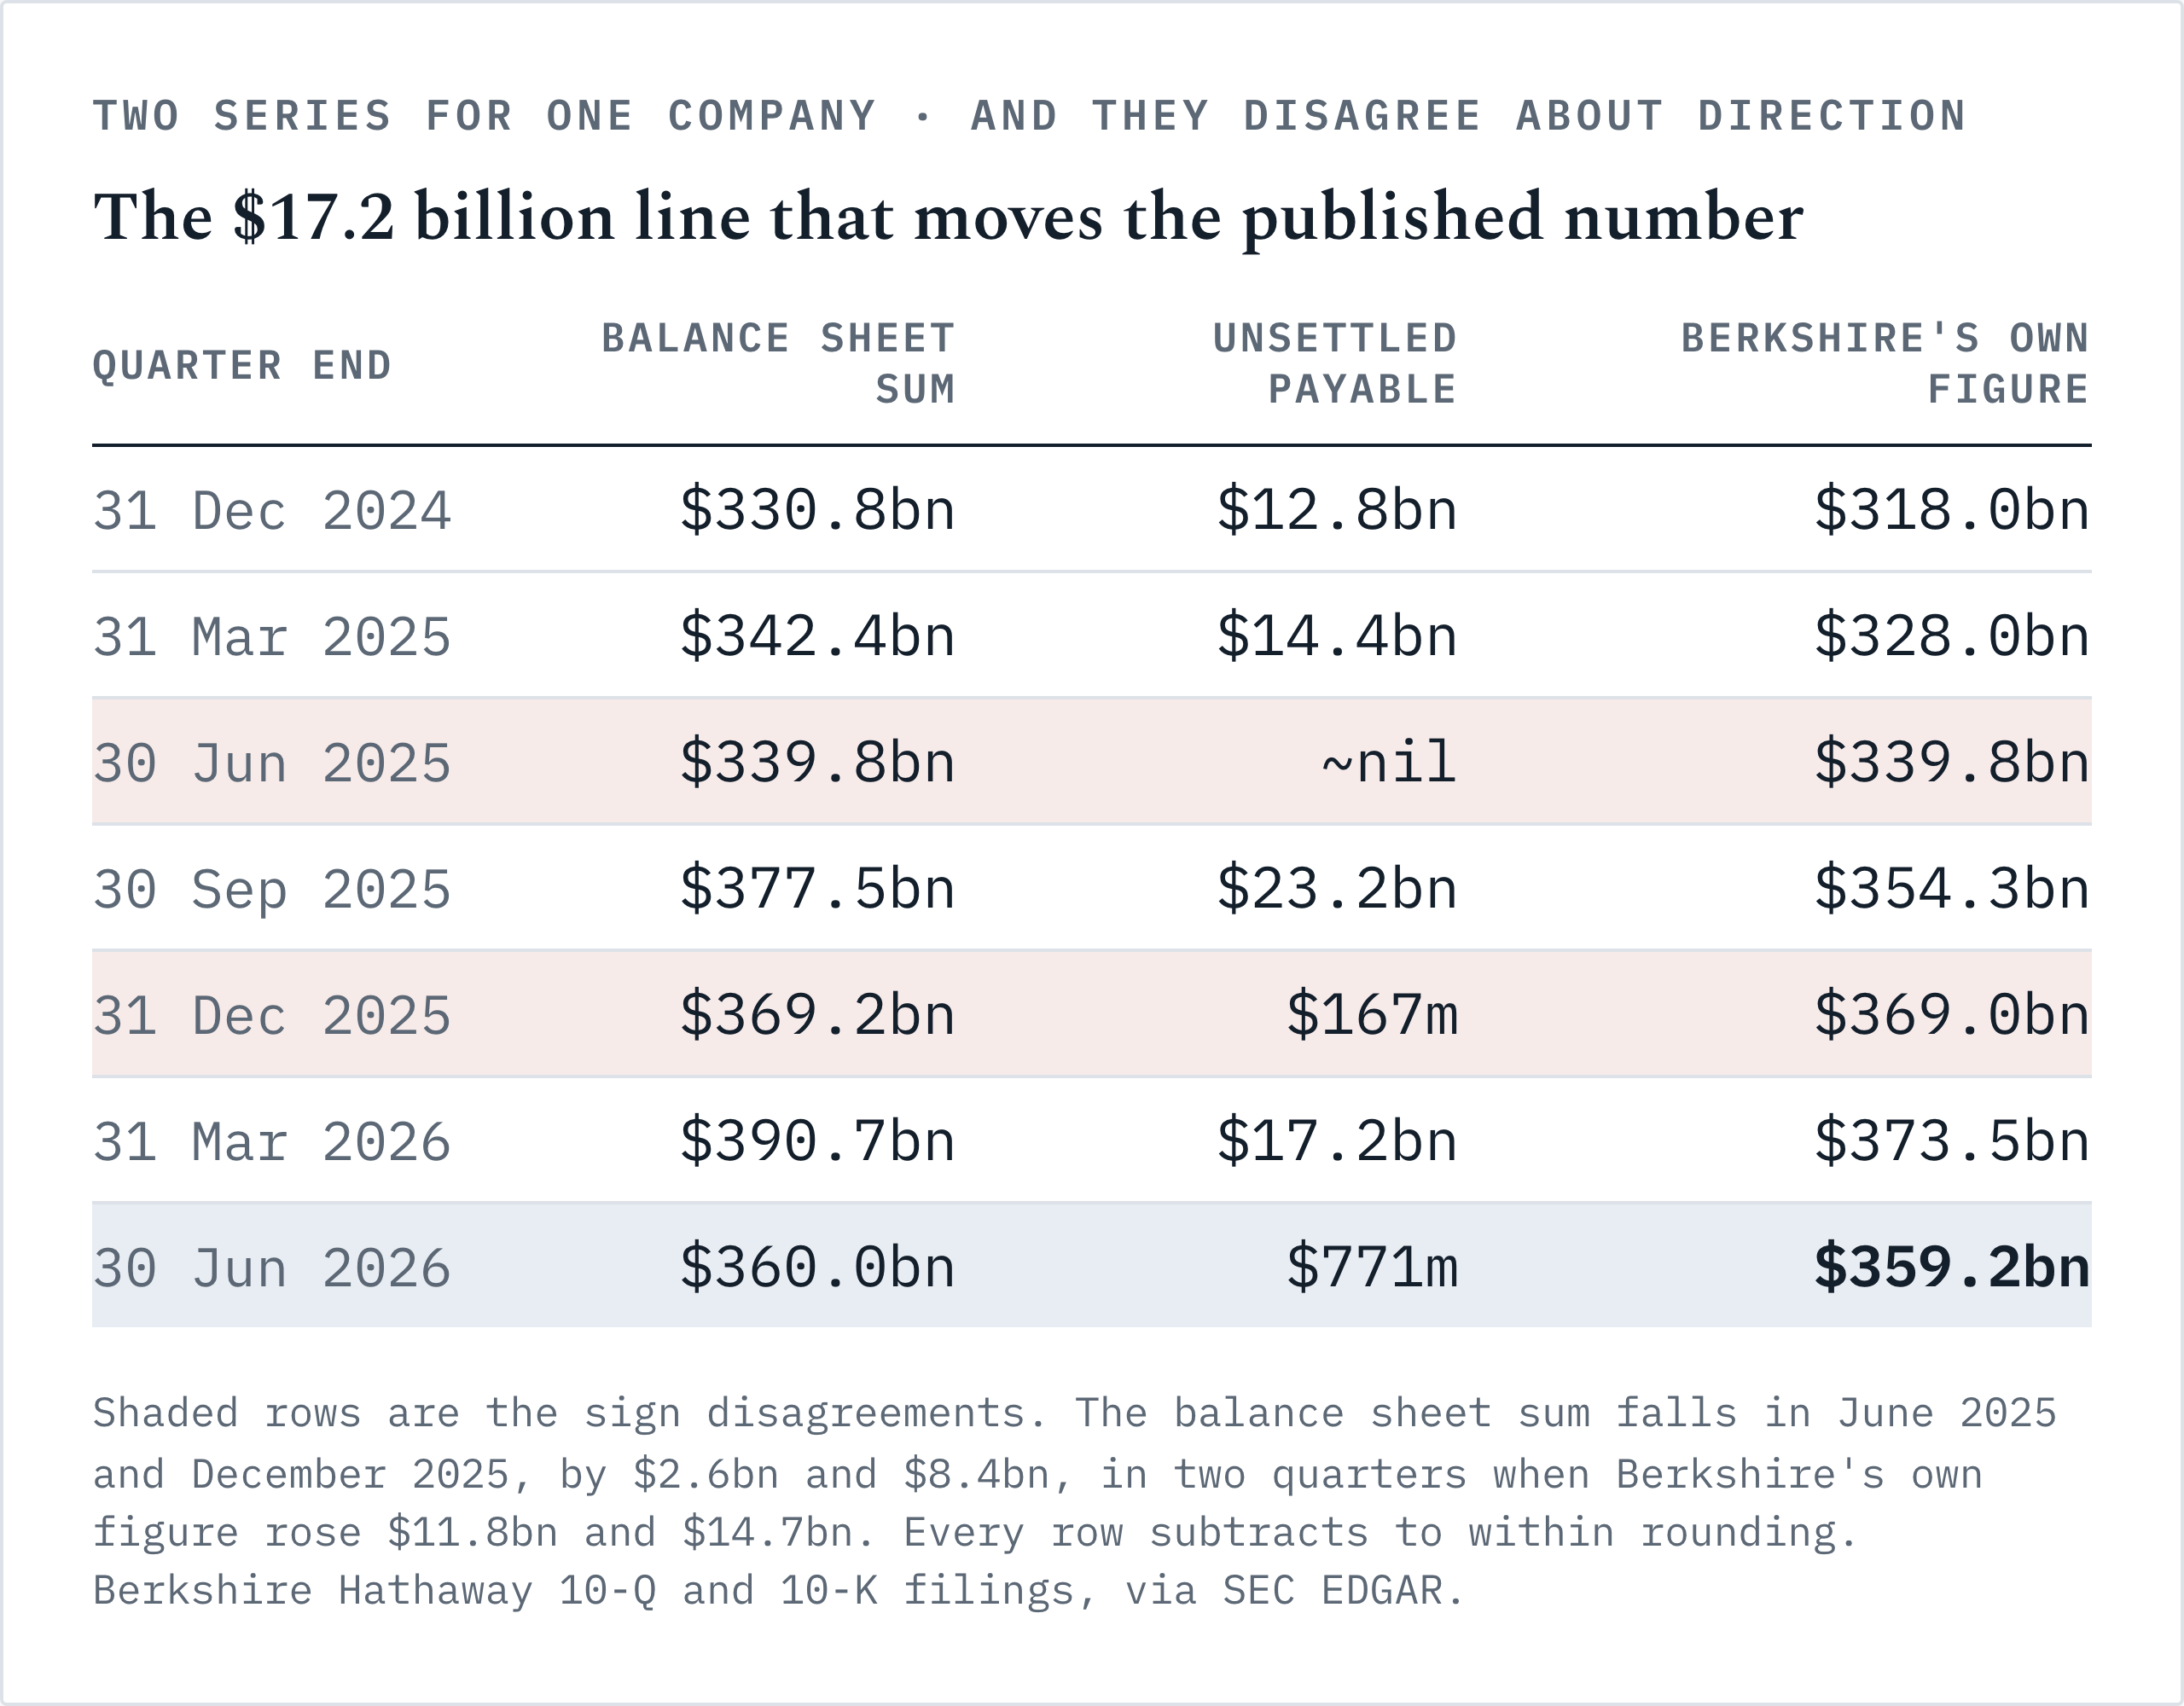
Every row I checked subtracts to within rounding. And the left column falls in June 2025 and December 2025, by $2.6 billion and $8.4 billion, in two quarters when the right column rose by $11.8 billion and $14.7 billion. Wrong sign, twice, on the most watched number at the company. Anyone can verify it in two minutes.
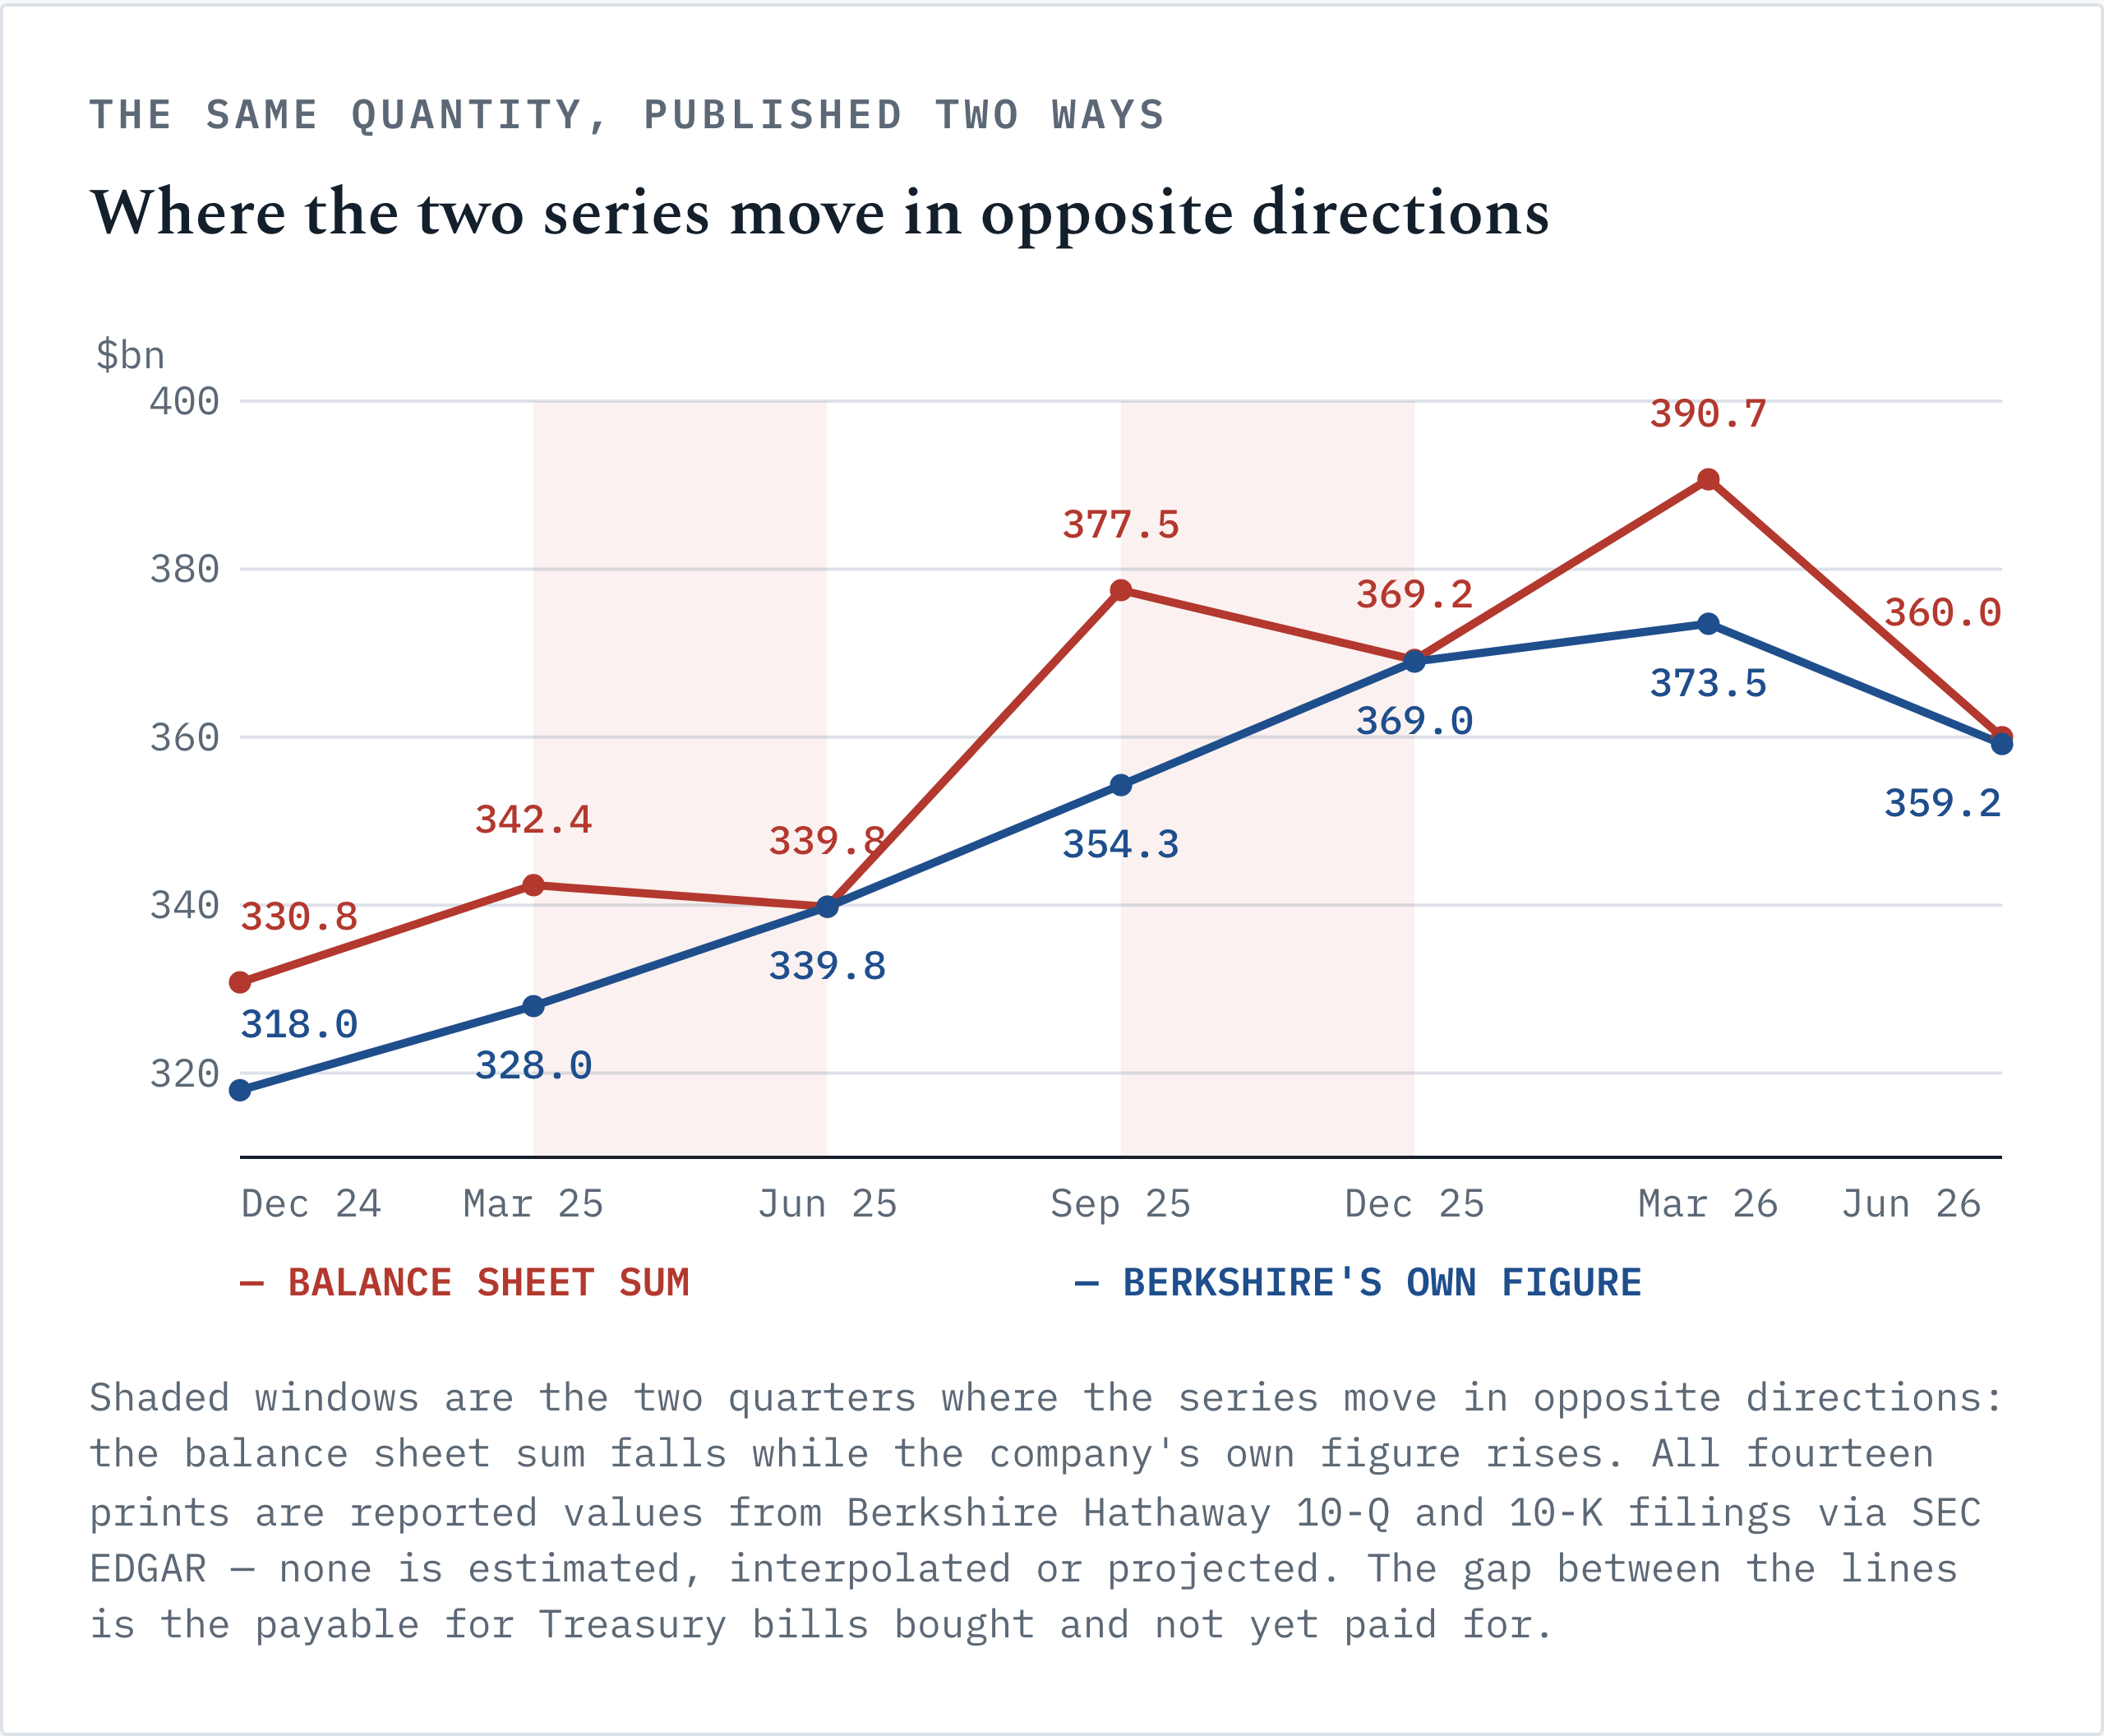
At the March quarter the same arithmetic ran $21.6 billion gross against $4.5 billion net: $390.7bn less a $17.2bn payable, against $369.2bn less $167m. So seventy-nine per cent of the headline move was the payable and nothing else.
This quarter the two agree, because the payable happens to be small. Which is exactly why I subtract it every quarter, not only when it looks necessary: the gap is not stable, so you cannot know whether it matters until you already have. Run June unadjusted and you get a $30.7 billion fall instead of $14.3 billion, because you are comparing a quarter carrying a $17.2 billion payable against one carrying $771 million.
Why so unstable? My first guess was the auction calendar, and it was wrong, which turned out more useful than being right. Using the Treasury’s own auction records I measured the pool of bills auctioned before each quarter end that settled after it: $240.2bn, $363.9bn, $393.8bn, $306.7bn, $481.8bn and $254.7bn. That pool is never empty. Berkshire’s payable works out at 5.33%, 3.95%, 0.00%, 7.57%, 0.03% and 6.76% of it. In the quarter with the biggest pool of all, December 2025 at $481.8 billion, its payable was $167 million.
So it isn’t the calendar. Berkshire either bought at those auctions or sat them out, and when it participated it took four to eight per cent. That’s roll management on a bill book that turned over half its value in a quarter. It carries no capital allocation information at all, and it has been as much as four times the size of the change it obscures. One caveat on my own measurement: secondary purchases settle T+1 and never appear in auction data, so my pool is a floor.
What I find odd is that this survives at all, because Berkshire hands you the correction, in the financial condition paragraph of every filing since September 2024. My guess at why the wrong number still wins is boring and probably right: the balance sheet is where anyone looks first, the two lines are adjacent and easy to add, and the sentence correcting them sits forty pages later, in a section most readers skip. The error isn’t hidden. It’s just further away than the mistake.
If you want the procedure rather than the finding, I wrote the method up separately: how to spot this payable in any filing, the three checks for which issuers carry one, and the worked example end to end including the step where my own first attempt used the wrong perimeter. It’s here: Berkshire’s Cash Line Grossed Up $23.2bn on One Treasury Settlement Date.
Second time in a month a headline number turned on an accounting adjustment, after SpaceX’s AI profit and its depreciation add back. Same shape, different line.
