


This is a detailed research piece. If you find value in institutional-quality hedge fund analysis, support this work on Patreon.
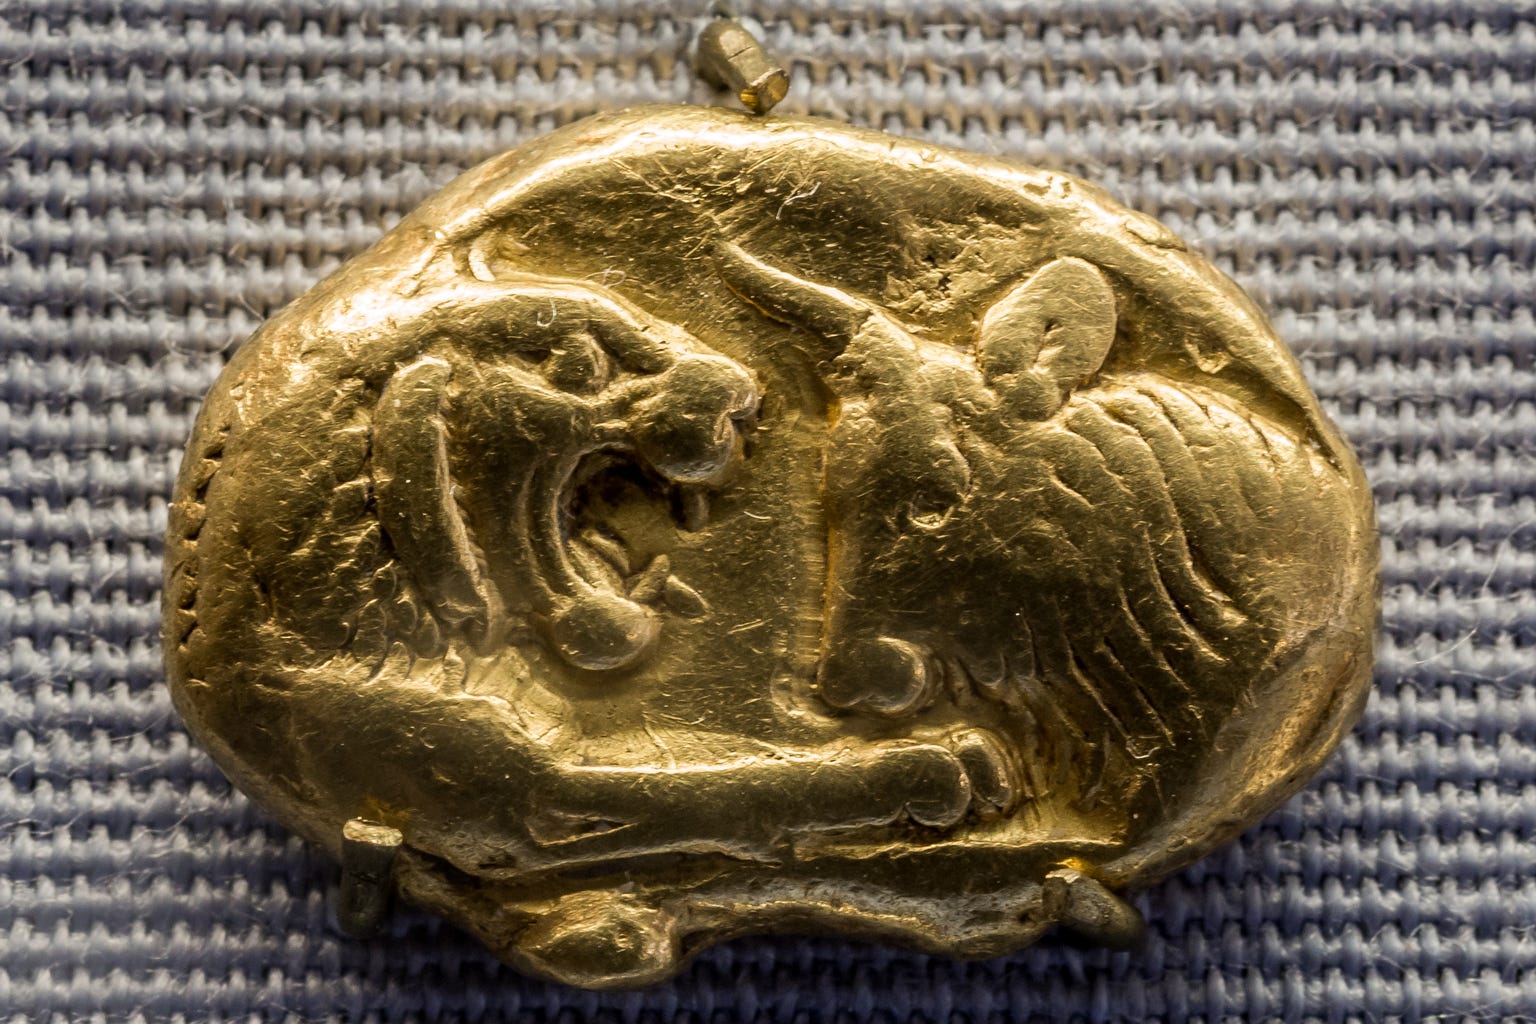
What if the entire history of global finance could be understood as one continuous capital migration? From the first standardized coins struck in Lydia around 630 BCE to today’s dollar-denominated derivatives, wealth has followed a remarkably consistent pattern: it flows toward technological advantage, pools in trade chokepoints, and ultimately transfers through either conquest or currency arbitrage.
For quantitative researchers, this history offers more than academic interest. The same dynamics that drove silver eastward along the Silk Road now govern carry trades and reserve currency flows. Understanding these patterns provides context for modeling long-term structural shifts in global markets.
Phase I: The Invention of Money (650 BCE — 500 CE)
First Standardized Coinage
The Lydian stater, minted under King Alyattes around 630–610 BCE, represents the first government-issued coinage in recorded history. Made from electrum (a gold-silver alloy), these coins featured the iconic lion’s head design and established the critical innovation: state-guaranteed weight and purity.
The economic logic was elegant. Electrum’s natural gold content varies substantially depending on source (commonly cited as roughly 55–85%), making raw electrum difficult to value. By standardizing a stater at approximately 55% gold (the Croeseid standard), the Lydians created a reliable medium of exchange for large transactions.
Key quantitative insight: The Croeseid staters that followed under King Croesus (560–546 BCE) established the first documented exchange rate. Ten silver staters traded for one gold stater, creating a bimetallic standard that persisted for millennia.
The Roman Monetary System
Rome’s denarius and aureus coins dominated Mediterranean trade from the 3rd century BCE through the 5th century CE. The Roman system demonstrates an early example of monetary debasement: silver content in the denarius fell from approximately 95% under Augustus to under 50% by the 3rd century CE, correlating with inflationary crises. (Fineness estimates vary by period and mint.)
GDP estimates from this era are inherently uncertain, but Angus Maddison’s reconstructions suggest the Roman Empire at its peak (around 150 CE) represented approximately 25% of global output, with the Han Dynasty holding a comparable share. These two economies, though separated by thousands of miles, were linked through the Silk Road trade network.
Phase II: Paper Money and the Asian Economic Peak (960–1800 CE)
The Song Dynasty Innovation
In 1024 CE, the Northern Song Dynasty established the Jiaozi Wu (交子務), the first government office for issuing paper currency. This followed decades of private merchant experimentation in Sichuan province, where heavy iron coins made trade impractical.
The Jiaozi system introduced several concepts now standard in monetary policy:
Denomination standardization: Notes of 1, 5, and 10 guan
Expiration dates: Initially 2–3 years, requiring redemption
Reserve backing: Approximately 20–30% coin reserves (estimates from provincial records; reconstructed and uncertain)
Anti-counterfeiting measures: Multiple color inks, official seals
By the 12th century, the Song government faced the same challenge that confronts modern central banks: the temptation to over-issue. Paper currency in circulation exceeded 4 million min against only 700,000 iron cash coins in reserves. The resulting inflation contributed to the dynasty’s eventual instability. (Note: Medieval monetary figures are reconstructed from historical records and carry uncertainty.)
The Great Divergence Debate
Economic historians have extensively debated when European living standards surpassed Asian levels. Kenneth Pomeranz’s influential 2000 work “The Great Divergence” argued that as late as 1750, the Yangzi Delta region of China showed comparable economic indicators to England and the Netherlands, including life expectancy, caloric intake, and market development.
More recent scholarship, including a 2020 study on northern India, places the divergence earlier, beginning in the late 17th century and accelerating dramatically after 1800. The Maddison Project Database estimates that in 1820, China still represented approximately 32.9% of global GDP, with India at 16.0%, while Western Europe collectively held roughly 23.0%. (These figures use Maddison’s international dollar methodology for cross-country comparison.)
The critical point for quantitative analysis: Asia’s share of global output did not decline because Asian economies contracted. They grew throughout this period. Europe’s industrial revolution simply grew faster, representing one of history’s most dramatic relative outperformance episodes.
Phase III: The Silver Trade and Early Globalization (1500–1800)
Quantifying the Silver Flows
The discovery of silver deposits at Potosi (modern Bolivia) in 1545 created history’s first truly global commodity trade. Between 1500 and 1800, Spanish American mines produced an estimated 80% of the world’s silver, with approximately 30% ultimately flowing to China.
The trade mechanics reveal a persistent arbitrage:
Gold-to-silver ratio in Europe: Approximately 12:1
Gold-to-silver ratio in China: Approximately 6:1
This price differential drove massive capital flows. Between 1600 and 1800, China received roughly 100 tons of silver annually through two primary channels (estimates vary by decade and accounting method):
The Atlantic-Cape Route: Americas to Spain to India/China
The Pacific Route: Mexico to Manila to China (via the Manila Galleon trade, 1571–1815)
The Ming Dynasty’s 1581 tax reform, requiring payment in silver rather than grain, further intensified demand. China effectively became a “silver sink,” absorbing precious metals in exchange for silk, porcelain, and tea.
India’s Role as Intermediary
The Indian subcontinent functioned as a critical waypoint in global silver flows. European demand for Indian textiles meant substantial silver entered India, while Indian demand for Chinese goods pushed much of it further east. Parthasarathi estimates 28,000 tonnes of bullion flowed into India between 1600 and 1800, representing 30% of global production in that period. (Estimates vary by decade and accounting method.)
Phase IV: Industrial Revolution and Imperial Finance (1800–1945)
Britain’s Economic Hegemony
By 1870, the British Empire (including colonies) accounted for roughly 24% of world GDP; the United Kingdom itself contributed about 9%. Britain controlled approximately 25% of global trade and produced 30% of world industrial output.
The Empire’s financial infrastructure proved equally dominant:
The pound sterling served as the de facto global reserve currency
London’s discount houses set global interest rates
British merchant banks financed infrastructure across six continents
The Maddison data reveals a critical pattern: Britain’s share of global output peaked in the 1870s and declined steadily thereafter, even as absolute British GDP continued rising. Germany’s industrial growth rate exceeded Britain’s from the 1870s, and the United States surpassed British output by the early 20th century.
Colonial Wealth Transfers
India’s economic trajectory illustrates the most dramatic shift in relative shares during this period. Maddison’s estimates show India’s share of global GDP falling from approximately 24.4% in 1700 to around 4% by 1950. This decline reflected both slow growth in India (per capita income showed minimal gains over 200 years) and the explosive growth occurring elsewhere during the Industrial Revolution.
The mechanism involved systematic trade imbalances. Britain purchased Indian raw materials (cotton, opium, indigo) with manufactured goods and financial claims rather than bullion, reversing the centuries-long precious metal flow into Asia.
Phase V: American Century and Dollar Dominance (1945-Present)
Post-War Economic Structure
At the end of World War II, the United States held an unprecedented position: approximately 50% of global GDP (nominal, market-exchange-rate basis), roughly three-quarters of official monetary gold reserves, and net creditor status. The Bretton Woods system (1944–1971) formalized this dominance by pegging global currencies to the dollar and the dollar to gold at $35 per ounce.
The post-war data shows a consistent pattern of relative decline (nominal GDP shares, market-exchange-rate basis):
1945: Approximately 50% of global GDP
1960: Approximately 40% of global GDP
1985: Approximately 33% of global GDP
2024: Approximately 24% of global GDP
Yet this decline, like Britain’s before it, reflects growth elsewhere rather than American stagnation. U.S. real GDP per capita has risen roughly sevenfold since 1945.
Contemporary Capital Flows
Today’s global economy represents approximately $105 trillion in annual output (2024 nominal GDP estimate, Visual Capitalist/IMF). The United States and China alone account for approximately 42% of this total, recreating a bipolar economic structure not seen since Rome and Han China traded along the Silk Road.
Key structural differences from historical periods:
Financial depth: Global financial assets now exceed 350% of GDP (McKinsey Global Institute)
Currency composition: The dollar represents approximately 59% of global foreign exchange reserves (IMF COFER, 2024)
Trade integration: Trade as a share of world GDP rose from approximately 19% in 1970 to approximately 50% by the 2010s-2020s (Our World in Data / World Bank)
Quantitative Patterns Across 3,000 Years
Several consistent patterns emerge from this analysis:
1. Relative advantage compounds faster than absolute growth
The Great Divergence was not about Asian decline. Europe’s 1–2% annual growth advantage compounded into dominance over two centuries. Similar dynamics now favor emerging markets.
2. Reserve currency status follows economic power with a lag
The pound remained dominant for decades after Britain’s economic peak. The dollar’s reserve status has persisted despite relative U.S. decline since 1945.
3. Trade chokepoints determine capital accumulation
From Venice controlling Silk Road termini to Singapore today, geographic positioning in trade networks correlates with wealth concentration.
4. Monetary debasement follows predictable paths
Roman silver content decline, Song Dynasty paper inflation, and modern quantitative easing show similar political economy dynamics.
Sources
Historical GDP Estimates
Maddison Project Database 2023, Groningen Growth and Development Centre
Bolt, J. and van Zanden, J.L. (2024), “Maddison-style estimates of the evolution of the world economy,” Journal of Economic Surveys
Coinage History
World History Encyclopedia, “The Importance of the Lydian Stater as the World’s First Coin”
https://www.worldhistory.org/article/797/the-importance-of-the-lydian-stater-as-the-worlds/
Wikipedia, “Croeseid”
Paper Money Origins
Hoover Institution, “The Rise and Demise of Paper Money in Imperial China”
https://www.hoover.org/research/rise-and-demise-paper-money-imperial-china
Wikipedia, “Jiaozi (currency)”
Great Divergence
Pomeranz, Kenneth (2000), “The Great Divergence: China, Europe, and the Making of the Modern World Economy,” Princeton University Press
https://press.princeton.edu/books/paperback/9780691217185/the-great-divergence
Silver Trade
Wikipedia, “Global silver trade from the 16th to 19th centuries”
https://en.wikipedia.org/wiki/Global_silver_trade_from_the_16th_to_19th_centuries
Parthasarathi, Prasannan, “Why Europe Grew Rich and Asia Did Not”
British Empire Economics
Wikipedia, “Economy of the British Empire”
Maddison, Angus (2001), “The World Economy: A Millennial Perspective”
Post-War U.S. Economy
Visual Capitalist, “Visualizing the U.S. Share of the Global Economy Over Time”
https://www.visualcapitalist.com/u-s-share-of-global-economy-over-time/
Visual Capitalist, “Visualizing the $105 Trillion World Economy”
https://www.visualcapitalist.com/visualizing-the-105-trillion-world-economy-in-one-chart/
Reserve Currency Data
IMF COFER (Currency Composition of Official Foreign Exchange Reserves)
https://data.imf.org/
Trade and Financial Depth
Our World in Data, “Trade as a share of GDP”
McKinsey Global Institute, Global Banking Annual Review
Related Reading
Ray Dalio, “Principles for Dealing with the Changing World Order” (video)
For quantitative finance professionals, this historical framework offers perspective on structural regime changes. Today’s dollar dominance, like every previous monetary hegemony, will eventually evolve. Understanding how these transitions occurred historically may inform long-horizon allocation decisions.
Happy New Year. Here’s to understanding where wealth flows next.
📊 Support this research: https://www.patreon.com/c/NavnoorBawa
Cover photograph: ArchaiOptix, CC BY-SA 4.0, via Wikimedia Commons.