


A primary-source forensic breakdown of how the 2025 tariff crisis separated hedge fund winners from losers — every trade traced to an interview transcript, investor letter, court filing, or regulatory data. Fourteen funds. Eight mechanisms. One regime shift.

The global hedge fund industry delivered a 12.6% average annual return in 2025 — its strongest year since the Global Financial Crisis. That average, however, is almost useless. The same tariff environment — US trade-weighted tariffs jumping from 2.4% to 18.4%, the WTO projecting trade contraction, Liberation Day erasing approximately $5–6 trillion in global market value in two sessions (Reuters reported $5 trillion in S&P losses; the AMRO analytical note cited below uses $6 trillion; figures vary by data vendor and which markets are included) — produced a 45% return for one fund, a 34% record for another, and a -15% drawdown for a manager who is widely considered among the world’s best.
What follows is a forensic breakdown of the exact trades, from primary sources: interview transcripts, investor presentations, court documents, and prime brokerage data. Not summaries. The actual mechanics.
🎥 Prefer to Watch Instead of Read?
I’ve put together a full video breakdown of this analysis — covering every fund, every trade, and every key insight from this article.
📊 This Article Has an Extended Version on Patreon
The full forensic breakdown — complete trade tables for all 14 funds, the confirmed vs. inferred evidence log for every position, the six replicable structural patterns for future macro regimes, and the full $164.7B tariff refund market analysis — is published exclusively for Patreon members.
→ Read the full extended analysis here
Or join the Patreon community to access this and all future institutional-grade research.
Act I: Bill Ackman’s Unhedged Fund — The Canonical Error
Start here, because this story is almost never told, and it illuminates everything that follows.
Pershing Square Holdings entered 2025 with no hedges. None. As Hedgeweek reported on April 9, 2025: “The fund reported no hedges entering last week’s market turmoil, a fact that has left it fully exposed to the downside move triggered by Trump’s tariffs on more than 60 countries.”
When Liberation Day hit on April 2 and the S&P 500 fell more than 10% over two trading sessions — the worst two-day performance since March 2020 — Pershing Square’s top holdings (Alphabet, Brookfield Asset Management, Chipotle, Nike) all fell more than 20%. PSH ended April down approximately 15% on the year. Shares in the trust fell more than 3% on the Monday following Liberation Day alone.
This is worth dwelling on because of who Bill Ackman is. In February–March 2020, he turned $27 million into approximately $2.6 billion in 30 days by buying credit default swaps on the CDX IG, CDX HY, and ITRAXX Main (European investment-grade) indices at near-all-time-tight spreads of roughly 50 basis points — before COVID sent spreads exploding. That trade required three moves: identifying a massive compression of vol pricing a binary risk, choosing liquid index CDS over individual credits for sizing, and exiting on March 23, 2020, the exact day the Fed announced unlimited QE. In 2025, no such hedge existed. The same manager who executed one of the most famous asymmetric hedges in market history entered the most telegraphed tariff regime in decades completely unprotected.
He survived for structural reasons. PSH is permanent capital — no redemption pressure, patient LPs, no forced selling. Institutional Investor confirmed PSH ended Q1 2025 down a net 1.2% and down 6.8% in March alone — its worst monthly performance since May 2022.
Then came the recovery — and this is the part that matters. Ackman’s rebound had almost nothing to do with tariff trading. The PSH February 2026 Annual Investor Presentation confirms NAV grew 20.9% for the full year and total shareholder return was 33.9%. The engine of that recovery: Fannie Mae and Freddie Mac. As the PSH 2026 Annual Investor Presentation confirms, FNMA and FMCC share prices surged 227% and 211% respectively over the full year 2025 as speculation built around Trump ending the 17-year federal conservatorship — a figure corroborated by contemporaneous market data showing FNMA up approximately 350% from January through November 2025 alone before pulling back. Ackman had been building this position for over a decade and published a detailed January 16, 2025 GSE restructuring presentation arguing for a privatization framework. As CNN Business reported in June 2025, Ackman is among the largest holders of common shares in both companies. The Fannie and Freddie position contributed approximately 3.5 net percentage points in 2024 alone, per Institutional Investor.
The lesson: +20.9% net NAV from a fund that was down -15% in April, rescued by a separate decade-old policy bet — not tariff trading.
Act II: Druckenmiller’s Book — Verbatim, From His Own Mouth
On January 30, 2026, Stanley Druckenmiller sat down with Morgan Stanley’s Iliana Bouzali, Global Head of Derivatives Distribution and Structuring, for the firm’s Hard Lessons series. The episode was published February 27, 2026. Here is his current portfolio, verbatim:
Short USD: Druckenmiller said: “We’re bearish on the US dollar, mainly because sort of the top of the historic range in terms of purchasing power and foreigners are way, way overloaded in dollars. And I don’t know whether it’s like a sell America trade because it’s more like if they don’t buy American assets on a net basis because of the trade balance and because of the position the dollar will go down on its own.”
Long copper: He added: “We own copper. It’s not a genius trade. It’s a big consensus trade. There’s no supply coming on of meaningful supply. Very tight for the next eight years. And obviously you have a big add-on from AI and data centers.” Copper has risen 32% over the past 52 weeks and 6% in 2026 as of the interview date.
Long gold: Held as a geopolitical hedge, per the interview.
Short bonds: As RealClearPolitics’ transcript captures directly: “And then because we’re long all these risk assets I just mentioned, we’re short bonds. I don’t necessarily expect to make money short bonds, but I think we might make a lot if I’m right on the economy... if the Fed were to cut into a booming economy for inflation to take off, particularly with what’s going on in commodities. So I’m open-minded to that. But we create a matrix and the bonds are helpful in both ways.”
Long Japan and Korea: “We still have big positions in Japan and Korea. Some of them are AI, some of them are not.” The iShares MSCI Japan ETF is up 40% over a one-year span, and iShares MSCI Korea ETF up 55% vs. S&P 500 at 15%.
The Teva trade — the non-macro alpha source: In the Morgan Stanley Hard Lessons interview, Druckenmiller walked through this directly. In mid-2024, AI stocks were “disturbingly heated” and he was looking for dislocations. His team brought him Teva Pharmaceuticals — “apparently, if you didn’t know what was going on, a boring generic drug company out of Israel, selling at six times earnings.” Teva was transitioning from generics to biosimilars. Value holders hadn’t repriced it; growth investors hadn’t discovered it. He bought in the mid-$16 range. The stock doubled to $32. (Note: specific price figures are reported in secondary coverage of the interview; the Morgan Stanley video itself does not display a transcript with exact figures.) Zero tariff exposure. Pure investor-base dislocation, found by a Duquesne analyst and sized by Druckenmiller’s pattern recognition. “Macro has been dead for 10 or 15 years,” he said in the interview. “I don’t think that’s the case anymore.”
The overall framework: Druckenmiller told CNBC on April 6, 2025 that he does not support tariffs exceeding 10%, in response to his prior January 2025 CNBC interview being shared on X. He opposed the policy — but his book (short dollar, long copper, long gold, short bonds, long non-US equity) was a direct expression of the tariff regime’s consequences.
Act III: Paul Tudor Jones — The Timeline of a Wrong Call, Admitted
The PTJ arc in 2025 is one of the most instructive case studies available in real time.
May 6, 2025 — CNBC Squawk Box: Jones told Andrew Ross Sorkin: “For me, it’s pretty clear. You have Trump who’s locked in on tariffs. You have the Fed who’s locked in on not cutting rates. That’s not good for the stock market. We’ll probably go down to new lows, even when Trump dials back China to 50%.” He called tariffs “the largest tax increases since the ‘60s” and modeled 2–3% shaved off GDP growth.
He was wrong. The S&P 500 did not revisit its April 8 lows. After Trump’s 90-day pause on April 9, the index posted its best single day since October 2008 — up 9.52%.
October 6, 2025 — CNBC Squawk Box, the same show: Sorkin quoted Jones his May call back to him. Jones replied in the full CNBC transcript: “Correct. That was really wrong, wasn’t it?”
He then explained his correction mechanism: “At that point in time, the stock market was still on the way back up. It was still flirting with the 200-day moving average. I am really simple. The one thing that I’ve learned in my job is humility. How often we are wrong. So I’m going to always use as my standard bearer the 200-moving-day average.”
His October positioning: “It feels exactly like 1999... all the ingredients are in place for some kind of a blow-off top.” He cited fiscal policy (6% budget deficit), a likely new Fed chair moving toward negative real rates, and the same inflationary dynamics as the late postwar period as the setup for “massive price appreciation in a variety of assets.”
His underlying directional trades throughout 2025 — long gold, long bitcoin, short long-duration bonds — were disclosed in October 2024 and reaffirmed: his “all roads lead to inflation” framework, driven by the deficit and tariff-driven price shocks, was correct on regime. He was wrong on the near-term equity path.
The execution lesson: being right about the macro regime (inflationary, dollar-weakening, gold-bullish) while being wrong about near-term equity direction is where macro traders lose money even with correct analysis.
Act IV: Bridgewater’s Pure Alpha — The 50-Year Record, Explained Mechanically
Bridgewater’s Pure Alpha II returned 33–34% for 2025, its best result in the firm’s 50-year history. The All Weather strategy returned 20.4%. Asia Total Return gained 36.9%. China Total Return gained 34.2%. The AI-driven AIA Macro fund returned 11.9%, per Reuters and confirmed by Institutional Investor.
Institutional Investor’s deep-dive quotes Greg Jensen directly: “The markets are entering a period of easing monetary policy and transformation of technology. Looking ahead to 2026, the firm sees a risky environment for many investors.” He also flagged, as Hedgeweek confirmed, that the firm had deliberately returned capital to investors in prior years to enhance flexibility — lower AUM, cleaner macro expression, larger positions relative to assets.
The mechanical engine: Pure Alpha runs 30–40 simultaneous positions across bonds, currencies, equities, and commodities. Each position is sized not by conviction but by risk contribution — every position scaled to contribute an equal proportion of portfolio volatility. Historical correlations of 0.19 to equities, 0.15 to bonds, 0.07 to hedge fund peers. What the tariff regime provided was exactly what this architecture is built to exploit: persistent bond-equity correlation breakdown, dollar weakness, commodity dislocations, cross-currency dislocations — all simultaneously and persistently.
Bridgewater published its gold thesis explicitly in a March 2025 research transcript: tariffs create a one-off price shock. Central banks, recognizing the non-structural nature, look past it — they do not raise real rates to compensate. Gold holders therefore receive the inflationary debasement without the offsetting increase in the opportunity cost of holding a non-yielding asset that rate hikes would normally impose. The firm called it “a perfect storm” for gold. Gold subsequently topped $3,300/oz as the dollar reserve currency status uncertainty amplified central bank demand independent of the real-yield framework.
Act V: Liberation Day — The Exact Numbers
April 2, 2025: Trump announced sweeping reciprocal tariffs. April 3–4: The S&P 500 declined more than 10% over two sessions, wiping approximately $5–6 trillion in global market value (Reuters reported $5 trillion in equity losses; the AMRO analytical note and Wikipedia-cited analyses place the global figure closer to $6–6.6 trillion).
On April 4 specifically — when China announced 34% retaliatory tariffs on US goods — Cboe’s own close-to-close attribution data records the VIX rising 23.8 points from 21.5 to 45.3 in a single session. That is the official closing-level move. On an intraday basis, the VIX spiked to 52.33 — its highest intraday print since COVID — before closing lower as the session’s volatility compressed. From its pre-Liberation Day level of under 17, the VIX skyrocketed to above 60 over just eight trading sessions — one of only four times in history the index subsequently fell from above 60 back below 20 in under 100 days.
Funds that held long volatility positions — deep OTM S&P puts, long VIX futures, variance swaps — collected maximum payoff: low implied vol entering April (cheap cost to hold), massive surprise payout on Liberation Day. Funds that then went long equities on April 9, when Trump announced the 90-day pause, captured both legs: the S&P posted its best single day since October 2008, up 9.52%.
Conversely, hedge funds had, by late August 2025, ramped VIX short positions to their highest level since 2022 — the same setup that had already burned short-vol investors in February and April. That positioning risk was still live heading into Q4.
Act VI: The Tariff Refund Market — The Asset Class Nobody Knew Existed
This is the most technically elegant alpha source of the cycle, and it has the clearest paper trail.
Beginning in early 2025, US companies paid tariffs under IEEPA. Simultaneously, lawsuits challenged whether IEEPA actually authorized the president to impose tariffs. If struck down, importers were potentially entitled to full refunds. If upheld, refund claims were worthless. A secondary market emerged around November 2025 for those contingent claims.
The mechanism, explained by Wes Harrell, head of the trading group at Seaport Global, directly to NPR’s Mary Childs in her February 25, 2026 report on All Things Considered: a company that had paid $20,000 in tariffs sold its potential refund claim to a hedge fund at approximately 20 cents on the dollar — $4,000 in cash today for a claim that might pay $20,000 back later. The importer got certainty now. The hedge fund absorbed the binary legal risk entirely: if the Supreme Court upheld IEEPA authority, the claim went to zero.
Bloomberg, confirmed by TradeAlgo and the American Prospect named the buyers: King Street Capital Management, Anchorage Capital Advisors, and Fulcrum Capital Holdings — all special-situations funds comfortable tying up capital through slow-moving legal battles. Brokers facilitating the trades: Oppenheimer & Co., Jefferies Financial Group, and Seaport Global, per Financial Advisor Magazine’s November 2025 report.
Peacock Tariff Consulting’s November 2025 market analysis confirms pricing granularity the NPR transcript doesn’t include: reciprocal tariff claims traded at 20–25 cents on the dollar; anti-drug (fentanyl) tariff claims at as little as 5 cents — the market was pricing the distinct statutory bases and their respective legal vulnerabilities. Jefferies alone facilitated dozens of trades including deals exceeding $100 million tied to reciprocal tariffs.
Harrell told NPR: “The market was oddly well defined from a very early stage in this.” And: “Harrell says this market has already seen hundreds of millions of dollars of deals done.”
On February 20, 2026, the Supreme Court ruled 6–3 that IEEPA does not authorize the president to unilaterally impose tariffs. Penn Wharton Budget Model’s real-time data puts total IEEPA tariff revenue collected at $164.7 billion through January 2026, potentially rising toward $175 billion including February. Immediately post-ruling, refund claims repriced from approximately 20 cents to approximately 40 cents on the dollar. Funds that bought at 20 cents are looking at a 2x unrealized return on a binary legal bet, uncorrelated to any market index.
Harrell’s final word to NPR: “There really is no modern parallel for the magnitude of this unwind, and I just don’t see the administration turning around in short order and immediately issuing refunds.”
Act VII: The Treasury Basis Trade — Near-Death, Then Expansion
The Treasury basis trade — buy cash Treasuries, short Treasury futures, capture the convergence — is profitable at scale only with 50–100x leverage, funded in overnight repo. Better Markets’ April 2025 fact sheet details the mechanics: typical spread of a few basis points, multiplied by leverage to produce returns.
When Liberation Day drove Treasury yields sharply higher and volatility spiked, margin calls forced some funds to unwind, dumping cash Treasuries, pushing yields further, triggering more calls. The Atlantic Council documented the cascade precisely: “the rise in US Treasury yields amid great volatility has caused hedge funds to unwind the basis trade... hedge funds are forced to liquidate their positions to raise cash, reinforcing the downward price movements.”
The cascade did not complete for four simultaneous reasons: higher volatility increased the delivery option embedded in Treasury futures (improving trade economics); easing rate expectations compressed the spread needed to survive; yield curve steepening improved duration positioning; and repo liquidity remained abundant. Funds without forced capital redemptions that held through the turbulence saw the trade recover. By Q2, JPMorgan prime brokerage data shows hedge fund repo borrowing had reached $3.1 trillion and gross leverage hit 294% — exceeding pre-shock levels.
Act VIII: The Pod Shop Penalty — Why Structure Ate Strategy
The performance gap between global macro funds and multi-manager pod shops reveals a structural incompatibility with the tariff trade.
Citadel Wellington: +10.2%. Millennium: +10.5%. Both under-performed the S&P 500’s 16.97% price return (17.9% on a total-return basis). Reuters explicitly noted both funds were “weighed down during the first half of the year by Trump administration trade policies.”
The architecture explains the outcome. Pod shops manage risk via tight team-level drawdown limits — typically 2–3% before a book gets cut. The correct tariff macro trade in Q1 2025 required: long gold, short dollar, long volatility, potentially long non-US equities — all of which could have drawn down 2–3% before Liberation Day validated the thesis. A pod team running that combination in January–March 2025 would have been stopped out weeks before April 2 delivered the payoff. The trade required patient capital and conviction-based sizing that pod shop architecture structurally cannot accommodate.
By contrast, D.E. Shaw’s Oculus returned +28.2% and AQR Apex +19.6% — both benefiting from the same systematic diversification that rewards multi-regime positioning. Melqart Asset Management’s Opportunities Fund returned +45.1% — the top performer in Bloomberg’s ranking of major hedge funds — running event-driven flexibility that allowed it to position around binary tariff-on/tariff-off catalysts, court rulings, and GSE policy events.
The Verified Performance Scorecard
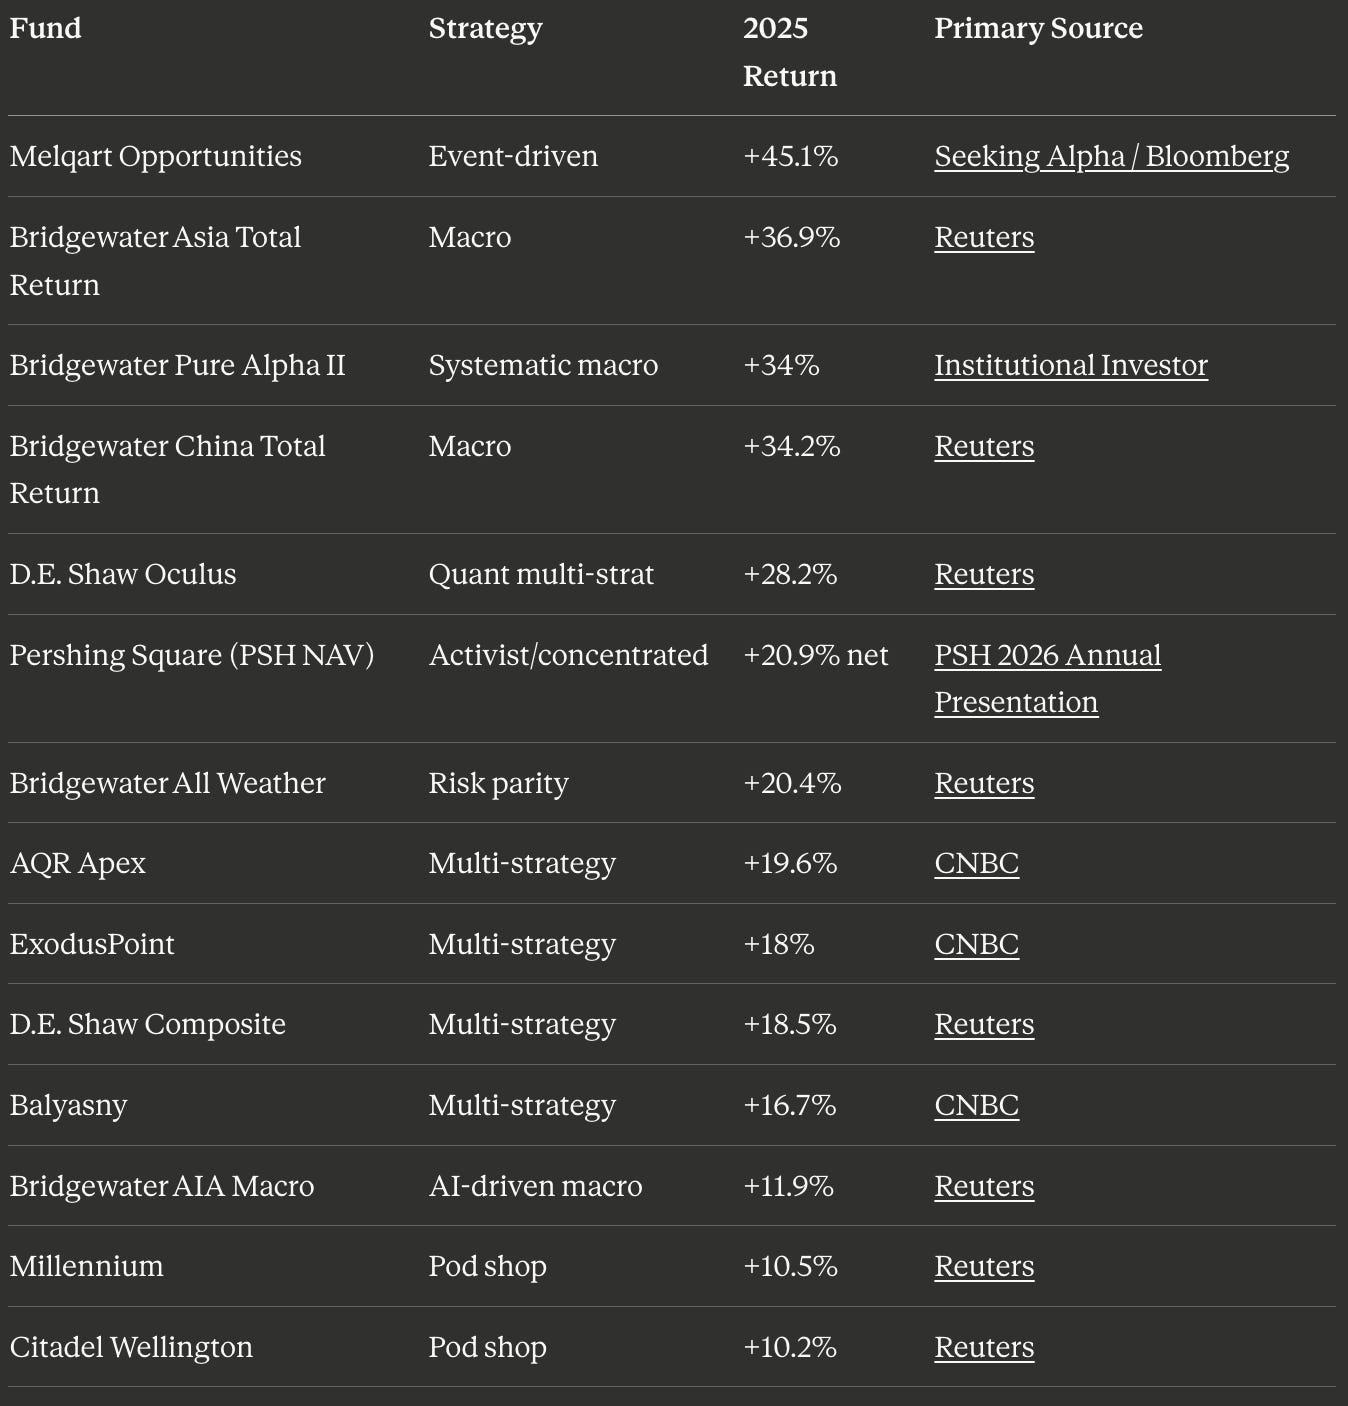
S&P 500 full-year 2025 return for reference: +16.97% (price return) / +17.9% (total return including dividends, per PSH 2026 Annual Presentation)
🔬 Want the full trade-by-trade forensic breakdown behind these numbers? Every position, every primary source quote, every confirmed vs. inferred label, and every extractable lesson for future strategy — in the extended Patreon version. → Read the full analysis on Patreon
The Macro Map: How the WTO Data Became a Trading Framework
The structural signal from the WTO deserves re-reading through a portfolio lens. Director-General Ngozi Okonjo-Iweala’s September 4, 2025 essay noted that US trade-weighted tariffs had reached 18.4%, but crucially observed that 72% of global goods trade continued on standard MFN tariff terms. Chinese exports were not disappearing: they were diverting to other markets as US-China bilateral flows contracted.
This framework — trade diversion, not contraction — was the precise macro template and translated directly into executable positions. Long non-US beneficiaries of Chinese trade diversion (Vietnam, Mexico, Southeast Asia). Long currencies of trade-diversion destinations. Short dollar (if net US import volumes fall, the current account deficit narrows, reducing foreign capital needed to finance it — Druckenmiller’s exact articulated thesis). Long gold as reserve currency hedging accelerated by tariff weaponization. The WTO’s own analysis made these positions legible. Most market participants looked at the trade war as a binary shock. The funds that read it as a regime shift — structural, persistent, expressing across currencies, bonds, commodities, and legal markets simultaneously — made 30%+.
The Unfinished Trade
The Supreme Court’s ruling did not close the book. Trump immediately pivoted to Section 122 of the Trade Act of 1974 to impose a fresh 15% global tariff. Penn Wharton confirms that up to $164.7 billion in tariff revenue through January 2026 is now subject to refund claims. As The American Prospect detailed, roughly 150 companies including Costco already had existing refund lawsuits before the Court of International Trade before the ruling.
The refund claim buyers — King Street, Anchorage, Fulcrum — bought at 20 cents. The claims repriced to 40 cents on the ruling. Whether they ultimately recover at par requires navigating CBP protests, Post Summary Corrections, and an adversarial administration. Justice Kavanaugh, in his own dissent, predicted a “mess”. That mess is the ongoing trade.
Druckenmiller’s book — short dollar, long copper, long gold, long Japan and Korea — is live. Jones’s blow-off top scenario is positioned. Bridgewater’s systematic diversification has no reason to unwind in a regime of “easing monetary policy and transformation of technology,” as Jensen put it.
The WTO’s September 2025 warning — “the status quo is not an option” — remains accurate. For the funds that mapped it correctly: the status quo was very profitable indeed.
📊 Read the Full Extended Version
This Medium article is the narrative overview. The complete forensic document — trade-by-trade tables with verdict labels, primary source quotes for every claim, the full $164.7B tariff refund market mechanics, Bridgewater’s architectural breakdown, pod shop structural penalty analysis, and six replicable patterns for future macro regimes — is published on Patreon.
→ Read the full 2025 Tariff Regime: Trade Forensics on Patreon
By joining, you’ll be supporting independent institutional-grade research and motivating more content like this. → Join the Patreon community here
About the Author
Navnoor Bawa is a Quantitative Researcher publishing institutional-grade analysis at the intersection of macro, systematic trading, and market structure.
📺 YouTube — Watch the video breakdown of this article: youtu.be/04alaj7llaY · Full channel: youtube.com/@TheMathematicalTrader
💼 LinkedIn — Research, commentary, and professional updates: linkedin.com/in/navnoorbawa
🔬 Patreon (full article) — Read the complete forensic breakdown: 2025 Tariff Regime: Trade Forensics
🔬 Patreon (membership) — All future institutional-grade research: patreon.com/NavnoorBawa
Primary sources: All performance figures from Bloomberg, Reuters, Institutional Investor, CNBC, and direct fund documents. Interview sources: Morgan Stanley Hard Lessons / Stan Druckenmiller (January 30, 2026, published February 27, 2026), CNBC Squawk Box / Paul Tudor Jones (May 6, 2025 and October 6, 2025), NPR All Things Considered / Mary Childs reporting on Wes Harrell (February 25, 2026), Pershing Square Holdings 2026 Annual Investor Presentation (February 11, 2026). Court/regulatory sources: Penn Wharton Budget Model, Cboe VIX Attribution Data, Better Markets Basis Trade Fact Sheet, Holland & Knight IEEPA Ruling Analysis. Key corrections applied to this version: Fannie/Freddie 2025 full-year gains updated from 60%/32% to 227%/211% per PSH 2026 Annual Presentation; S&P 500 return clarified as 16.97% price / 17.9% total return; market wipeout figures noted as $5–6T with source variance; ITRAXX index name corrected to ITRAXX Main. This article is for informational purposes only and does not constitute investment advice.
Cover photograph: Evan Blaser from san francisco, ca, usa, CC BY 2.0, via Wikimedia Commons.
Cover photograph: Evan Blaser from san francisco, ca, usa, CC BY 2.0, via Wikimedia Commons.