


An AI revolution built on physical infrastructure created an unexpected winner: Japan. But the real story isn’t macro — it’s three separate, stackable profit mechanisms running simultaneously, each sourced to primary documents. Here is every claim verified, every mechanism named, and every number traced to its origin.
🎥 Prefer watching over reading? A full video breakdown of this analysis is available on YouTube — generated via NotebookLM from the primary research behind this piece. → Watch the Video Overview here
Why the Framework Matters Before the Trades
On February 24, 2026, Goldman Sachs published a client note that put a name to what capital markets were already repricing. Authored by strategists including Guillaume Jaisson and Peter Oppenheimer, the note introduced the “HALO effect” — Heavy Assets, Low Obsolescence — and reported a stark empirical result: Goldman’s basket of capital-intensive stocks (GSSTCAPI) had outperformed its capital-light basket (GSSTCAPL) by approximately 35% since the start of 2025. “Markets are rewarding capacity, networks, infrastructure and engineering complexity — assets that are costly to replicate and less exposed to technological obsolescence,” Jaisson wrote.
The same week, Morgan Stanley confirmed the rotation independently: long-only funds in Europe were already reducing positions in stocks at risk of AI disruption at the end of 2025. Goldman’s software basket had posted its seventh consecutive daily decline in early February 2026, losing 19% year-to-date. The rotation was not speculative — it was already in the price.
The catalyst behind the shift: the five largest US hyperscalers are on track to spend $1.5 trillion building AI infrastructure between 2023 and 2026, compared with the roughly $600 billion they invested across their entire history before 2022. In 2026 alone, their capital expenditures are projected to exceed $650 billion — a figure Bloomberg called “a boom without a parallel this century,” encompassing Alphabet, Amazon, Meta, and Microsoft alone. This spending must run through physical supply chains, physical networks, and physical components. That is where Japan lives.
On February 26, 2026, the FT’s Leo Lewis articulated why Japan specifically is the densest concentration of HALO assets on the planet: decades of industrial policy that kept asset-heavy businesses alive, niche manufacturing that was too specific for Chinese or South Korean competition, and a breadth of industrial coverage that looks like waste until the supply chains start breaking. According to Jefferies quant strategist Shrikant Kale, the average Japanese company is exposed to 2.3 sectors versus 1.5 for US and European peers, and only a third of Japanese companies are pure plays, compared to two-thirds in the US and Europe. That “craziness” is now a strategic moat.
Three separate profit machines have been operating in parallel. Here is how each one actually worked.
Machine 1: The Yen Carry Trade — Documented in Buffett’s Own Words
The P&L, Directly from the Primary Source
Warren Buffett began purchasing shares in Japan’s five largest sogo shosha (diversified trading conglomerates) — Itochu, Marubeni, Mitsubishi, Mitsui, and Sumitomo — in July 2019. He described the discovery with unusual candor at Berkshire’s 2025 annual meeting: “I was just going through a little handbook that probably had two or three thousand Japanese companies in it. There were these five trading companies selling at ridiculously low prices. So I spent about a year acquiring them.” (CNBC, September 30, 2025)
The trade mechanics are laid out precisely in Buffett’s February 2025 annual letter to shareholders: “We like the current math of our yen-balanced strategy. The annual dividend income expected from the Japanese investments in 2025 will total about $812 million and the interest cost of our yen-denominated debt will be about $135 million.”
That is $677 million in annual net carry — before any capital appreciation. The spread is generated by a structural mismatch: Berkshire issued approximately ¥1.3 trillion in yen-denominated bonds — more than any other American company — at rates ranging from roughly 0.5% to 2–3%, and deployed the proceeds into the five companies paying approximately 4% dividend yields at entry, with P/E ratios around 7x. The yen denomination on both sides provided a natural currency hedge: if the yen weakened, liabilities and assets moved together. Berkshire extracted the spread regardless of exchange rate direction.
The currency overlay produced an additional windfall. A weakened yen generated cumulative after-tax GAAP gains for Berkshire of $2.3 billion through year-end 2024, of which $850 million was recognized in 2024 alone — the gains are periodically recognized in income as required by GAAP rules.
The Capital Appreciation
At year-end 2024, Berkshire’s aggregate cost basis was $13.8 billion and the market value of holdings totaled $23.5 billion. By March 2025, Berkshire had raised its stakes to between 8.5% and 9.8% in all five companies — approaching a previously agreed 10% ceiling, which the companies have since agreed to relax. The five ADRs had returned an average of 17.5% annually since July 2019, versus 6.0% for the Morningstar Japan Index. The five companies are described by Buffett in his own letter as having “shareholder-friendly policies of dividend boosts and stock buybacks” and management compensation “far less aggressive” than US counterparts.
Buffett’s stated intention: “I expect that Greg [Abel] and his eventual successors will be holding this Japanese position for many decades.” (CNBC, February 22, 2025)
Elliott Followed the Blueprint
In April 2024, Elliott Management disclosed a stake of “several tens of billions of yen” in Sumitomo Corp — one of Buffett’s five trading houses — the lowest-valued of the group at entry, with a forward P/E of 9.5 and PBR of 1.1. (Fortune Asia, April 29, 2024) Elliott had watched Buffett’s February 2024 letter send Mitsui and Mitsubishi to record highs after Buffett called the five companies’ shareholder policies “much superior” to US firms. The trade logic was identical; the instrument was the same; only the entry price was different.
Machine 2: The TSE Governance Arbitrage — A Regulator-Backed Catalyst
Most Western coverage treats the Tokyo Stock Exchange’s 2023 governance campaign as a macro tailwind. Practitioners know it is a specific, time-bounded mechanism for unlocking trapped balance sheet value — and its hard deadlines created a structural urgency that prior soft-governance campaigns never had.
The Mechanism
On March 31, 2023, the TSE formally requested all Prime and Standard Market companies to “implement management that is conscious of cost of capital and stock price,” with explicit emphasis on companies trading below 1x book value. The TSE published this as an official statement to all listed companies — notably without mandating compliance under listing rules, instead relying on voluntary initiative backed by reputational pressure. In January 2024, it began publishing a public monthly list of compliant and non-compliant companies — generating what the TSE’s own New York Office described in an October 2025 Harvard Law School Forum on Corporate Governance post as “peer pressure” that “intensified within industries, further promoting responses from companies.”
The results, measured by the TSE itself: average PBR improved from 1.1 in July 2022 to 1.4 by mid-2025 (a three-year span), while average ROE rose from 8.4% to 9.0%. By March 2025, the Prime Market disclosure rate exceeded 90%. By 2024, the TSE recorded 94 delistings — the highest since 2013 and the first-ever decrease in total listed companies — as the exchange enforced consequences.
For activist hedge funds, the translation was direct: a company at 0.6x PBR with cash covering half its market cap, subject to a public regulator demand for improvement, with its peers moving to comply, is not a thesis — it is a mechanics problem.
Elliott’s Full Japan Playbook
Elliott Management’s Japan campaign was not one stake — it was a coordinated multi-target program leveraging this regulatory pressure as external leverage across every position:
Mitsui Fudosan (February 2024): Elliott built at least a 2.5% stake in Japan’s largest property developer and demanded a ¥1 trillion ($6.74 billion) share buyback and the sale of a $3.6 billion stake in Oriental Land (Tokyo Disneyland operator). Mitsui Fudosan shares surged as much as 11.8% on the news to a record 4,100 yen on the highest volume since the COVID crash, then powered almost 20% higher through end-March 2024. The company subsequently responded with an amended long-term plan including higher dividend, a buyback, higher EPS growth target, and higher ROE target.
Tokyo Gas (November 2024): Elliott disclosed a 5.03% stake in a filing to Japan’s Finance Ministry and signaled it may make “important proposals.” Elliott’s position: the company should sell more than 75 real estate properties and projects, including the Park Hyatt Tokyo hotel, potentially worth ¥1.5 trillion combined. Tokyo Gas shares jumped 15% intraday — the largest move since 1987.
Sumitomo Corp (April 2024): The trading house follow-on position described above.
The Japan Times noted that Elliott “has kept quiet on most of its Japan investments” — meaning public positions represent a floor, not the ceiling, of Elliott’s exposure.
The broader activist wave: Bloomberg data estimated the ten largest activist funds deployed approximately JPY890 billion (~$6.1 billion) into Japanese equities in just the first half of 2025 — on pace to exceed the full-year 2024 record. Specialists launched into the gap: RFM, a Japan-focused hedge fund, raised $800 million in its first year of operation as of December 2025, with its pitch anchored on the Topix’s 8.4% five-year annualized dollar return.
Machine 3: AI Supply Chain Monopoly — The Least Covered, Highest-Returning Layer
This is the part of the Japan HALO trade that surface-level coverage consistently misses. The returns here are not driven by governance arbitrage or carry spread — they are driven by physical monopolies in materials that the entire AI industry depends on, cannot substitute, and cannot build around until at least 2027–2028.
Fujikura: 1,400% in Two Years From a 140-Year-Old Cable Company
Fujikura Ltd. (TSE: 5803), founded in 1885, traces its modern relevance to a single fact: it produced the world’s first optical fiber in 1959 — a claim corroborated by Reuters and widely reported across major financial outlets. Its ultra-high-density cables have the smallest diameters in the industry, enabling AI data center installations without additional infrastructure tunneling. The company exports approximately 75% of its output, with Alphabet (Google) as one of its largest customers.
The financial results speak in a way that requires no editorial overlay:
Stock up more than 400% in 2024 — best performer on the entire Nikkei 225, making it the sole addition from Japan to MSCI global standard indexes that November
Stock up approximately 1,400% over the trailing two years as of December 2025 (Bloomberg)
Stock up approximately 160% in 2025 alone as the White House in October 2025 selected it to supply up to $20 billion worth of fiber-optic cables for US AI infrastructure
Full-year operating profit guidance raised to ¥179 billion, up 26% from the previous forecast, in November 2025
CEO Naoki Okada, in a December 2025 Bloomberg interview: “I never imagined it would reach this point,” adding that as AI data center demand surged, the company “simply couldn’t meet the needs of all customers.” The company is now in talks for additional investment rounds as further capital expenditure is “necessary” to keep up with demand — a phrase Okada used verbatim with Bloomberg.
Morgan Stanley MUFG Securities (MSMS) analyst Yu Shirakawa raised Fujikura’s target price from ¥14,000 to ¥21,500 in December 2025. For Chikara Investments portfolio manager Richard Aston, who held the stock through the run, the case was straightforward: supply capacity constraints are real, but “in the current market conditions where demand expectations continue to be strong, their pricing power will help them manage production plans” (Bloomberg, December 2025).
Fujikura’s market capitalization by late 2025 placed it in the same league as Japanese industrial leaders like Daikin and Komatsu — from a position of having posted its first loss in more than a decade in 2020.
Nittobo: The World’s Only Reliable T-Glass Supplier — and the Physics of Why
Nitto Boseki (TSE: 3110), a 127-year-old textile company, has become a critical chokepoint in the global AI chip supply chain. The reason is technical and precise.
TSMC’s CoWoS packaging — the process that bonds GPUs with high-bandwidth memory in Nvidia’s AI chips — requires an internal substrate core reinforced by Low-CTE (low coefficient of thermal expansion) fiberglass fabric. This material was, until 2025, exclusively supplied by Nittobo. According to TrendForce, Nittobo is the world’s only company capable of stably mass-producing top-grade T-Glass.
Why no competitor can replace it: T-Glass has two physical properties that standard E-Glass does not replicate at manufacturing scale. First, its low CTE means it expands at a rate closer to silicon’s, preventing substrate warpage during extreme temperature cycles in advanced packaging — warpage of even a few microns causes catastrophic chip yield loss. Second, its low dielectric constant (Low-Dk) reduces signal loss at 800G and 1.6T networking speeds inside AI server boards. These properties require a specific glass chemistry and industrial weaving tolerance that took decades to develop and cannot be rapidly reproduced. According to Techovedas/Global Tech Research, Nittobo owns approximately 80–90% of the global high-end T-Glass market and is the only company meeting Nvidia’s most stringent quality requirements.
The supply crisis is documented in primary-source detail:
Since the second half of 2023, Nittobo’s T-Glass production lines have been running at 100% capacity, with customers facing extended waiting periods
T-Glass prices surged to a historic $80–$100 per kilogram in 2025 on supply-demand imbalance
In August 2025, Nittobo issued a 20% across-the-board price increase for premium glass fiber materials — pricing power available only to a monopoly supplier
Nvidia, AMD, and Microsoft dispatched senior executives to Nittobo’s headquarters to negotiate priority allocation deals directly
Apple sent representatives to Japan to meet with Nittobo and Japanese government officials to secure greater production share
Nan Ya Plastics (Formosa Plastics Group) entered a formal partnership with Nittobo, agreeing to weave approximately 20% of Nittobo’s specialty glass fiber fabrics by 2027 — providing partial capacity relief while the core glass chemistry monopoly remains intact
Nittobo is preparing a next-generation T-Glass for 2028 targeting a 30% improvement in thermal expansion coefficient — locking in its technological lead further
J.P. Morgan maintained a Buy rating on Nittobo in February 2026 after the company reported a profit surge and raised its full-year outlook
Pelham Smithers Associates published a research note titled “The Science and Economics Behind Nittobo’s Stock Price Surge” the same week as the FT’s HALO piece in February 2026 — providing the semiconductor materials foundation for the pricing power argument that the FT’s column cited but did not unpack. (Pelham Smithers Associates, February 27, 2026)
Mitsui Kinzoku: What the Earnings Call Actually Said
Mitsui Kinzoku (TSE: 5706), a non-ferrous metals manufacturer, is the copper foil company Pelham Smithers named alongside Nittobo and Dowa as the core of the Japan materials HALO cluster. Unlike the macro framing, the investment case here comes from the company’s own Q2 FY2025 telephone conference transcript, which is a primary source document.
The internal breakdown from Mitsui Kinzoku’s November 2025 forecast slide deck: copper foil segment contributed ¥21.1 billion of the total ¥22.7 billion upward revision to full-year ordinary income — meaning copper foil drove 93% of the company’s entire earnings upgrade.
The announced numbers: operating income forecast raised to ¥117.0 billion from a prior ¥78 billion — a 50% upgrade, with both profit and revenue projected at record highs. Stock surged approximately 10% to a record 30,000 yen on the announcement. Annual dividend raised to ¥240 per share (¥100 interim + ¥140 year-end) under a progressive dividend policy targeting 3.5% dividend-on-equity.
Why copper foil has extreme pricing power at the AI tier: Circuit foil for multilayer boards in AI servers trades at a substantial multiple over commodity copper foil used in EV battery cells. Packaging substrate circuit foil for AI chip interposers commands an even larger premium. Orders for 2026 have already exceeded Mitsui Kinzoku’s installed capacity — a position in which the supplier sets prices.
Why Japan Specifically — The Industrial Policy Paradox
The three machines all run through the same country because of decisions Japan made 30 years ago that looked like mistakes at the time.
As Pelham Smithers assessed and the FT quoted directly: Japan’s stock market is “rammed with companies that score poorly on standard investor return metrics but suddenly look attractive due to the weird effect AI is having on both the economics of manufacturing and the destruction of moats in services.” The companies that were unloved for being too industrial, too diversified, and too asset-heavy are now the companies that AI cannot disrupt and the rest of the world cannot replicate quickly.
Jefferies data: the average Japanese company is exposed to 2.3 sectors versus 1.5 for US and European peers; only a third of Japanese companies are pure plays, against two-thirds in the US and Europe. The over-diversification that was cited as evidence of capital inefficiency turns out to have preserved the exact full-spectrum industrial base that the US is now trying to rebuild from scratch under re-industrialization policy.
Goldman Sachs has stated explicitly that Japanese companies are positioned to become compelling partners for American industry. The largest single investment project under the US-Japan tariff deal is a colossal gas turbine facility in the US — built to support AI energy demand, and almost certainly dependent on Japanese machinery and materials.
The Risk Register
Carry trade rate risk: The Bank of Japan raised rates to a 30-year high of 0.5% in 2025 and is expected to continue normalizing toward 1.0%. Buffett’s existing ¥1.3 trillion bond portfolio is at fixed rates and insulated for now, but new issuance costs rise with each BOJ hike, and a sharp yen appreciation (which historically accompanies BOJ tightening) would reduce the dollar-denominated value of positions for non-yen-hedged holders.
Materials monopoly substitution risk: Intel, AMD, and TSMC are actively developing glass substrate technology that could ultimately bypass T-Glass cloth in future chip packaging designs. However, glass substrates currently cost 2–3x more than organic equivalents and run at 75–85% manufacturing yields versus 90–95% for organic substrates. Commercial-scale displacement is a 2028–2030 problem at the earliest, and Nittobo is simultaneously developing its next-generation T-Glass for the same window.
HALO thesis reversal risk: If AI model efficiency gains (the DeepSeek-style paradigm, where software improvements reduce hardware requirements) prove structural rather than transient, AI infrastructure capex could slow, removing the demand driver for Fujikura, Nittobo, and Mitsui Kinzoku. This is the scenario the FT’s own piece flagged: “The Halo trade could evaporate.”
Crowding risk: The easy governance arbitrage is already priced. PBR has moved from 1.1 to 1.4 and the largest discounts have narrowed. New activist entrants are working from a smaller starting gap.
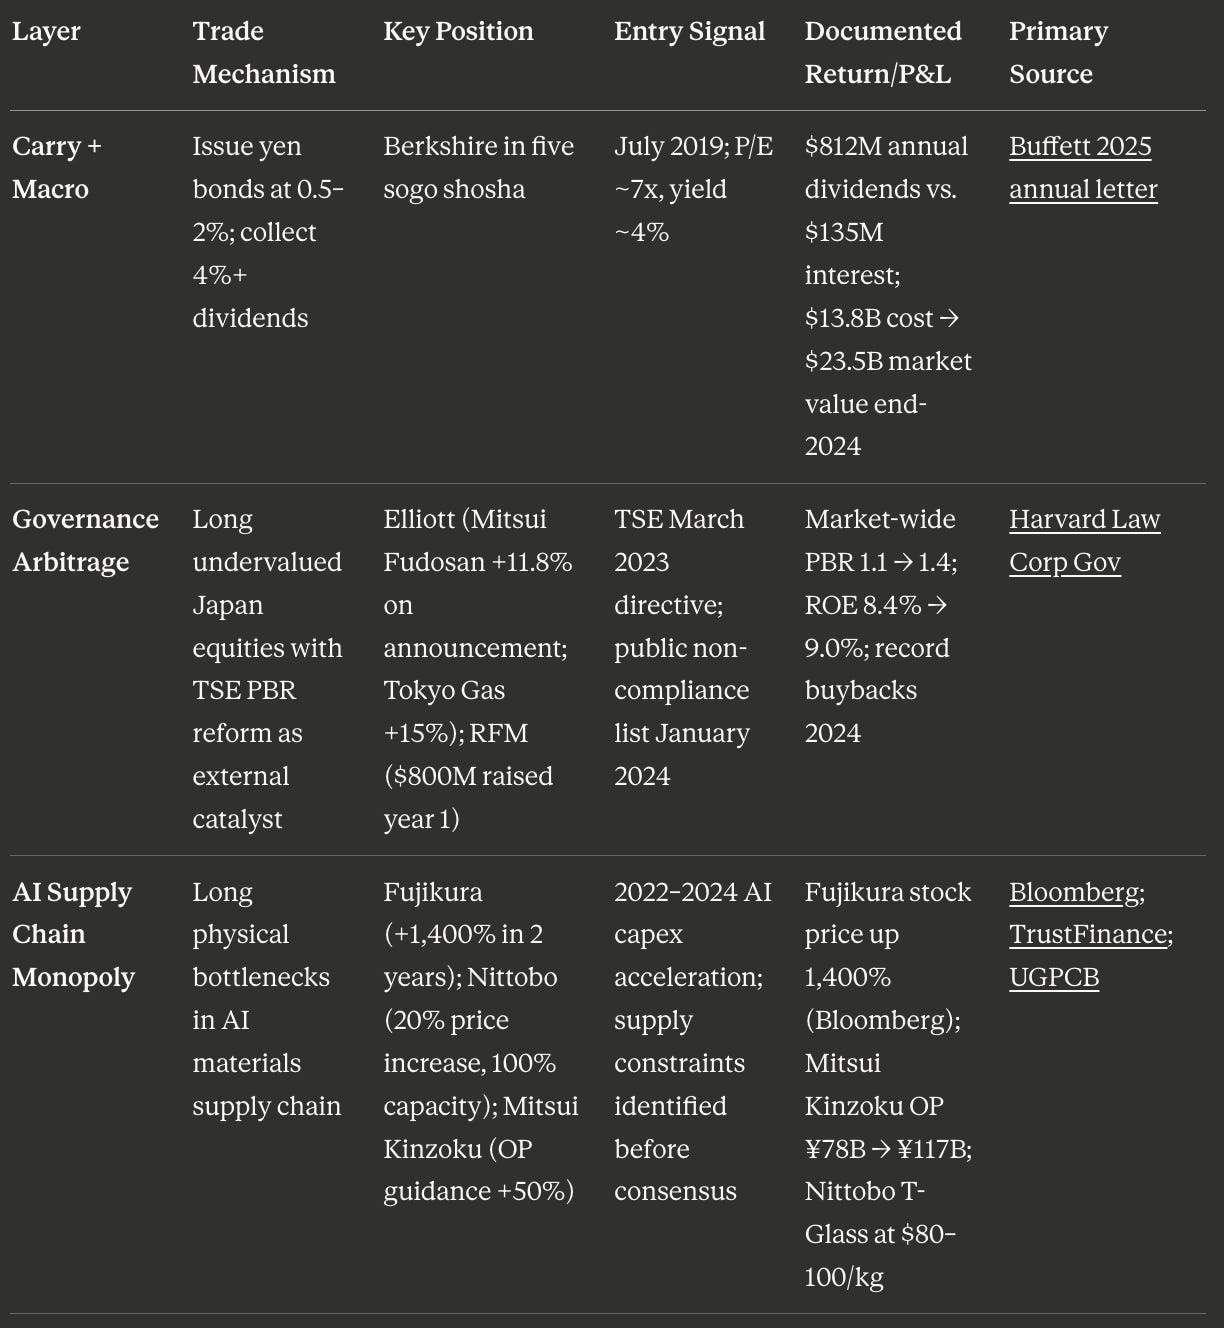
Summary: The Three-Layer Alpha Map
Bloomberg; TrustFinance; UGPCB
📊 Want the Full Institutional-Grade Breakdown?
The companion deep-dive to this article is now live on Patreon — it includes the complete trade-by-trade reference with every number tagged by epistemic status (confirmed vs. inferred vs. incorrect), the full error log from the verification process, and a 60-second mental model for reconstructing the entire thesis before executing.
→ Read the Full Trade Reference on Patreon
This research took a very long time of data collection, verification, and analysis. If you found value in this deep-dive, I publish exclusive quantitative research, trading strategies, and institutional-grade analysis for subscribers.
→ Join the Patreon community here
The Japan HALO trade produced exceptional alpha because it was not one trade. It was three independent sources of return — carry, governance, and supply chain monopoly — operating simultaneously in a single geography, concentrated there by an industrial policy that the rest of the world had spent three decades criticizing. The funds and investors who understood all three layers and held through the years when Japan was a “zombie economy” are now collecting returns that compound the patience of that holding period.
The position with the most remaining runway is the one most people haven’t looked at: the specialty materials layer, where production capacity is still constrained through 2027, orders are already outstripping installed supply, and the companies themselves are still small enough that institutional ownership is sparse.
All sources are inline hyperlinks. Primary sources used throughout: Buffett 2025 Annual Letter | Goldman Sachs HALO note via Bloomberg/Yahoo Finance | FT — Japan ultimate HALO trade | CNBC — Buffett Japan 2025 | CNBC — Buffett origin story | WisdomTree — carry trade mechanics | Morningstar — 17.5% annual return | Fortune — Elliott + Sumitomo | CNBC — Elliott + Mitsui Fudosan record high | Japan Times — Tokyo Gas Elliott 5.03% stake | Harvard Law — TSE reform data | Japan Exchange Group — TSE directive source | Fortune — Fujikura 400% in 2024 | Bloomberg — Fujikura 1,400% + Okada interview | Webull — Okada exact quote + $20B White House contract | FastBull — Fujikura 2025 data + 1959 optical fiber history | TrendForce — Nittobo world’s only T-Glass + Nan Ya partnership | TrendForce — T-Glass physics explainer | TrendForce — Nittobo 2028 next-gen T-Glass | Tom’s Hardware — Apple, Nvidia, AMD exec visits to Nittobo | UGPCB — T-Glass $80–100/kg price, 100% capacity | Techovedas — Nittobo 80–90% market share, Nvidia CEO Japan visit | Digitimes — Nvidia, AMD, Microsoft exec visits | StockCrock Substack — 20% Nittobo price hike; glass substrate risk analysis | CommonWealth Magazine — Nittobo CoWoS exclusive history | Pelham Smithers Associates research note — HALO + Nittobo | Mitsui Kinzoku Q2 FY2025 earnings call transcript — MicroThin™ VSP™ | TrustFinance — Mitsui Kinzoku OP ¥78B → ¥117B | Globe and Mail — Mitsui Kinzoku dividend ¥240 | Investing.com — Mitsui Kinzoku record 30,000 yen | Japan Times — RFM $800M | TheStreet — Goldman software basket -19% YTD
About the Author
Navnoor Bawa publishes institutional-grade quantitative research, trading strategies, and deep-dive market analysis.
📺 YouTube: ▶ Watch this article as a video · The Mathematical Trader channel
💼 LinkedIn: Navnoor Bawa — market analysis and professional updates
📊 Patreon: Read the full trade reference for this article · Join for exclusive research
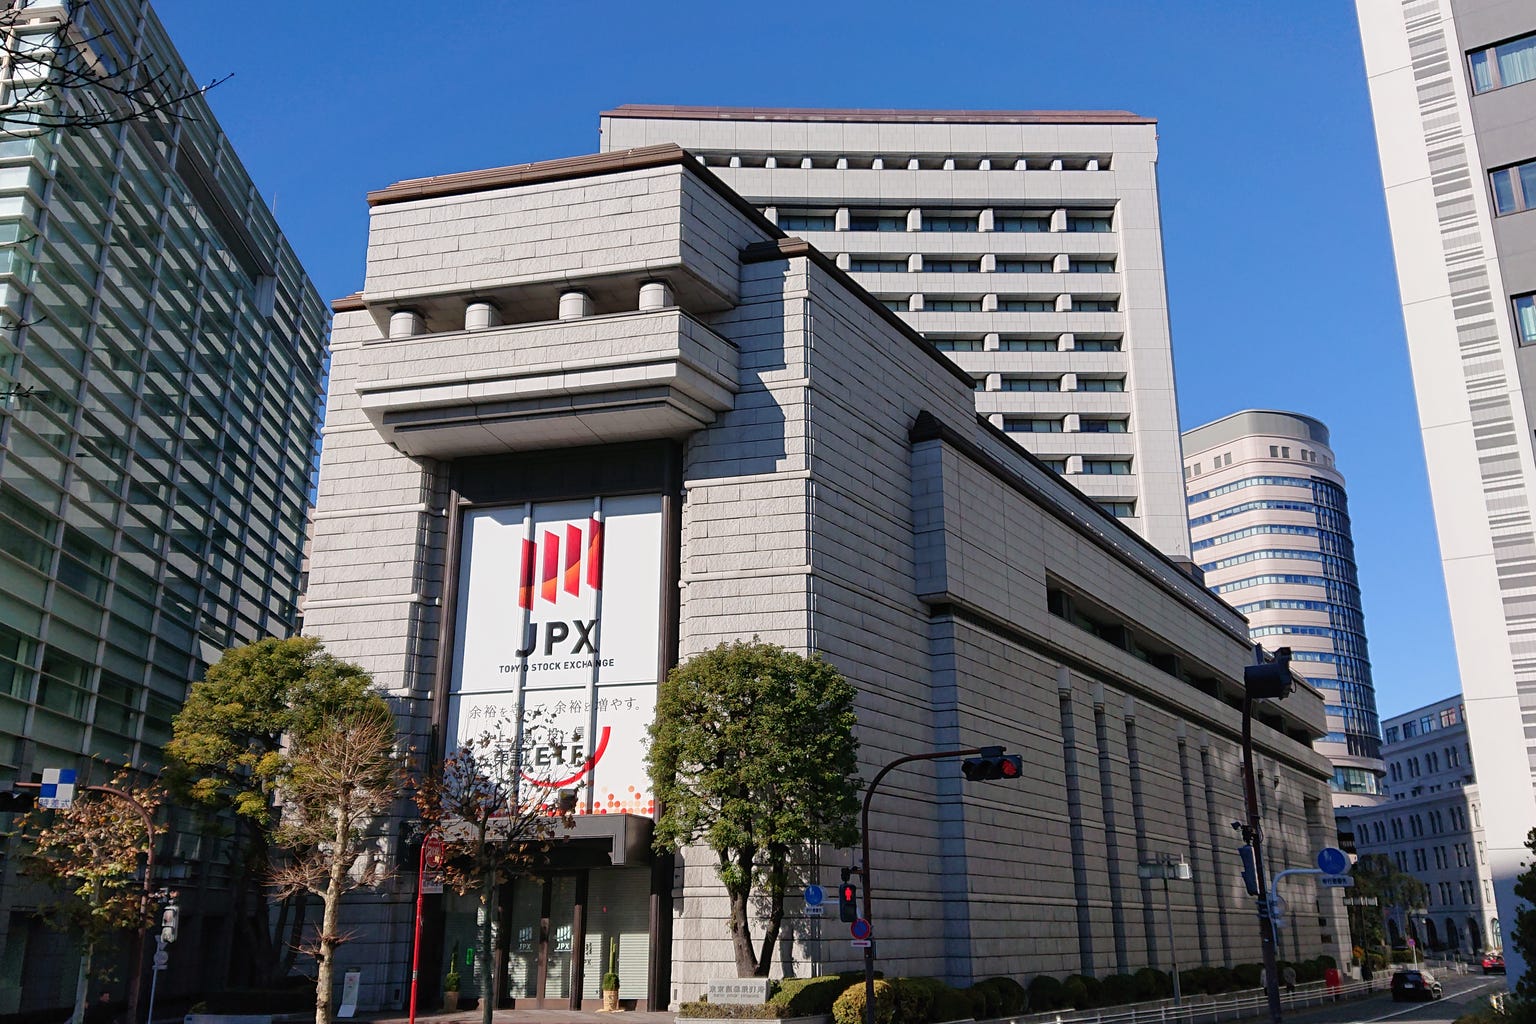
Cover photograph: Lombroso, CC BY-SA 4.0, via Wikimedia Commons.
Cover photograph: Lombroso, CC BY-SA 4.0, via Wikimedia Commons.