



What the SEC found, and what it priced at $400,000
On 27 July 2026 the Commission instituted settled cease-and-desist proceedings against Simplify Asset Management, a Las Vegas adviser with $9.63 billion in regulatory assets as of 31 July 2025, running 34 ETF series (Investment Company Act Release No. 36269, summarised on the Commission’s administrative proceedings page). Three findings, one penalty of $400,000.
Two are ordinary compliance failures and I will not spend your time on them: affiliate transactions with a seed investor holding roughly 25% of Simplify itself, and a macro fund whose value at risk ran to 291% of its reference portfolio while the board heard about it months later.
The third one is worth reading. Between July 2021 and June 2024, seven Simplify ETFs paid distributions that were partly a return of shareholders’ own capital without sending the contemporaneous notice that Section 19(a) and Rule 19a-1 require. That notice is a one-page statement splitting a distribution into net income, capital gains and paid-in surplus, so a shareholder does not mistake capital for earnings. Before 28 September 2023, none of the funds sent one at all.
Then the order does something I have rarely seen an enforcement document do. It publishes the underlying table, nine fund-years of income against return of capital, fund by fund. I recomputed all nine percentages from the dollar figures in the same row and every one reconciles to within half a basis point of rounding. The Commission’s own paragraph-46 cross-check, an 84% aggregate for the GBTC fund, comes out at 84.375%. The table is sound, which is why it is worth pushing on.
The consensus, stated the way its believers state it
Nobody should dismiss the prevailing reading of a high return-of-capital number, and I’d rather have it at full strength before departing from it.
It goes like this. A derivative income fund advertises a double-digit distribution rate. Its strategy can’t actually earn that, so the shortfall gets funded by handing investors their own capital back. Net asset value grinds lower. The headline yield stays high because the denominator shrinks with the numerator, and the investor mistakes a slow liquidation of his own position for income. Return of capital is the tell.
That’s the standard framing across the covered-call literature, stated flatly in the retail-facing analysis of funds like QYLD and JEPI: heavy return of capital usually means net asset value grinds unless the market bails you out. The mechanism is real. It’s destroyed real money. I’ve watched it do so.
There’s a second, more sophisticated layer of consensus, and I want to credit it properly because it anticipates part of my argument. The closed-end fund world worked this out more than a decade ago. Morningstar’s taxonomy, taught on Fidelity’s learning centre, splits return of capital into three kinds: pass-through, constructive (”from unrealized capital gains”) and destructive (”investors are literally receiving their own capital, minus expenses”). That same page warns that “to dismiss a CEF from investment consideration simply because it has distributed return of capital is unwise.”
John Cole Scott of Closed-End Fund Advisors put an arithmetic test under it on 30 September 2013: “We compare a CEF’s NAV Yield vs. 1-year NAV total return performance... if a CEF has a 1 year NAV TR that is above its NAV yield, then the distribution has been paid from NAV growth and thus is not destructive in nature.” He also measured the base rates, finding average return of capital running 15.08% for bond CEFs and 54.24% for equity CEFs.
So the distinction is not my discovery and neither is the test. My argument starts one step later, at a question nobody has answered with numbers: once you strip the distinction away, how well does the raw return-of-capital percentage work as a screen? The SEC has just mandated that raw percentage, monthly, across a cohort that never imported any of the machinery above.
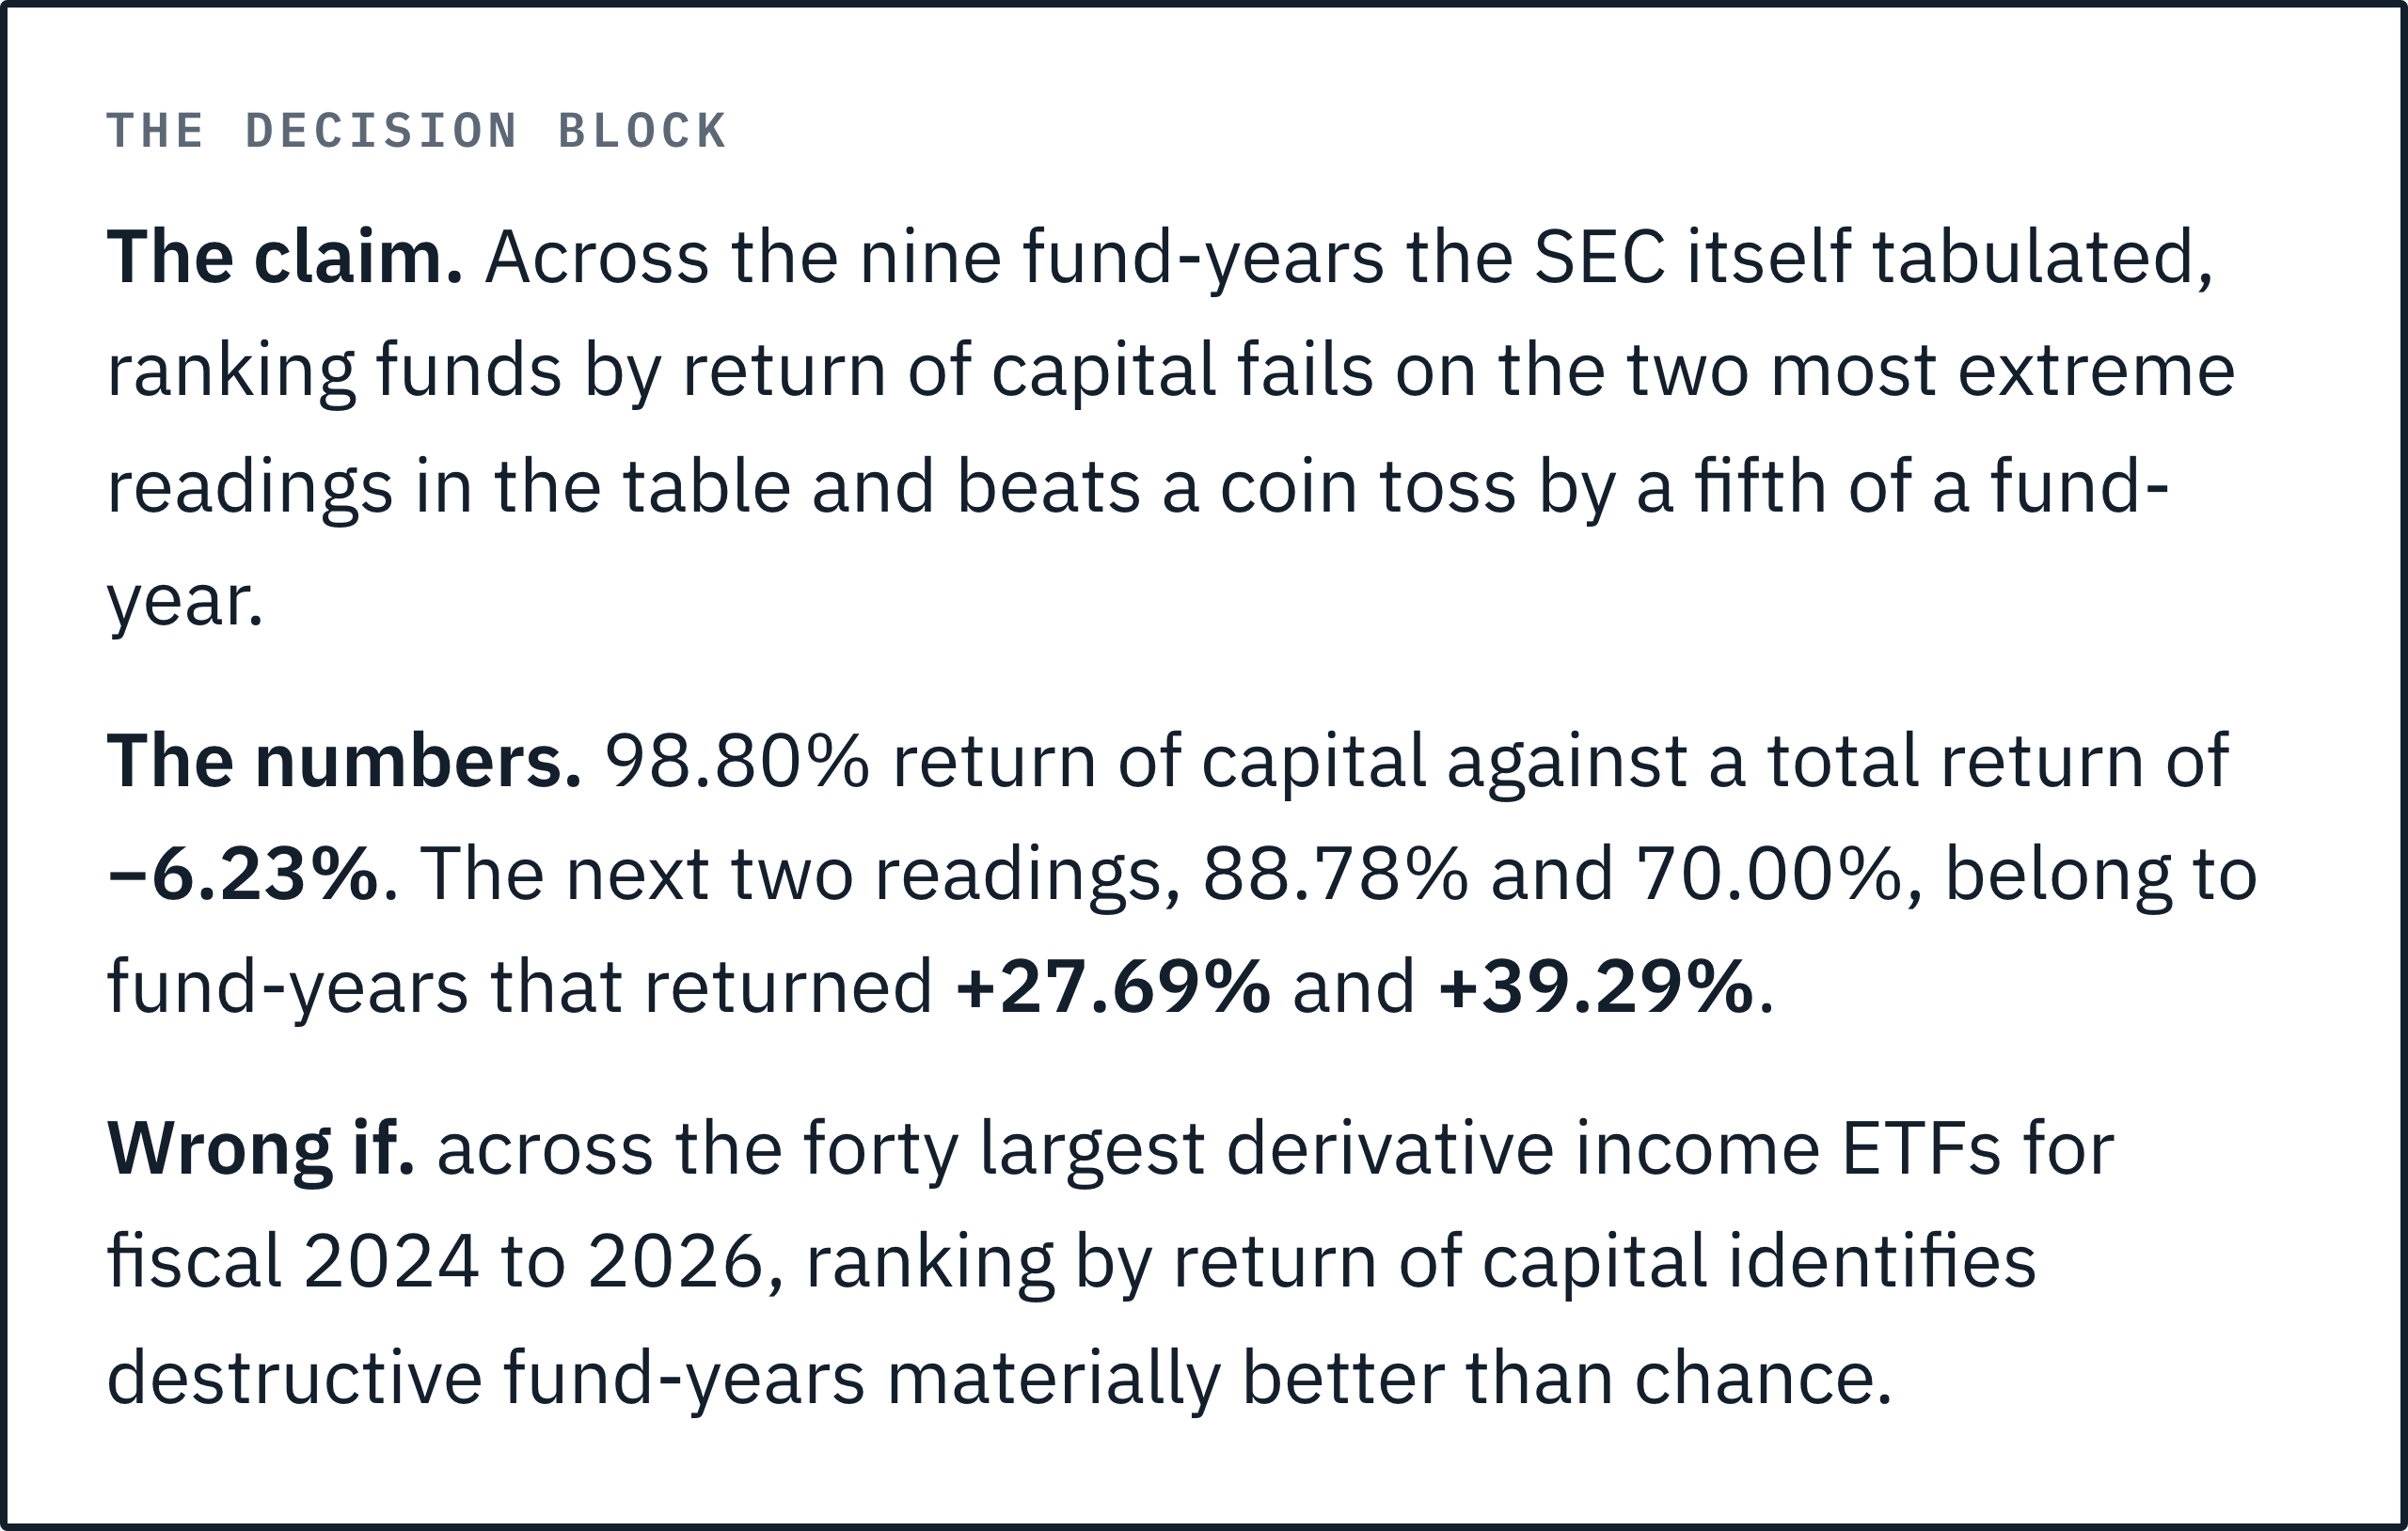
On the Commission’s own evidence, badly enough that I would not use it.
One thing I want to be scrupulous about before going further, because it would be easy to win an argument the Commission never entered. The SEC has not claimed that return of capital predicts returns. Its stated purpose in this order is narrower: that shareholders “will not believe that a fund portfolio is generating investment income when, in fact, distributions are paid from other sources.” That is a claim about disclosing a source, and on its own terms the order is correct and the funds were in breach. My argument is that for this particular cohort the source disclosure cannot do the work its 1940 rationale assumed, because the income bucket is near empty by construction whatever the portfolio does.
Nine fund-years, ranked by return of capital
I pulled the audited financial highlights for every fund-year in the Commission’s table, out of the N-CSR annual reports for fiscal 2022, 2023 and 2024, and set the return-of-capital percentage beside the total return the shareholder actually received.
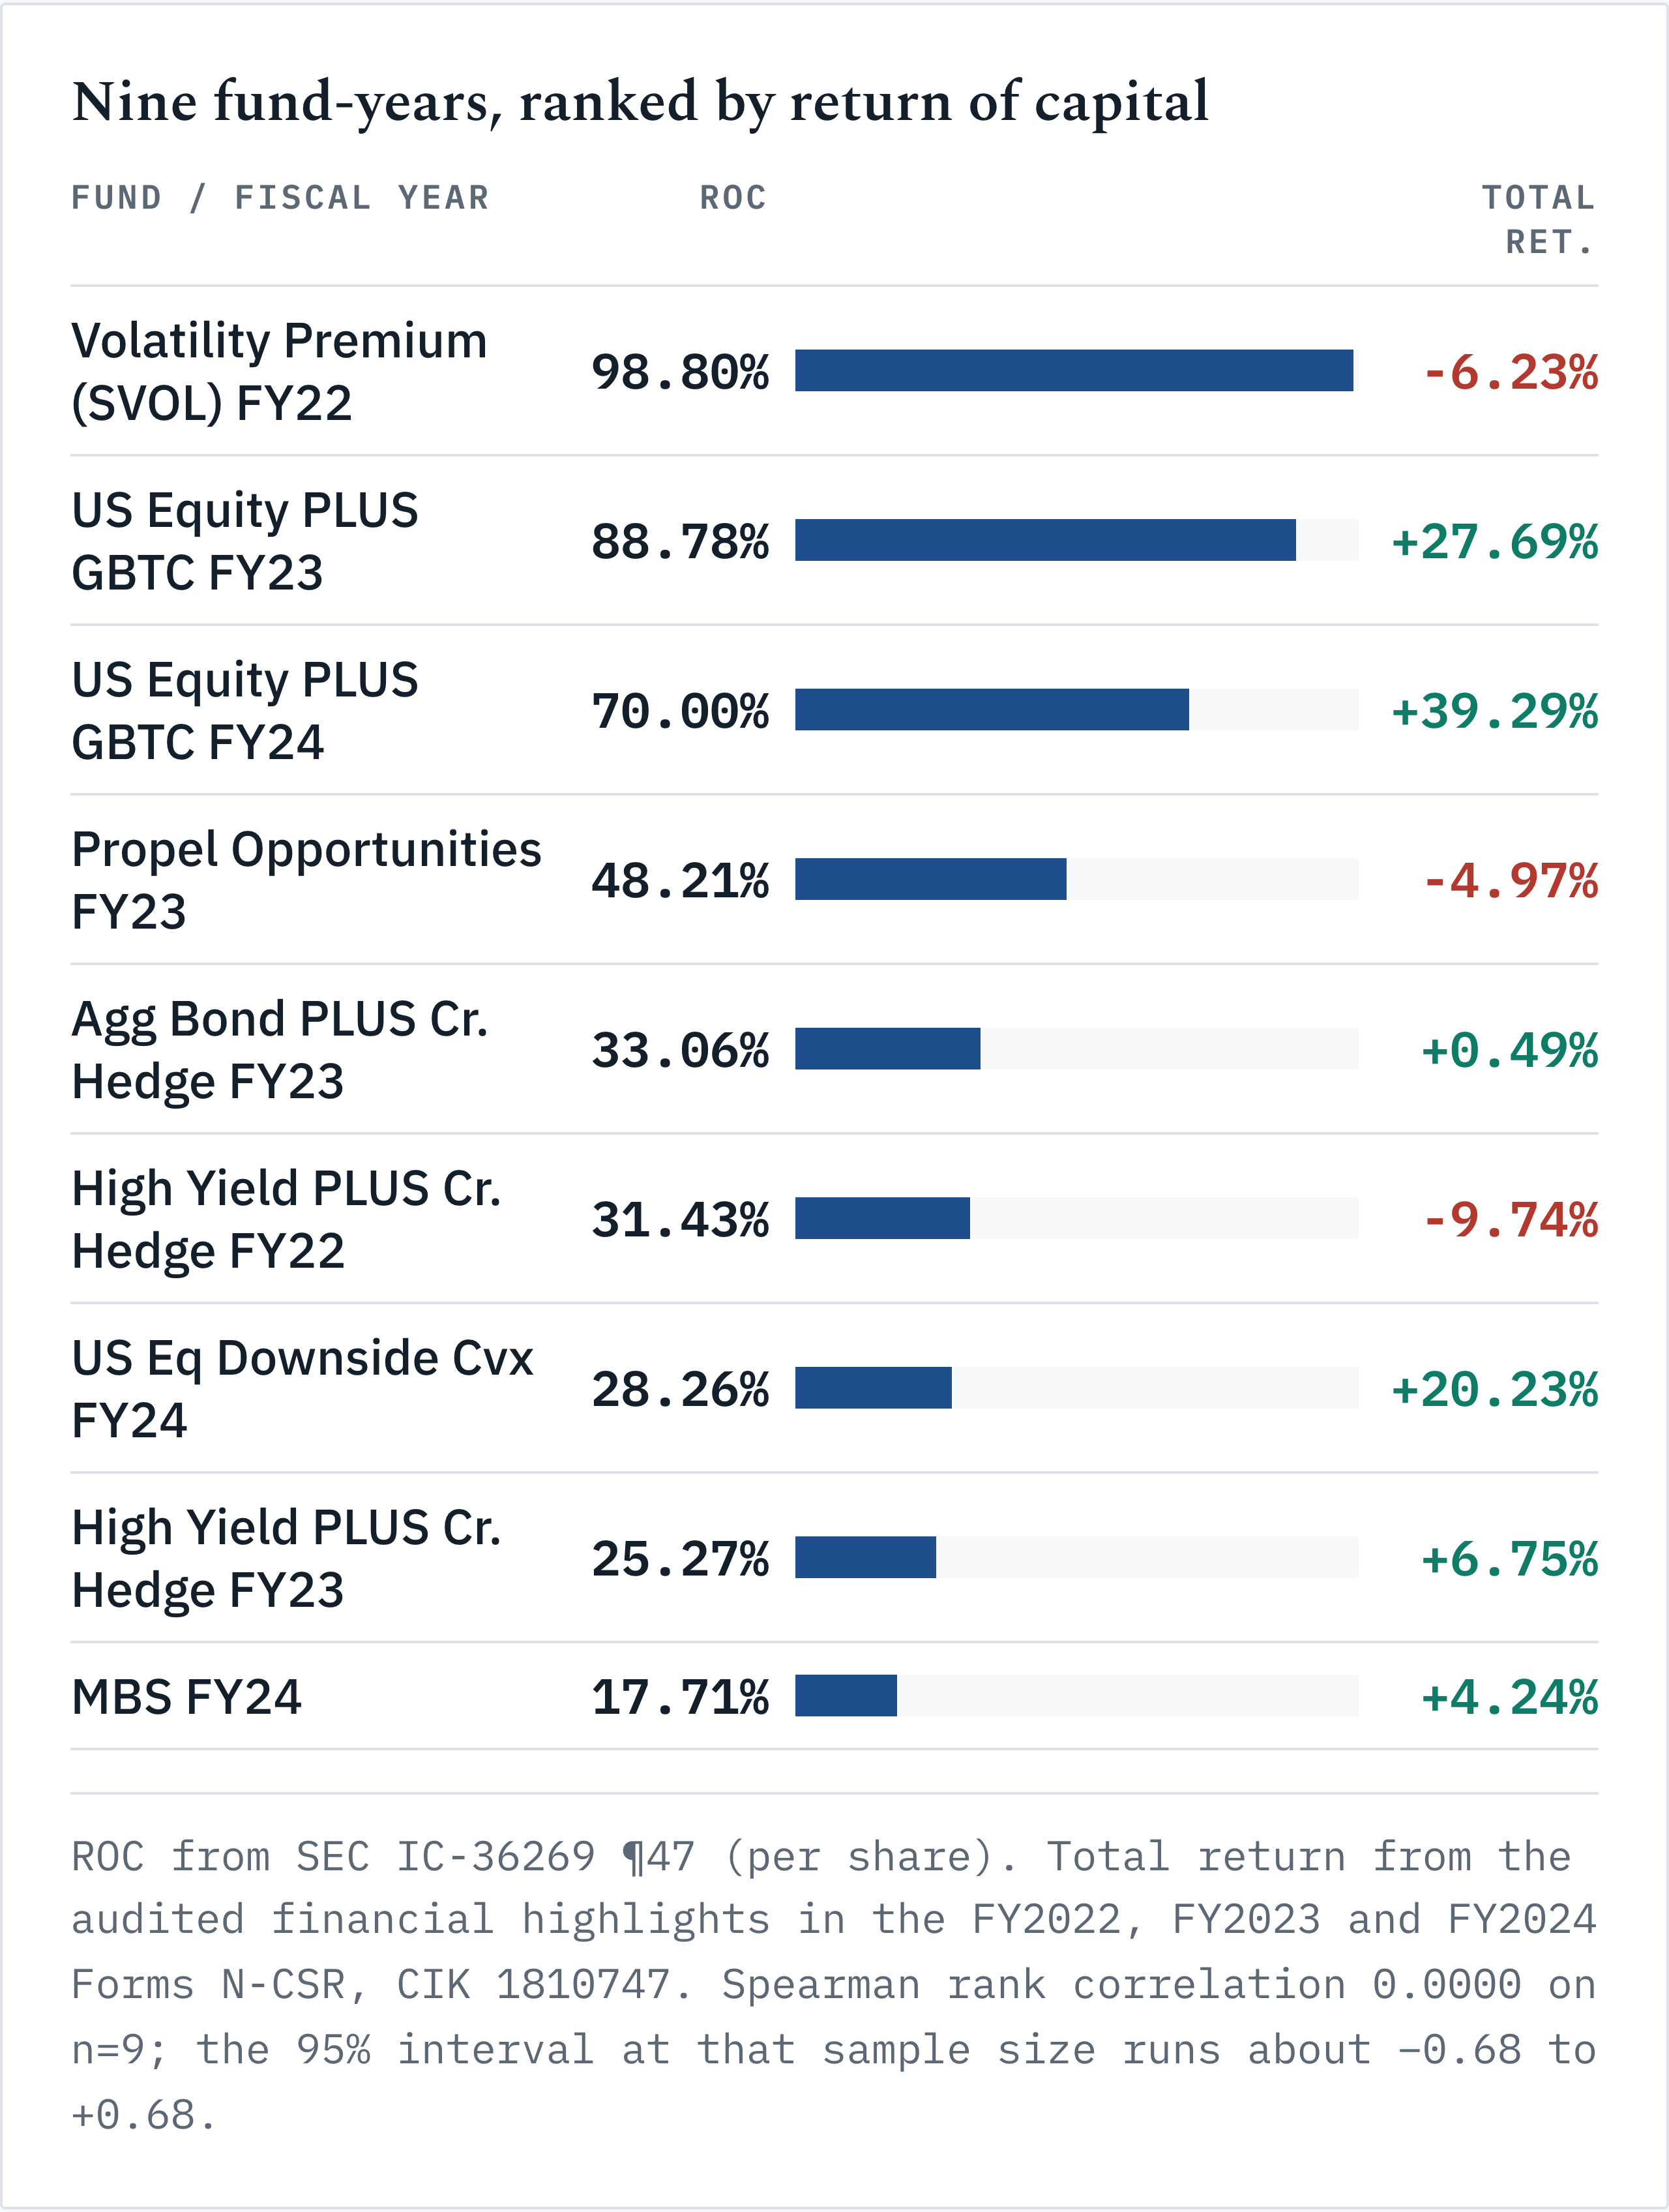
My first read was that I had made an error somewhere, so I rebuilt it from the filings twice. Read the top and the bottom. The worst return in the table, -9.74%, sits at 31.43% return of capital. The best, +39.29%, sits at 70.00%. The lowest reading produced a perfectly ordinary +4.24%.
Rank correlation between the two columns comes out at exactly zero. Sum of squared rank differences is 120, and 1 - 6(120)/(9 x 80) = 0 on the nose. I did not go looking for a round number, and I would not have published one I had to squint at. Pearson lands at +0.2668, explaining 7% of the variance and carrying the wrong sign for the consensus story: more return of capital, very slightly better outcomes.
Mean return of capital in the losing years was 59.48%. In the winning years, 43.85%. That gap runs the right way for the consensus, and it is nowhere near large enough to screen on with three losing observations.
The mechanism is an accounting boundary, not a business fact
Simplify’s own audited notes explain why the number behaves this way.
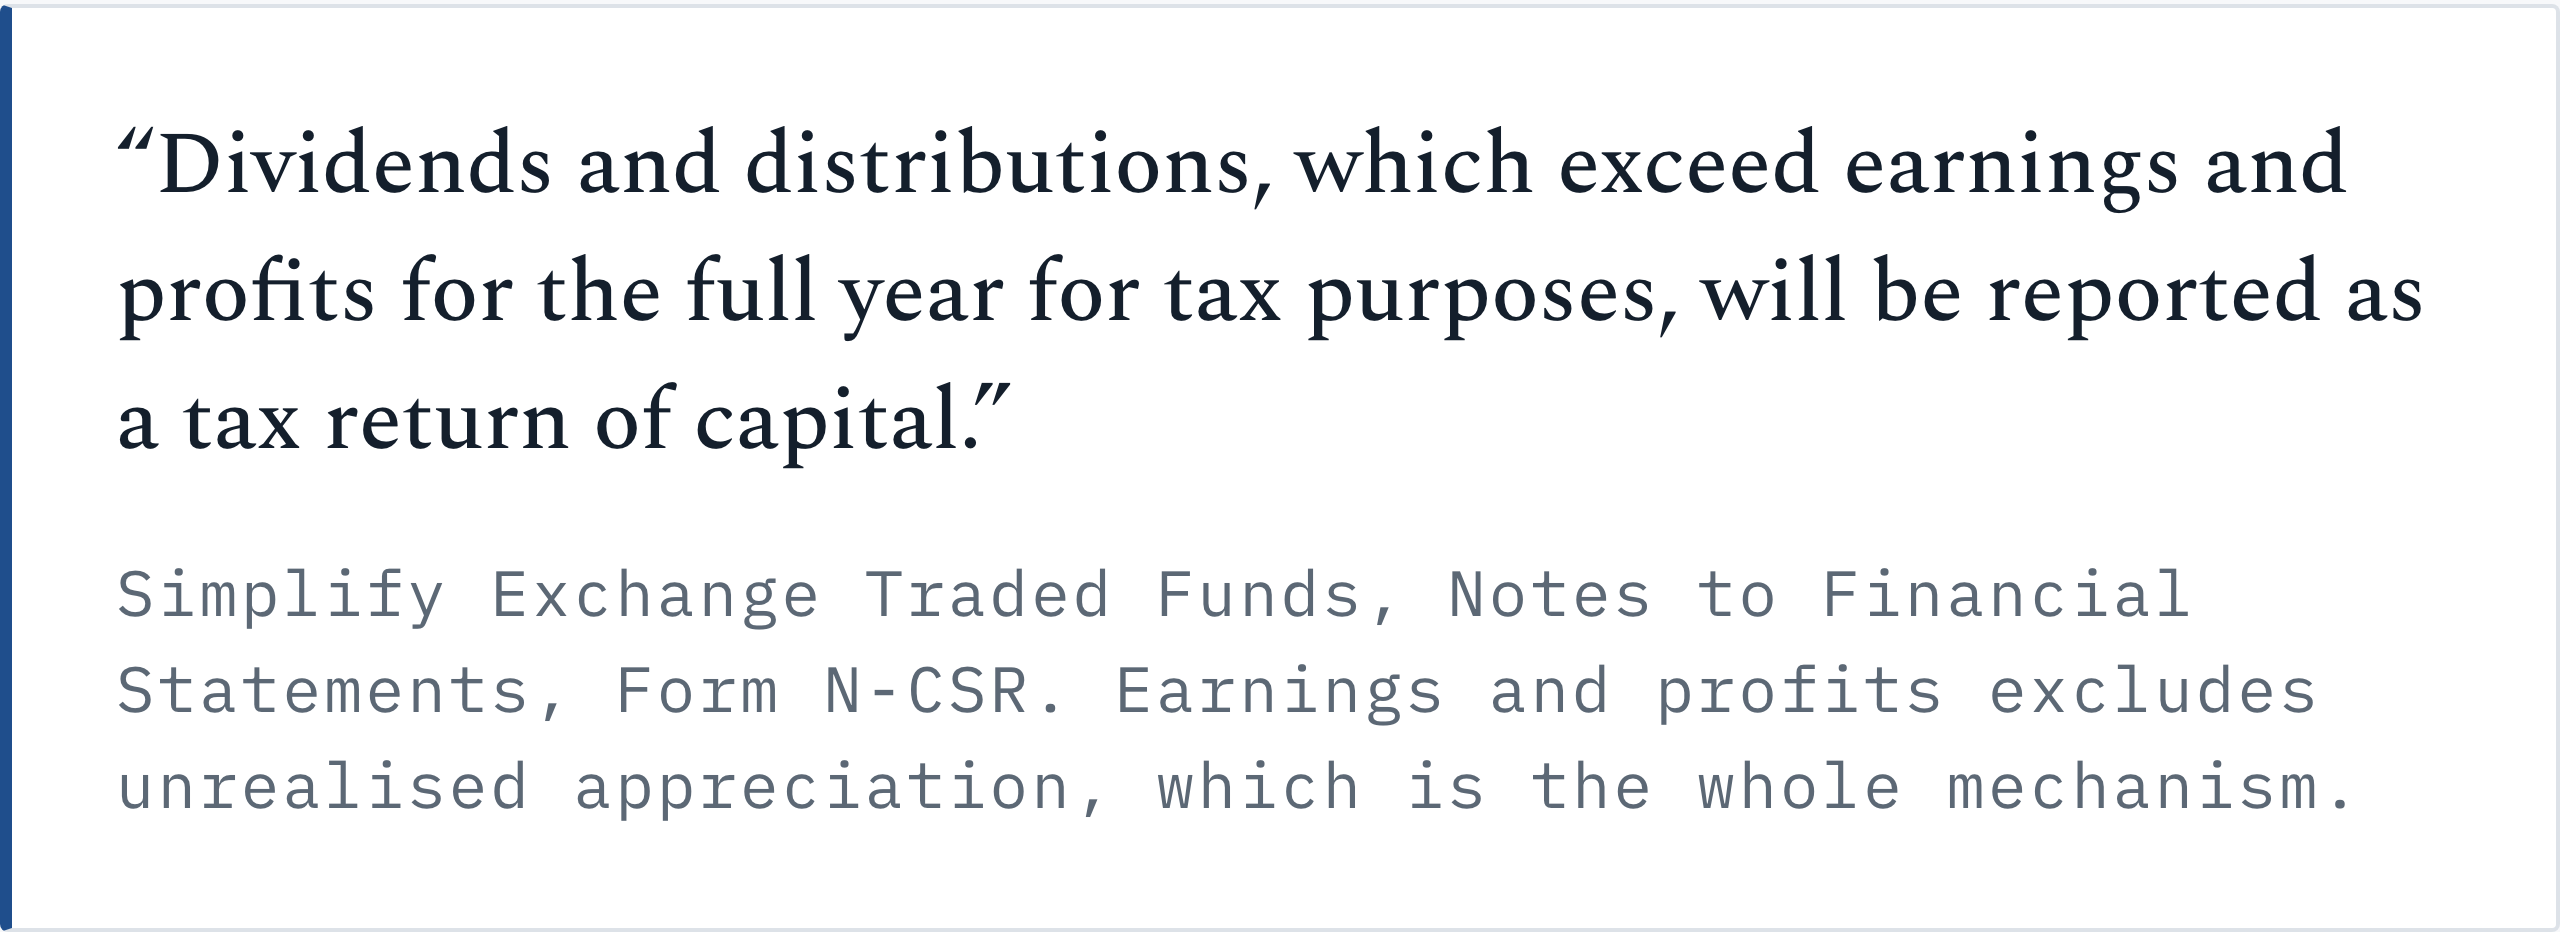
Earnings and profits is a tax concept, and what matters is what it leaves out. Unrealised appreciation is not earnings and profits. So a fund can be up 30% on the year, marked, audited and undisputed, and still have nothing distributable in the tax sense if those gains are open positions on 30 June.
That describes the GBTC fund exactly, and I checked the row against the audited statement rather than trusting my own summary of it. Its net asset value went from $20.43 to $24.98 in fiscal 2023 while it distributed $0.98. Total from investment operations, +$5.53 a share, of which net investment income was $0.18. Almost the entire return was price appreciation, most of it unrealised. So 88.78% of a distribution the fund had comfortably out-earned got stamped return of capital.
So I ran the same test on a single fund through time, which controls for manager, strategy and mandate at once. The Simplify Volatility Premium ETF sells volatility, and it has sold volatility the whole way through:
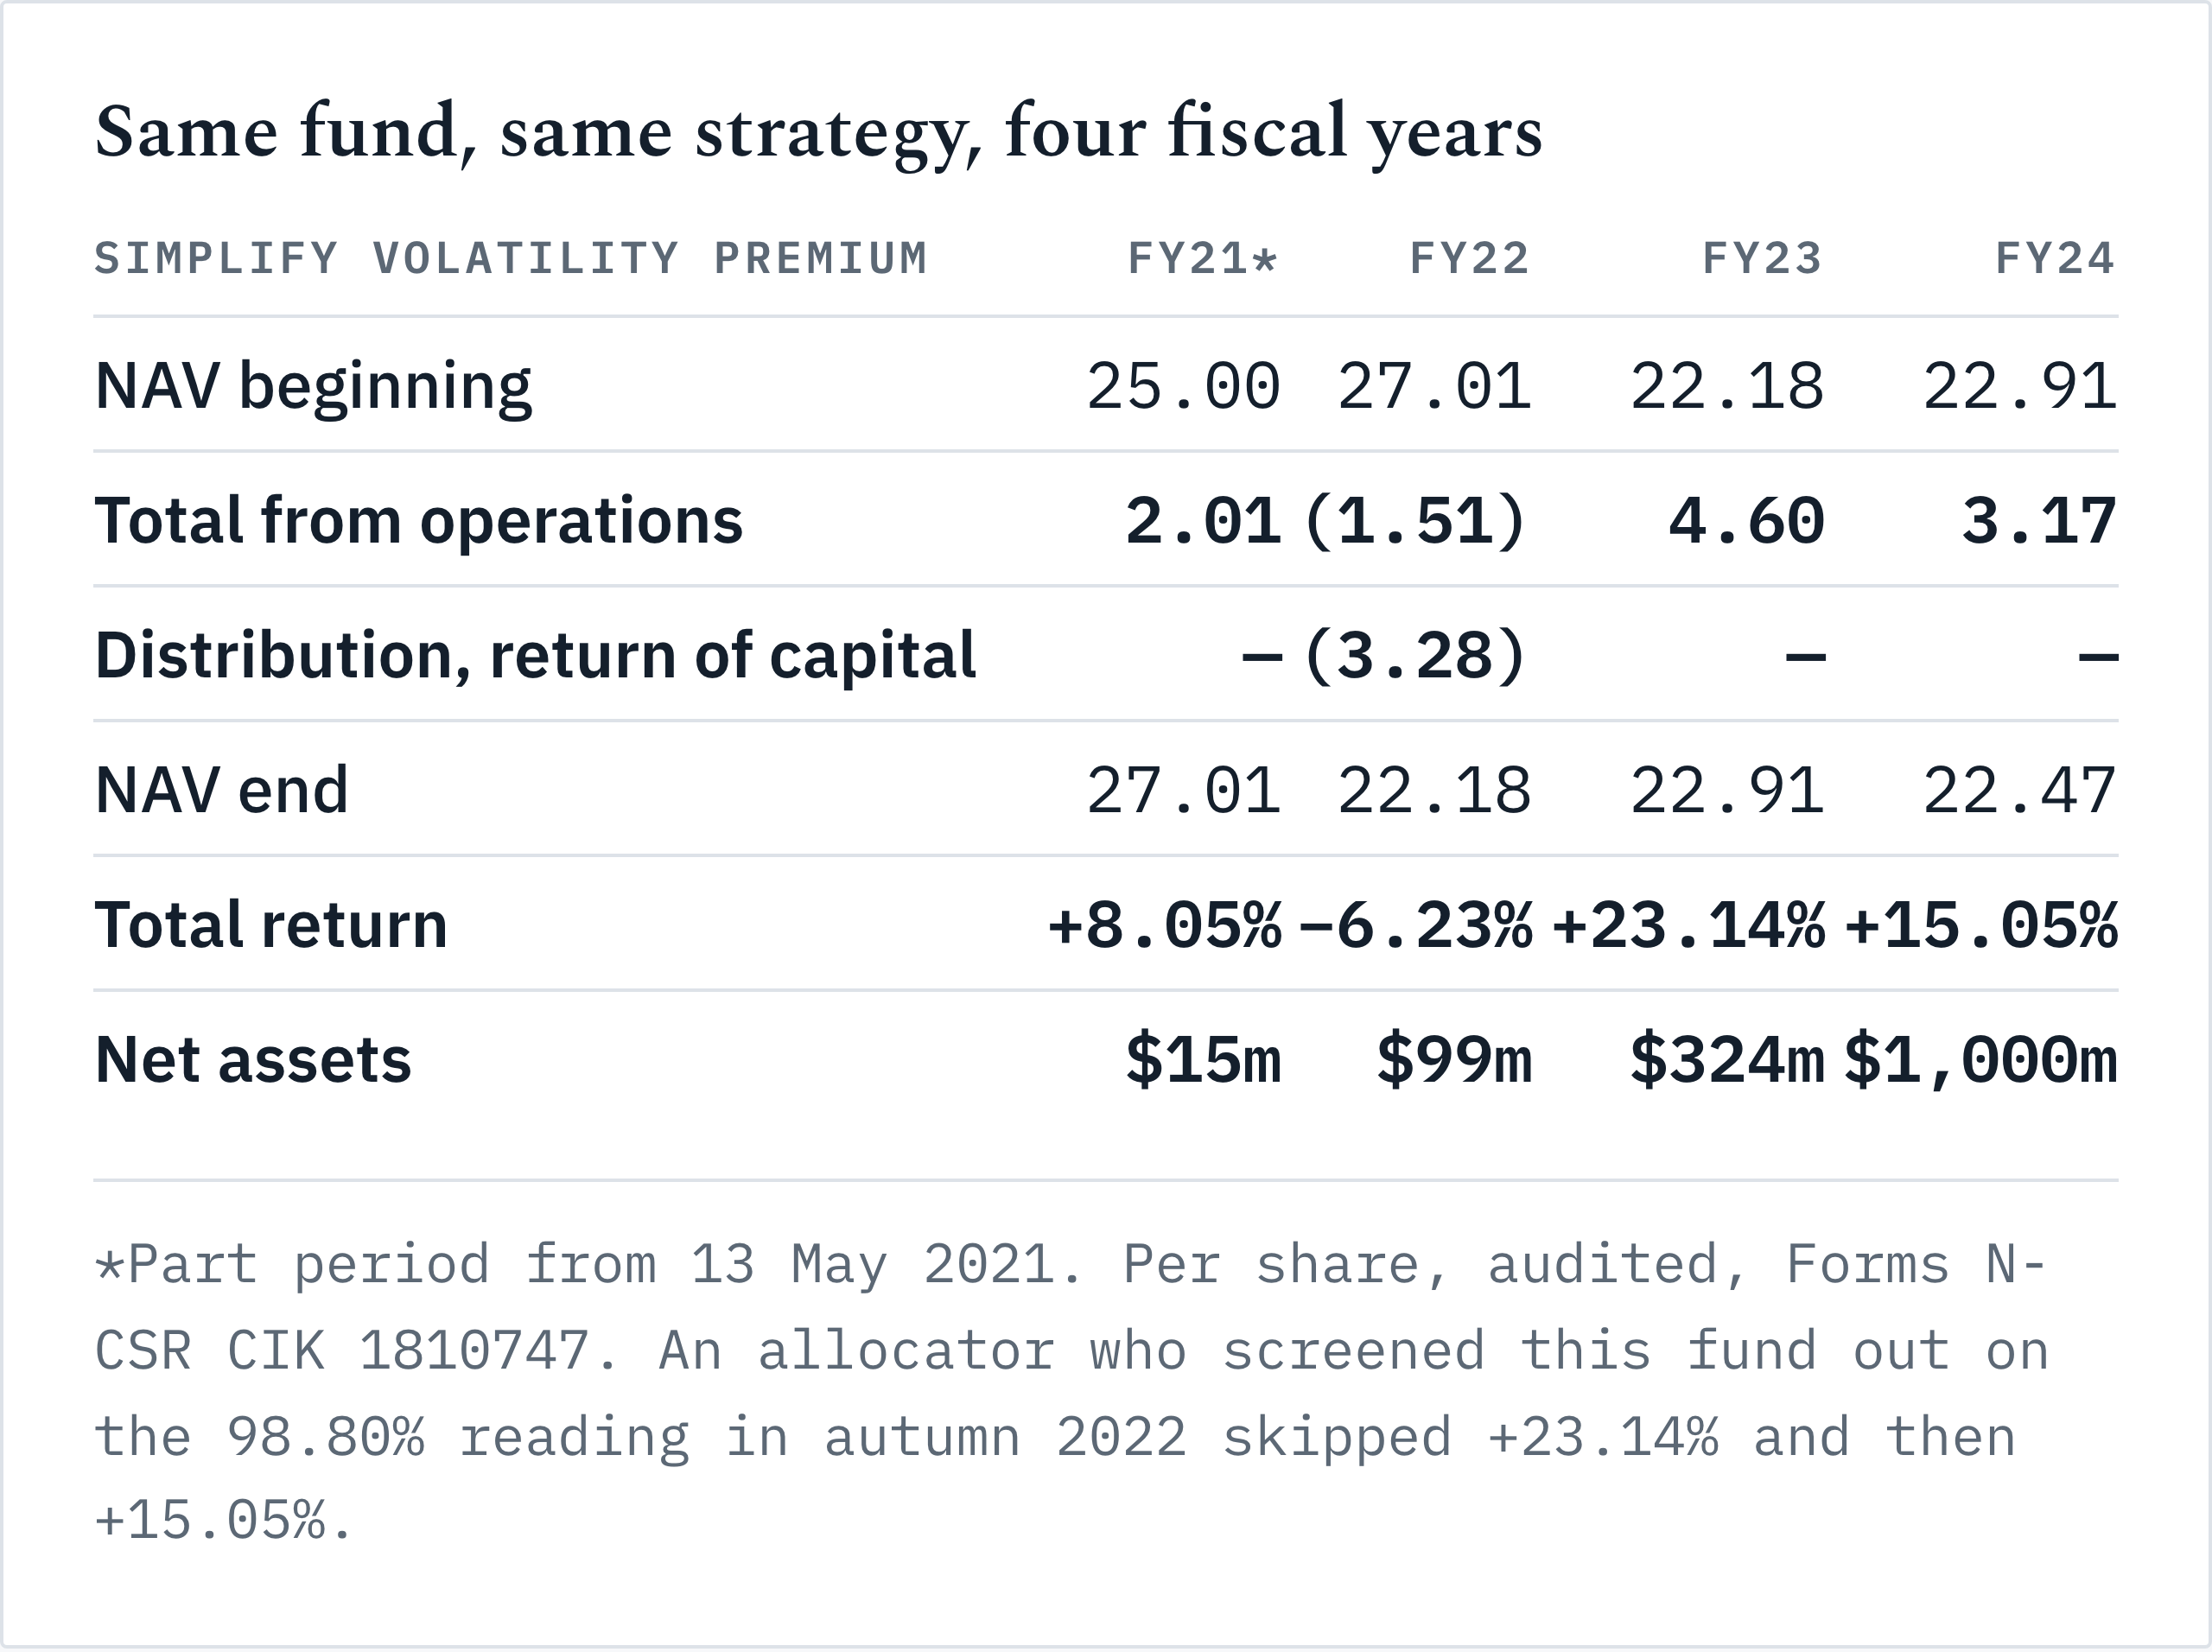
Same fund. Same strategy. I expected the label to move with the strategy and it did not. From 98.9% return of capital to zero, then zero again on $103 million of distributions. Nothing about the strategy changed. Volatility fell, the carry arrived as realised gains instead of sitting buried under mark-to-market losses, and the label followed the market.
Simplify told SEC staff this itself, in writing, in a comment-letter response filed on EDGAR before the enforcement action existed:
“Simplify attempts to smooth monthly and quarterly distributions based on management estimates of income and cap gains to avoid lump sum year-end distributions. In certain periods, distributions could end up being classified as Return of Capital post-audit.” (SEC correspondence)
That same letter states SVOL “made no return of capital distributions in fiscal year ended 6/30/23,” which is my second independent confirmation of the collapse to zero.
Read the quote as the operating description it is. A payout gets set in advance off an estimate. Its character is settled afterwards by the auditor. Return of capital is the residual of an estimation error, measured against a boundary in the tax code and not against anything the portfolio did.
The same letter holds the detail I find most persuasive, because there the mechanism bites the manager’s own compliance process. Simplify’s first fix was an informal procedure that “monitored only the Funds that were likely to distribute capital.” It failed for the reason this whole piece is about: which funds report return of capital is not knowable in advance, being settled after the audit against earnings and profits. By March 2024 the procedure had to cover every fund making a distribution.
