


Fisher Information sets a mathematical floor on the variance of every parameter a quant fund estimates. The Cramér-Rao bound makes that floor a tradable boundary: cross it, and your reported Sharpe ratio is statistical noise, your calibrated volatility surface is unidentifiable, and (as of January 2025) the SEC will charge you ninety million dollars. The clearest primary-source evidence comes from the SEC’s own enforcement orders, NBER working papers, and academic-industry crossover research from Two Sigma, AlphaSimplex, Guggenheim, and Citigroup.
The one line of math every PM should be able to recite
For a parametric model with log-likelihood log L(θ), the Fisher Information matrix is I(θ) = −E[∂² log L / ∂θ²], the expected curvature of the log-likelihood at its maximum. The Cramér-Rao inequality states that the covariance of any unbiased estimator is bounded below by I(θ)⁻¹. The same Wikipedia entry notes that “if it is inconvenient to compute the inverse of the Fisher information matrix, then one can simply take the reciprocal of the corresponding diagonal element to find a (possibly loose) lower bound”, which is exactly the per-parameter standard error that shows up in fund risk reports. The observed information matrix is its sample-based version, the negative Hessian of the log-likelihood at the MLE, and it is what every parametric calibration engine actually computes.
The Two Sigma order: when parameter risk becomes regulatory risk
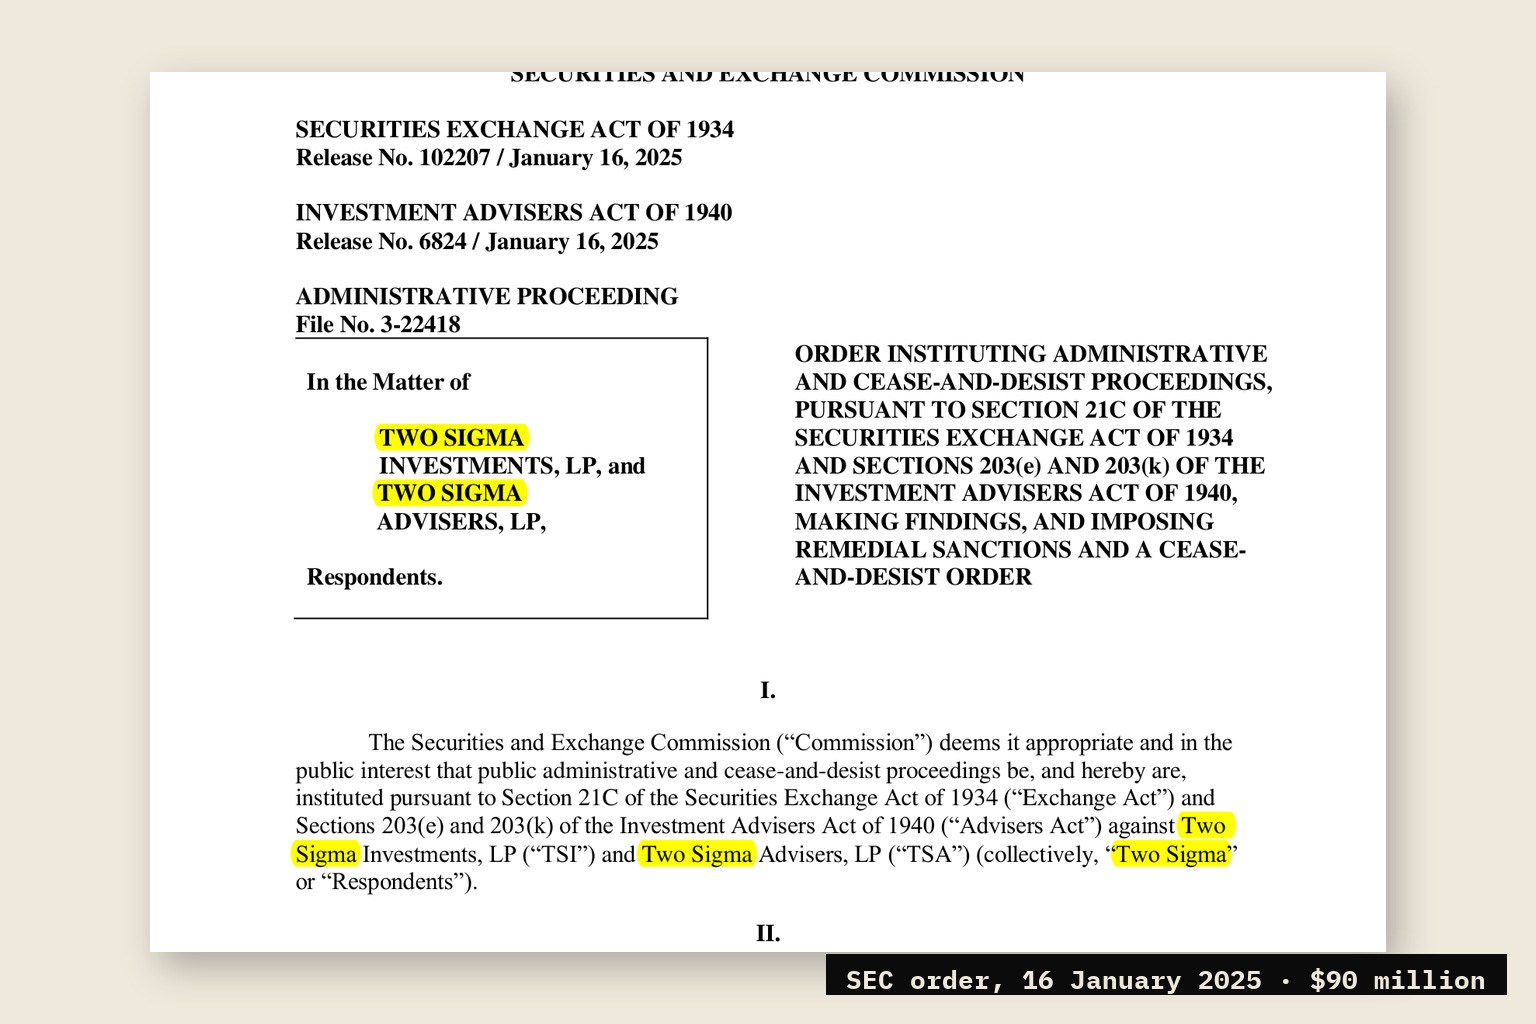
The single most explicit recent case of parameter management at a systematic fund being treated as a fiduciary issue is the SEC’s January 16, 2025 enforcement order against Two Sigma. The SEC’s press release states that the firm agreed to pay $90 million in civil penalties and voluntarily repaid impacted funds and accounts $165 million during the SEC’s investigation. The same release confirms that “in or before March 2019, Two Sigma employees identified and recognized vulnerabilities in certain Two Sigma investment models that could negatively impact clients’ investment returns, but Two Sigma waited until August 2023 to address the issues”.
The mechanism, as documented in legal counsel write-ups of the SEC order, was direct parameter tampering. Between November 2021 and August 2023, a Two Sigma employee changed the parameters for 14 models, which caused the models to perform differently and make investment decisions that Two Sigma would not have otherwise made, resulting in certain funds overperforming by more than $400 million and others underperforming by approximately $165 million. The Two Sigma employees who flagged this risk had been concerned, per the same Morrison Foerster summary, that “numerous personnel had unrestricted read and write access to a database storing model parameters and that the models could be changed without review or approval”. A separate RIA-compliance write-up of the SEC order specifies that the changes were first detected in August 2023 after going unreviewed since November 2021.
In Cramér-Rao terms, the parameter set of a systematic fund is not just the fitted output of an MLE; it is a fiduciary asset. Changing it without supervisory review is, in econometric language, drawing from outside the feasible confidence band of the FIM. The SEC’s order is the first published case where this is treated as a violation of the Investment Advisers Act.
The Statistical Limit of Arbitrage: feasible Sharpe is capped at 0.7
The most consequential industry-relevant Fisher Information result of the last decade is NBER Working Paper 33070, “The Statistical Limit of Arbitrage”, by Rui Da (Indiana Kelley), Stefan Nagel (Chicago Booth, NBER), and Dacheng Xiu (Chicago Booth, NBER), October 2024. The paper’s central object is the gap between the infeasible Sharpe ratio that a hypothetical arbitrageur with perfect knowledge of the data-generating process would earn, and the feasible Sharpe ratio that an actual arbitrageur, forced to learn parameters from finite data, can earn. The gap is governed by Fisher Information.
The empirical numbers from the paper, derived from a 1965 to 2020 sample of US equity returns covering both individual stocks and a panel of 1,273 characteristics-sorted portfolios plus 49 industry portfolios, are stark. The authors find that “only 7.58% and 1.12% of individual stocks’ alpha estimates have t-statistics greater than 2.0 and 3.0, respectively, in absolute values”, that the cross-sectional R-squared of regressing alphas on observable characteristics averages “around 8%” for individual stocks, that a latent factor model captures roughly 35% of cross-sectional variation at the portfolio level, and crucially that “the optimal feasible arbitrage portfolios yield moderately low annualized Sharpe ratios below 0.7. In contrast, the infeasible Sharpe ratios are considerably higher, averaging more than 4.8 and reaching as high as 16 in some sample periods for individual stocks, and ranging from 5 to 20 for portfolios”. As Xiu summarised the result at an Inquire Europe presentation, “the act of learning alpha statistically introduces mistakes, and those mistakes generate losses”. That gap is the Cramér-Rao penalty quantified.
The Heston Fisher singularity: why nobody trades volatility below 3%
The second clean case is in stochastic volatility calibration. Oliver Pfante and Nils Bertschinger of the Frankfurt Institute for Advanced Studies derived Fisher Information matrices for European option prices in the Heston model, fitting the likelihood on the constituents of the VIX (S&P 500 puts and calls with 23 to 37 days to expiration). The Frontiers paper documents that because the diagonal of the FIM is built from squared Vega, and because Vega collapses for at-the-money options when realized variance drops below roughly √v = 3%, the Cramér-Rao lower bound on the volatility estimate diverges in low-vol regimes. The arXiv version of the paper states the operational implication directly: “if volatility drops below a critical value, inferences from option prices become impossible because Vega, the derivative of a European option w.r.t. volatility, nearly vanishes”.
The same pathology appears from the optimizer side in the widely cited analytical Heston calibration paper by Cui, del Baño Rollin, and Germano (2015). Their objective surface, plotted in two-dimensional sections of the parameter space, is described in the abstract as “shaped as a narrow valley with a flat bottom”. That valley is the geometric signature of an ill-conditioned Fisher Information matrix.
Sharpe ratio inference: the FIM in every fund deck
Every Sharpe ratio confidence interval reported by an institutional fund is, mechanically, a delta-method calculation on the inverse Fisher Information matrix of the mean and variance estimators. Three published industry references make this explicit and operational.
Andrew Lo’s 2002 Financial Analysts Journal paper “The Statistics of Sharpe Ratios”, produced while he served as Chief Scientific Officer of AlphaSimplex Group, shows that “the annual Sharpe ratio for a hedge fund can be overstated by as much as 65 percent because of the presence of serial correlation in monthly returns” and that “once this serial correlation is properly taken into account, the rankings of hedge funds based on Sharpe ratios can change dramatically”. The Newey-West sandwich variance Lo uses is asymptotically equivalent to the inverse observed information matrix under correct specification.
Two Sigma Technical Report 2018-001, authored by Matteo Riondato in Two Sigma Labs, is in effect a fund-level manual for applying Fisher-Information-grounded asymptotic theory to Sharpe ratio inference. The report derives the exact non-central t-distribution of the basic Sharpe ratio estimator under normality and provides bias-correction formulas. The bias factor it tabulates is approximately 1.08 at twelve observations, 1.02 at forty observations, and 1.01 at seventy-five observations, meaning any Sharpe reported on under two years of monthly data is materially upward biased before any selection adjustment.
Marcos López de Prado, then Senior Managing Director at Guggenheim Partners according to the cover of his paper, extended the framework with the Deflated Sharpe Ratio. The DSR deflates the observed Sharpe by the Fisher-Information-derived standard error and additionally penalises for the number of independent backtest trials. In a separate paper, “What to Look for in a Backtest”, López de Prado proves a result that is the cleanest possible illustration of the Cramér-Rao floor in capital allocation: “after trying only 7 strategy configurations, a researcher is expected to identify at least one 2-year long backtest with an annualized Sharpe ratio of over 1, when the expected out of sample Sharpe ratio is 0”. Seven trials. Two years. Pure noise.
The Harvey-Liu three-sigma standard for systematic shops
Campbell Harvey and Yan Liu, writing in the Journal of Portfolio Management 2014 special anniversary issue, formalized the multiple-testing adjustment that systematic shops have since adopted. Their Evaluating Trading Strategies paper explicitly cites AHL Research as a data source and presents the case that the right minimum threshold is not a t-statistic of two but a higher one: “In this case, the t-statistic is 2.91. This means that the observed profitability is about three standard deviations from the null hypothesis of zero profitability. A three-sigma event (assuming a normal distribution) happens only 1% of the time”, and they reference that “LHC used a five-sigma rule” to draw the analogy. The implicit message for funds is that the FIM-derived standard error on an alpha estimate is the unit of measurement; anything inside two of them is statistically inadmissible after multiple testing.
SEC enforcement: regulators are Fisher-Information-aware
The SEC’s Aberrational Performance Inquiry, launched by the Enforcement Division’s Asset Management Unit in 2011, uses “proprietary risk analytics” to evaluate hedge fund returns and identify “suspicious” performance “inconsistent with a fund’s investment strategy or other benchmarks”. Then-Director Robert Khuzami’s March 10, 2011 testimony before the House Financial Services Subcommittee on Capital Markets and Government Sponsored Enterprises made the operational threshold explicit: the SEC was “canvassing all hedge funds for aberrational performance” and would specifically scrutinise “anybody who is beating the market indexes by 3 percent and doing it on a steady basis”. The initiative produced multiple enforcement actions, including the December 2011 wave of charges against several hedge fund managers.
A sustained outperformance against the strategy’s natural benchmark beyond what the FIM-implied confidence band predicts is, in the SEC’s analytics, suspicious by definition.
LTCM: the most expensive Cramér-Rao failure on record
The Long-Term Capital Management collapse in 1998 was, in econometric terms, a Cramér-Rao failure on a correlation parameter. LTCM’s convergence trades assumed stable historical correlations between similar fixed-income securities. According to the University of Houston Bauer School case study citing Philippe Jorion’s 1999 analysis, recent history had suggested “correlations between corporate bonds of different credit quality would move together (a correlation of between 90-95% over a 2-year horizon). During LTCM’s crisis, however, this correlation dropped to 80%”, and “this correlation had dropped to 75% as recently as 1992”. The President’s Working Group on Financial Markets report, the official government post-mortem, framed the failure precisely in these terms: “the simultaneous shocks to many markets confounded expectations of relatively low correlations between market prices and revealed that global trading portfolios like LTCM’s” carried hidden parameter risk that the FIM, calibrated on a too-stationary window, had not captured.
August 2007: the quant quake as a crowded-FIM event
The August 2007 quant meltdown is the canonical case where multiple funds had effectively the same posterior over the same parameter set, and discovered it in three days. Amir Khandani and Andrew Lo’s NBER Working Paper 14465 documents that “during the week of August 6, 2007, a number of quantitative long/short equity hedge funds experienced unprecedented losses” and hypothesises that this was the result of “a coordinated deleveraging of similarly constructed portfolios” causing “a temporary dislocation in the market”. Using simulated returns of long/short equity portfolios based on five valuation factors, the authors find evidence that “the unwinding of these portfolios began in July 2007 and continued until the end of 2007”.
In Fisher-Information terms, when many funds estimate the same factor loadings from overlapping data using the same model class, the per-fund FIM contribution is high but the cross-fund covariance of their positions is also high. Margin-call-driven unwinding then propagates through the covariance structure in a way no single fund’s standalone FIM accounts for. The Khandani-Lo paper is the cleanest documented case of this mechanism.
The deepest execution bound: the n^(-1/4) microstructure rate
The Fisher Information machinery also dictates the speed at which integrated volatility can be estimated from high-frequency tick data, which is the foundational input for almost every intraday vol strategy. Under microstructure noise, the optimal Cramér-Rao convergence rate is n^(-1/4), not the naive n^(-1/2) of the noise-free realized volatility estimator.
Lan Zhang’s 2006 paper introducing the Multi-Scale Realized Volatility estimator shows that the MSRV “converges to the true volatility at the rate of n^(-1/4), which is the best attainable”. Dacheng Xiu’s 2010 Quasi-Maximum Likelihood Estimator matches this rate through a parametric likelihood approach and achieves the parametric variance bound itself, with the asymptotic variance ratio converging to 1 for the QMLE (Clinet and Potiron 2017). Any intraday vol or gamma scalping desk is operating implicitly near this bound, since deviating from it costs basis points per trade in mishedged variance. The earlier Aït-Sahalia and Kimmel JFE paper is the corresponding statement for the lower-frequency parametric problem, with standard errors computed from the inverse Fisher Information of the joint stock-option likelihood.
Market impact: Citigroup’s published parameter estimation
The Citigroup Global Quantitative Research group, working with Robert Almgren, published one of the few studies that uses actual proprietary trading-desk data to estimate market impact parameters. The Direct Estimation of Equity Market Impact paper by Almgren, Thum, Hauptmann, and Li (2005), based on Citigroup US equity trading desk fills, reports that the authors “reject the common square-root model for temporary impact as function of trade rate, in favor of a 3/5 power law across the range of order sizes considered”. The standard errors on the fitted coefficients are computed from the inverse FIM of the nonlinear least squares problem and become the inputs to optimal trade scheduling. The Almgren-Chriss optimal liquidation paper is the framework that consumes those parameters, with the risk-aversion trade-off explicitly governed by how confident the desk is in its impact estimates.
Market making: the FIM on the order-arrival rate
In high-frequency market making, the Cramér-Rao argument operates on the order-arrival intensity parameter. The Avellaneda-Stoikov optimal market making model derives an optimal half-spread that depends on the volatility σ and the order arrival sensitivity κ. Both must be estimated from order flow, and the variance of κ̂ is bounded below by the inverse FIM. When recent fill data is sparse, the FIM is small, Var(κ̂) is large, and the optimal spread becomes a wide confidence band rather than a point estimate. Market makers either widen quotes to cover the Cramér-Rao bound or refuse to quote until the FIM accumulates enough information.
Renaissance and the cryptographic lineage of FIM-style alpha
The dominant systematic fund of the last forty years was built by a team almost entirely drawn from signal-detection and cryptography backgrounds, not from finance. As Fortune’s obituary for Jim Simons documents, Simons “turned to an old friend and fellow code cracker from the IDA, Leonard Baum, whose mathematical models could be used to trade currencies”, and Baum is the same Baum whose name appears on the Baum-Welch algorithm for fitting hidden Markov models, the standard errors of which are computed from the observed Fisher Information of the joint state-observation likelihood.
The reported Medallion hit rate, documented in Institutional Investor’s long-form piece on Renaissance through its account of the firm’s trade-secret litigation, sits at the level of finely tuned individual signals such as the one Laufer named “Henry’s signal”, which surfaced as evidence in a misappropriation case against ex-employees and is described in the same piece as being so distinctive that “it seemed more than a coincidence that Renaissance used a similar strategy with the exact same name”. As Bloomberg has framed Henry Laufer’s contribution, Medallion is “based on models that find signals hidden in the noise of markets”. In Fisher-Information language, the design maximises information per trade across very large numbers of low-correlation signals rather than betting on any single high-signal one.
What this means for capital allocation
Four operational implications, all grounded in the cited evidence, follow.
First, sample size dominates feature complexity. The Da, Nagel, Xiu result of a feasible Sharpe under 0.7 versus an infeasible 4.8+ quantifies how punishing the daily, large-cross-section frequency is when measured against the FIM-implied bound.
Second, the Cramér-Rao bound only binds when the model is right. The LTCM correlation failure documented by the PWG report and the Bauer LTCM case study show that when the model is misspecified, the inverse observed information becomes a misleading variance estimate. The same lesson appears in the Khandani-Lo quant quake analysis: cross-fund covariance was not in any single fund’s FIM.
Third, regulators are now Cramér-Rao-aware. The SEC’s Two Sigma order treats unsupervised parameter changes inside a systematic fund as a fiduciary violation; the Aberrational Performance Inquiry flags fund returns that exceed their FIM-implied benchmarks.
Fourth, beating the bound requires more, or better-conditioned, information. The n^(-1/4) microstructure rate is the literal published ceiling on what tick data can tell you about volatility; the Citigroup market impact estimation is the literal published ceiling on what fill data can tell you about price impact. Alternative data and proprietary execution venues are not features; they are line items that buy Fisher Information. Funds that respect the Cramér-Rao floor, size positions to the FIM-implied variance, and refuse to trade where the information matrix is singular survive; the rest sample noise at high leverage and, in some cases, settle with the SEC.
📊 Want Deeper Quantitative Analysis?
This research required extensive data collection, primary-source verification, and analysis. If you found value in this deep-dive, I publish exclusive quantitative research, trading strategies, and institutional-grade analysis on Patreon.
By joining, you’ll be supporting my work and motivating me to publish more content like this.
→ Join the Patreon community here
Connect
For more institutional-grade quant research, forensic hedge fund analysis, and systematic strategy breakdowns, follow my work across:
YouTube: The Mathematical Trader
LinkedIn: Navnoor Bawa
Patreon: Exclusive quant research
Cover: the SEC's order against Two Sigma, 16 January 2025 (Release 34-102207), a public record.