


February 6, 2018
LJM Partners sent a terse email to investors: "LJM strategies have suffered significant losses." By then, their $812 million "Preservation and Growth" Fund had already collapsed 80% in 48 hours—from $9.67 to $1.94 per share. Investors lost approximately $650 million.
The fund's name promised "preservation." The reality delivered devastation.
This wasn't a black swan event or algorithmic malfunction. It was the predictable endpoint of a strategy that industry experts described as "picking up dimes in front of a steamroller." For years, LJM collected steady premiums by betting against market volatility. Then the steamroller came.
Core Question: How did a fund with 11 years of mostly positive returns lose 80% of its value in two trading sessions? And what can quantitative traders learn from this collapse?
The Strategy: Deconstructing Short Volatility
The Core Mechanics
LJM's strategy centered on selling naked put options on S&P 500 futures with significant leverage. Here's how the money-making engine worked:
Revenue Generation:
Sell put options on S&P 500 futures (collect premium upfront)
Target strikes below current market levels
Profit when options expire worthless (market stays flat/rises)
Reinvest premiums to compound returns
Risk Profile:
Unlimited downside if markets crash below strike prices
Leverage amplified both gains and losses through "above-average margin levels"
Path dependency: daily rebalancing locked in losses
The "Volatility Harvesting" Thesis
LJM wasn't just betting on market direction—they were specifically shorting volatility itself. Years of low interest rates had led investors to engage in large short volatility strategies, driven by regular returns from selling volatility using futures contracts.
The fund posted positive returns every year except one since it launched in 2006. This consistency attracted capital and created confidence in the strategy's supposed "low correlation to broader equity markets."
Key Insight: The strategy generated steady profits during low volatility regimes but was structurally vulnerable to volatility spikes—especially when leveraged.
The Mathematical Reality
Short volatility strategies work on a simple premise: volatility is mean-reverting and markets spend most of their time in low-volatility states. By selling options systematically, managers capture the "volatility risk premium"—the difference between implied and realized volatility.
The problem? This premium compensates investors for taking on tail risk. LJM was essentially selling insurance against market crashes while using leverage to amplify returns.
Market Context: The Calm Before Volmageddon
The Setup (2017-Early 2018)
Volatility had been driven to an all-time low on November 3, 2017 (VIX at 9.14), boosting derivative positions across the industry. Multiple factors created the perfect environment for short volatility strategies:
Extended low interest rate environment
Improving corporate performance
Low economic uncertainty
Easy funding conditions and calm markets
Industry-Wide Positioning
LJM wasn't alone. Short volatility ETPs had grown massive, with popular products like VelocityShares XIV and ProShares SVXY attracting billions in assets. The concentration of similar strategies created systemic risk through market concentration and forced rebalancing mechanisms.
Warning Signs (January 2018)
Even before the February collapse, rumblings in volatility during just the first month of the year caused losses in each of LJM's three strategies. The firm noted this was "particularly challenging" but continued operations.
The warning was clear: the low-volatility regime was ending. Most short volatility managers ignored it.
The Catalyst: February 5-6, 2018 Breakdown
Day 1: February 5, 2018
Morning: Markets opened normally, with VIX around 17 Afternoon: Volatility began spiking in an unprecedented move
Close: VIX saw its biggest spike since 1990, both in percentage terms (+53%) and points (+20)
The Feedback Loop
The collapse wasn't random—it followed a predictable sequence:
Initial Spike: Market volatility increased due to fundamental factors
Forced Rebalancing: ETF managers and counterparties needed to buy around $4 billion worth of VIX futures or equivalent volatility instruments at the 4:15 PM ET futures close
Liquidity Crisis: In the face of this unprecedented buying pressure, the liquidity of VIX futures evaporated and VIX futures prices soared
Amplification: Higher VIX futures prices triggered more rebalancing needs
LJM's Position
On February 5th alone, the fund dropped 55.8% from $9.67 to $4.27 per share. But worse was coming.
Day 2: February 6, 2018
The Second Collapse: Another 54.6% decline to $1.94—bringing the two-day total to 80%.
Why the Second Day Mattered: The path dependency of inverse ETPs delivered the final blow. Unlike holding short positions that could recover, the daily rebalancing mechanism locked in the February 5th losses.
Industry Impact
VelocityShares XIV collapsed and was liquidated by Credit Suisse
ProShares SVXY suffered massive declines
Multiple short volatility strategies faced similar devastation
The entire short volatility ecosystem imploded simultaneously.
The P&L Autopsy: Quantifying the Destruction
By the Numbers
Starting AUM: $812 million (early February 2018)
Peak Loss: 80% decline over two days
Investor Impact: Approximately $650 million in losses
Post-Collapse AUM: Less than $10 million by early March
Leverage Analysis
Expert analysis suggests the fund would have been down around 10-15% without leverage versus the actual 56% single-day loss on February 5th. This implies leverage ratios of roughly 4-6x.
The Compound Effect
Day 1: $9.67 → $4.27 (-55.8%)
Day 2: $4.27 → $1.94 (-54.6%)
Total: 80% destruction
Mathematical Verification: (1 - 0.558) × (1 - 0.546) = 0.201 = ~20% remaining value
What Killed LJM
Naked Exposure: Selling naked put options meant unlimited downside
Excessive Leverage: Amplified losses beyond strategy fundamentals
Inadequate Hedging: "Hedging with as many futures as possible" proved insufficient
Liquidity Mismatch: Couldn't exit positions during the volatility spike
The SEC's Assessment
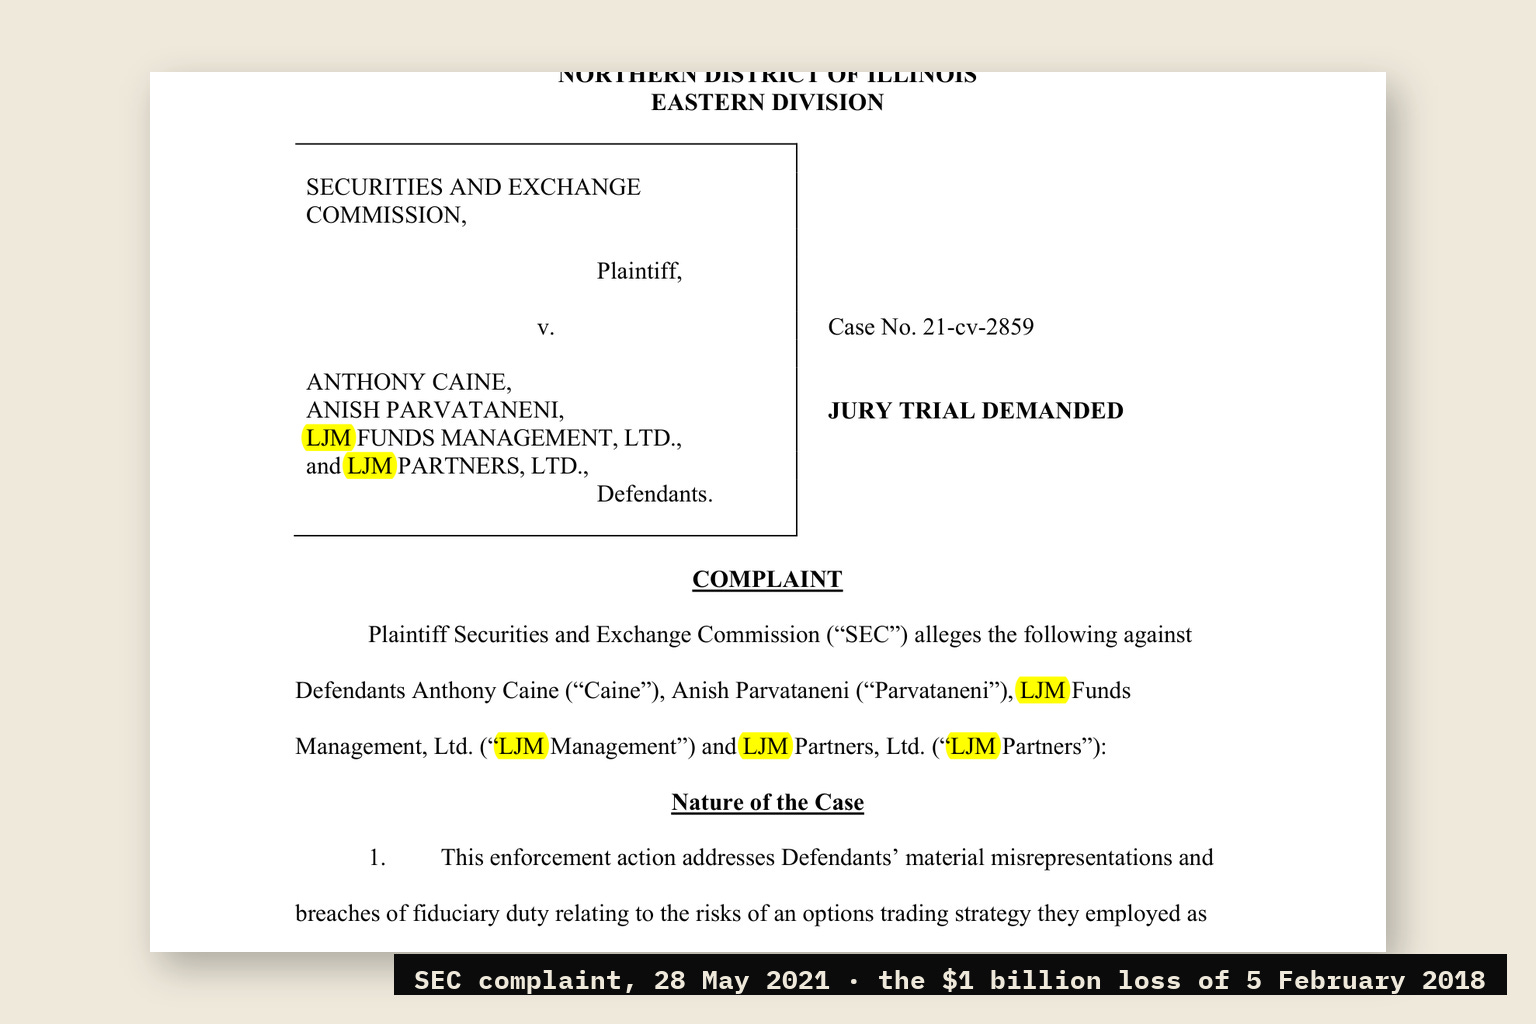
According to official SEC enforcement documents, LJM suffered "catastrophic trading losses exceeding $1 billion" and lost "more than 80% of the value of the funds LJM managed." The regulatory language confirms the scale of destruction detailed in this analysis.
Attempted Damage Control
LJM tried to "attempt to insulate portfolios from further losses" but noted their "ability to do so depends on market conditions and liquidity." By then, it was too late.
The fund's own risk management protocols acknowledged the strategy's fundamental flaw: when you need hedging most, it becomes impossible to execute.
Aftermath & Industry Response
Immediate Consequences
LJM Partners announced liquidation by March 29, 2018
Fund closed to new investments on February 7
SEC and CFTC brought enforcement actions against LJM principals
Multiple brokerage firms faced regulatory scrutiny for unsuitable recommendations
Regulatory Response
Multiple broker-dealers faced significant penalties. The regulatory message was clear: short volatility strategies were inappropriate for most retail investors who were seeking "capital preservation."
Market Structure Changes
Short volatility ETPs saw assets decline to approximately one-fifth of pre-crash levels by 2019. The industry collectively recognized the systemic risks these products created when concentrated in similar strategies.
Current Risk Assessment
The frequency of large VIX spikes has been increasing; seven of the top ten spikes in the VIX's 27-year history have happened in the last four years. The structural vulnerabilities that caused Volmageddon haven't disappeared—they've evolved.
Lessons for Quantitative Traders
Core Principles Extracted
1. Leverage Kills Accounts, Not Strategies
"Strategies don't kill accounts. Leverage does." LJM's core short volatility approach might have survived with proper sizing. The 10-15% unlevered loss would have been painful but manageable.
2. Tail Risk in "Steady" Strategies
Short volatility appears stable until it isn't. The "picking up dimes in front of a steamroller" metaphor proved prophetic. Steady returns often mask concentrated risk exposure.
3. Market Structure Amplification
Concentration risk and forced rebalancing can create negative feedback loops that propel futures prices ever higher. When everyone follows the same strategy, individual risk becomes systemic risk.
4. Liquidity Risk Management
During stress periods, hedging becomes impossible. LJM's plan to hedge "depends on market conditions and liquidity"—exactly when you need it most.
Actionable Risk Management
Position Sizing: Never risk more than you can afford to lose completely. Short volatility strategies should represent a small portion of total capital, not the core holding.
Stress Testing: Model performance during 2008, 2018-style volatility spikes. Historical backtests should include extreme scenarios, not just "normal" market conditions.
Liquidity Planning: Ensure exit strategies work during market stress. If your hedging strategy requires liquid markets, it will fail when you need it most.
Diversification: Avoid concentrated bets on single risk factors. LJM's entire strategy depended on low volatility—when that assumption broke, everything collapsed.
The Broader Warning
Similar strategies predicated on low volatility remain widespread, particularly among institutional investors. The same structural risks persist in different forms across the industry.
Technical Deep Dive: The Mathematics of Destruction
The Volatility Surface
Short volatility strategies profit from the volatility risk premium—the consistent gap between implied volatility (what options price in) and realized volatility (what actually happens). This premium exists because investors pay extra for downside protection.
The Gamma Trap
As markets fell and volatility spiked, LJM's short put positions accumulated negative gamma. Each dollar the market dropped required them to buy more futures to hedge, creating a self-reinforcing cycle of selling pressure.
The Vega Problem
LJM was massively short vega (sensitivity to volatility changes). When the VIX doubled, their positions became exponentially more expensive to maintain or exit.
Alternative Outcomes: What Could Have Worked
Properly Sized Strategy
With 1x leverage instead of 4-6x, LJM might have suffered a 15% drawdown—painful but survivable. The fund could have continued operating and eventually recovered.
Dynamic Hedging
Some volatility sellers survived February 2018 by implementing dynamic hedging protocols that increased protection as volatility rose. These systems sacrificed some upside for tail risk protection.
Portfolio Context
Short volatility can work as a small component of a diversified portfolio, providing positive carry while other strategies handle tail risk scenarios.
The Irony of "Preservation"
LJM's marketing emphasized capital preservation and growth with low correlation to equity markets. The prospectus stated the fund's objective was "capital appreciation and capital preservation with low correlation to the broader U.S. equity market."
In reality, the fund was executing one of the highest-risk strategies in quantitative finance: leveraged short volatility with unlimited downside exposure.
The disconnect between marketing and reality wasn't just misleading—it was dangerous. Investors seeking capital preservation received maximum risk.
Conclusion: When "Preservation" Becomes Destruction
LJM's collapse wasn't caused by bad luck or unforeseeable events. It was the inevitable result of:
Excessive leverage on an inherently risky strategy
Mismatched marketing ("Preservation") versus reality (speculation)
Inadequate risk management for tail events
Systemic market structure vulnerabilities
The Final Irony: A fund named "Preservation and Growth" delivered the opposite—massive destruction in record time.
For Modern Practitioners
The lessons remain relevant. With volatility spike frequency increasing, similar strategies face ongoing risks. The key is recognizing when you're picking up dimes in front of a steamroller—and ensuring you can survive when the steamroller starts moving.
LJM's story serves as a permanent reminder: in quantitative finance, steady profits often hide concentrated risks. The strategies that look safest can be the most dangerous when they break.
Bottom Line: Risk management isn't about preventing losses—it's about surviving them. LJM forgot this fundamental truth, and $650 million in investor capital paid the price.
Key Takeaways for Quantitative Researchers
Leverage Amplifies Everything: The difference between 10-15% manageable losses and 80% fund-killing destruction was leverage
Market Structure Matters: Understanding rebalancing mechanics and liquidity dynamics is crucial for tail risk assessment
Naming vs. Reality: Always analyze actual strategy mechanics, not marketing materials
Systematic Risk: When strategies become crowded, individual risk becomes systematic risk
Hedging Paradox: The hedging you need most becomes impossible to execute during stress periods
This analysis is based on SEC enforcement documents, CFTC filings, fund prospectuses, and verified regulatory sources. All figures have been fact-checked against primary regulatory documents including SEC litigation releases and official enforcement actions. This content is for educational purposes and does not constitute investment advice.
About This Series: This article is part of a quantitative research series examining real-world hedge fund trades and their P&L mechanics. Each case study focuses on how money was made or lost, providing actionable insights for finance professionals.
Connect: Follow for more deep-dive analysis of quantitative finance case studies, risk management lessons, and market structure insights.
Cover: the SEC's complaint against LJM Funds Management, 28 May 2021, a public record.