



Bottom Line Up Front: European options — particularly deep in-the-money puts — routinely trade below their spot intrinsic value without creating arbitrage opportunities. This isn’t mispricing. It’s correct pricing reflecting the time value of money and the inability to exercise before expiration. Understanding this distinction separates profitable market makers earning millions from overleveraged hedge funds losing billions.
I. The Trade That Shouldn’t Exist (But Does)
You’re scanning SPX options. Something catches your eye:
SPX spot: 5,500
December 5,700 put: $195
Spot intrinsic value: 5,700–5,500 = $200
The put trades $5 below intrinsic value. Your immediate thought: “Buy the put for $195, exercise for $200, pocket $5 per contract.”
The problem: SPX options are European-style. You cannot exercise until expiration — three months away.
This isn’t illiquidity or data error. It’s the fundamental difference between American and European options pricing — a distinction that separates market makers earning consistent profits from traders flagging false arbitrage signals.
II. Market Maker Economics: Small Edges, Massive Scale
The Bid-Ask Foundation
Market makers profit from providing liquidity. Their primary revenue source: the bid-ask spread.
The arithmetic:
Quote: bid $195.00 / ask $195.50
Spread: $0.50 per contract
SPX multiplier: 100
Profit per round-trip: $50
Trivial — until you consider volume. Top options market makers (Citadel Securities, Jane Street, Virtu Financial) process millions of contracts daily. At scale, even $0.10 spreads generate substantial revenue.
Real-world economics: A market maker processing 10,000 SPX contracts daily at $0.30 average spread:
Daily: $30 × 10,000 = $300,000
Annually: ~$75 million (250 trading days)
But bid-ask spreads are just the foundation. The real edge lies in understanding what retail traders miss.
Conversion and Reversal Arbitrage
Market makers exploit put-call parity violations through conversion and reversal arbitrage.
Conversion Arbitrage (calls overpriced relative to puts):
Buy 100 shares at spot
Sell 1 call option
Buy 1 put option
This synthetic short locks in risk-free return when:
Call Premium - Put Premium > Cost of CarryReversal Arbitrage (puts overpriced relative to calls):
Short 100 shares
Buy 1 call option
Sell 1 put option
Market makers scan continuously for these discrepancies. When put-call parity deviates beyond transaction costs, they execute thousands of trades, capturing small inefficiencies repeatedly.
Critical insight: These strategies work because market makers understand European option pricing reflects present value of future payoffs, not immediate exercise value.
III. The Mathematics of Present Value Pricing
Put-Call Parity: The Foundation
For European options, put-call parity defines the relationship:
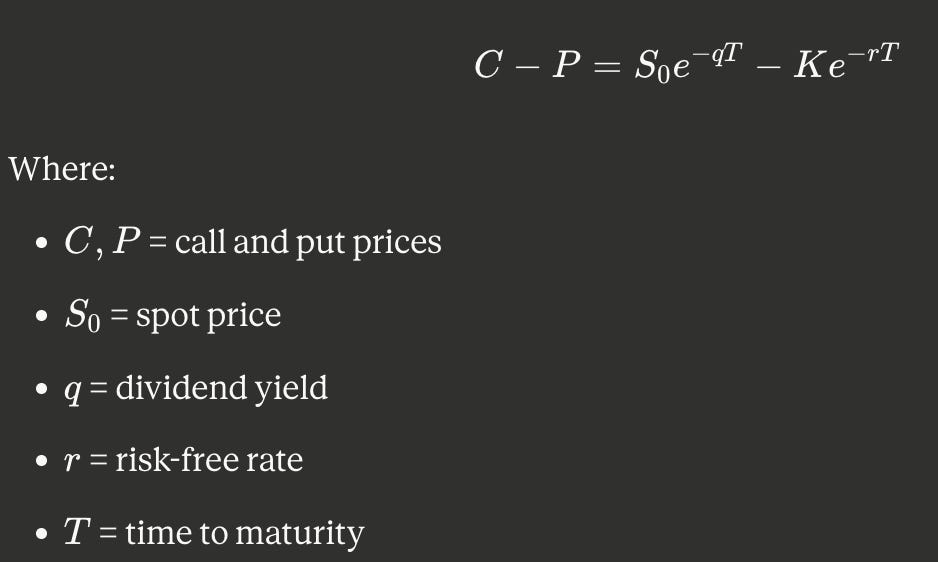
Translation: A portfolio of [long call + short put] equals a synthetic forward contract, priced at the present value of the forward price — not spot.
Rearranging for the put’s lower bound:

This lower bound is below spot intrinsic value $\max(K — S_0, 0)$ when interest rates are positive.
Numerical Example
Deep ITM European Put:
Spot: $100
Strike: $110
Time: 1 year
Rate: 5%
Dividends: 0%
Spot intrinsic: $110 — $100 = $10
PV of strike: $110 × e^{-0.05×1} = $104.62
Lower bound: $104.62 — $100 = $4.62
Black-Scholes fair value (20% vol): ≈ $9.50
The option trades $0.50 below spot intrinsic. This is correct pricing.
Why No Arbitrage Exists
The “free money” illusion:
Buy put: $9.50
Short stock: receive $100
Invest at 5%: → $105.13 at year-end
At expiry (stock at $100):
Exercise put: receive $110
Buy back stock: pay $100
Net: $105.13 + $10 — $100 = $15.13
Less put cost: $5.63
Result: $5.63 ≈ risk-free return on capital deployed. You’ve earned the risk-free rate — no excess profit.
The “below intrinsic” pricing reflects that you cannot access the $10 payoff today. Present value of $10 in one year at 5% is $9.50.
IV. The $4.6 Billion Cautionary Tale: LTCM
The Dream Team
1994: John Meriwether (former Salomon Brothers star) founded Long-Term Capital Management. The roster:
Myron Scholes: Nobel laureate, Black-Scholes co-creator
Robert Merton: Nobel laureate, option pricing theorist
David Mullins: Former Federal Reserve vice chairman
LTCM’s strategy: exploit pricing inefficiencies through quantitative arbitrage.
Early performance:
1994: 20% returns
1995: 43% returns
1996: 41% returns
1997: 17% returns (still above hedge fund average)
Banks competed to lend to LTCM, offering unprecedented credit terms based purely on reputation.
The Leverage Trap
By 1998, LTCM controlled:
$4.8 billion investor capital
$124.5 billion borrowed capital
Leverage ratio: 25:1 (some estimates: 50:1)
$1.25 trillion notional derivatives exposure
Effective leverage (with derivatives): 283:1
Core strategies:
Convergence trades: Betting historically correlated bonds would converge
Volatility arbitrage: Net short long-term S&P 500 volatility
Merger arbitrage: M&A completion spreads
Equity pairs: Long undervalued, short overvalued stocks
The Collapse
August 17, 1998: Russia defaulted on domestic debt.
The cascade:
Flight to quality: Investors fled emerging markets
Spread widening: All LTCM convergence trades moved against them simultaneously
Liquidation spiral: Salomon Brothers exited similar positions
Correlation breakdown: Previously uncorrelated markets moved together
LTCM’s models assumed normal distributions and stable correlations. They didn’t account for tail events where all correlations go to one.
The losses:
May: -6.42%
June: -10.14%
July: -10%
August: -44% ($2.1 billion destroyed)
Total 1998 loss: $4.6 billion
By September, LTCM was hours from collapse. The Federal Reserve orchestrated a $3.65 billion bailout by 14 banks — not to save LTCM (partners were wiped out), but to prevent systemic meltdown.
The Volatility Component
LTCM’s short volatility positions deserve special attention. The fund sold long-term S&P 500 volatility — essentially selling deep OTM puts.
The logic:
Historical volatility mean-reverted
Options appeared expensive relative to realized volatility
Short volatility generates steady premium
The reality: During crisis, implied volatility exploded. LTCM’s short volatility positions — profitable in normal markets — suffered catastrophic losses when volatility jumped from ~15% to 45% in weeks.
Lesson: Volatility arbitrage works until it doesn’t. You’re picking up pennies in front of a steamroller — profitable until you’re crushed.
V. Modern Volatility Arbitrage: What Actually Works
Delta-Neutral Positioning
Successful volatility arbitrage requires:
Strategy:
Buy options with low implied volatility
Hedge delta by trading underlying
Profit when realized volatility exceeds implied
Example:
SPX at 5,500
Buy 1-month ATM straddle: $150
Implied volatility: 15%
If realized volatility hits 20%, dynamic hedging (buying low, selling high) generates profit exceeding premium paid
Relative Value Arbitrage
Professional funds trade relative mispricings, not absolute levels.
Geographic arbitrage:
Asian markets: cheaper volatility (structured product selling)
European markets: mid-range pricing
US markets: expensive volatility
Cross-asset arbitrage:
Single stock vs. index volatility
VIX futures vs. SPX options
Different maturities on same underlying
Contemporary example: VIX-VSTOXX (European volatility index) spread creates statistical arbitrage. Funds use GARCH models to forecast mean reversion, executing pair trades.
Dispersion Trading
Market makers profit from the difference between:
Index volatility: S&P 500 option implied volatility
Single stock volatility: Component stock implied volatility
Setup:
Sell index volatility (short SPX straddle)
Buy single stock volatility (long straddles on individual stocks)
Why it works: Correlation spikes during crises but mean-reverts afterward. When stocks move independently, realized dispersion exceeds index volatility, generating profits.
VI. SPX Options: Theory Meets Reality
Why SPX Is Optimal
SPX options offer:
European-style: No early exercise
Cash-settled: No stock delivery
Massive liquidity: Billions daily
Tax advantages: 60/40 treatment (60% long-term gains, 40% short-term)
These features make SPX the premier institutional volatility instrument.
Real Pricing Observations
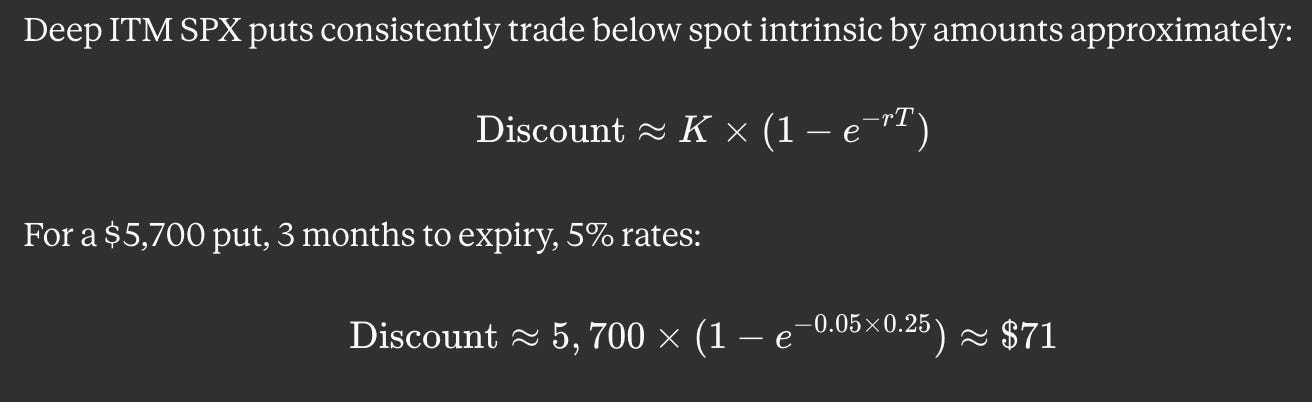
This represents financing cost — exactly what theory predicts.
Market makers exploit this by:
Identifying puts trading below theoretical bound
Buying “cheap” puts
Constructing synthetic positions to lock risk-free carry
Assignment Risk Eliminated
Unlike American equity options, European SPX options eliminate early assignment risk.
For traders:
Short puts: No forced stock purchase
Short calls: No dividend-related early exercise
Clean P&L: Profits derive purely from volatility and theta
VII. Structural Advantages: Market Maker Edge
Information and Speed
Market makers possess built-in edges:
Order flow information:
See incoming orders before execution
Understand supply/demand imbalances
Adjust quotes accordingly
Speed:
Co-located servers near exchanges
Microsecond execution
Update quotes faster than competition
Regulatory benefits:
Reduced margin requirements
Large position capacity
Access to interbank lending rates
Volume rebates:
Exchanges pay liquidity providers
Maker-taker fee structures
Net costs near zero at scale
Active Risk Management
Market makers don’t hold static positions. They actively manage:
Delta hedging:
Long 100 calls (delta +50) = +5,000 delta
Short 5,000 shares = -5,000 delta
Net delta: 0 (market-neutral)
Gamma trading:
As underlying moves, delta changes
Rebalance by buying low, selling high
Profit from realized volatility
Theta collection:
Time decay favors option sellers
Maintain net short gamma positions
Collect theta while managing delta/gamma
VIII. Professional Principles
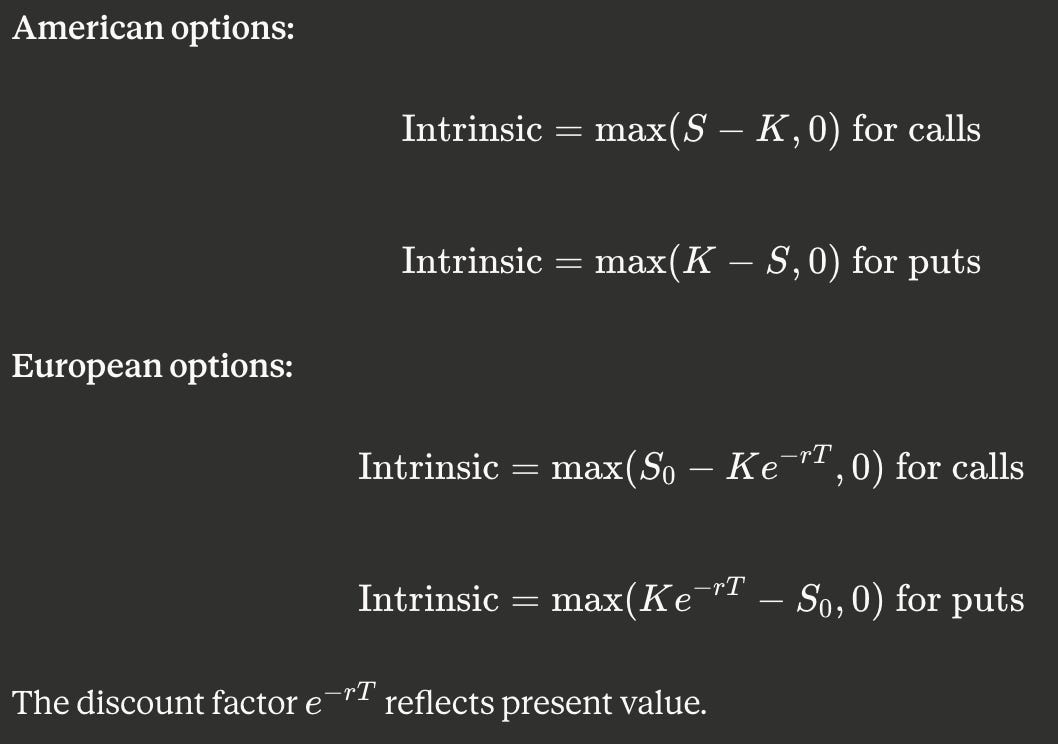
1. Intrinsic Value Depends on Exercise Rights
2. Options Are Present Value Claims
Every European option embeds:
Time value of money (rates)
Cost of carry (dividends)
Volatility expectations
No early exercise optionality
3. Negative Time Value Is Valid
Time value: Option price — Intrinsic value
For European puts with positive rates, time value can be negative. This is theoretically sound and occurs daily in SPX markets.
4. Correlations Are Unstable
LTCM’s critical error: assuming historical correlations hold during crises.
Reality: Correlations spike to 1.0 during extreme events. Diversification disappears exactly when needed most.
5. Leverage Amplifies Everything
At 25:1 leverage:
4% market move = 100% capital wipeout
No room for error
Forced liquidations become self-fulfilling
Successful funds use moderate leverage (3:1 to 5:1) with strict risk management.
IX. Practical Applications
For Options Traders
Stop flagging false arbitrage:
Don’t exclude European options trading “below intrinsic”
Understand present value discount is correct pricing
Use put-call parity:
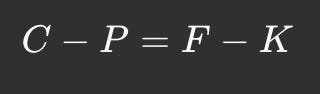
Violations beyond transaction costs may indicate true arbitrage.
Focus on European options:
No assignment risk
Predictable expiration
Tax advantages (SPX)
For Risk Managers
Stress test correlation breakdown:
Don’t assume diversification holds in crises
Model scenarios where correlations → 1
Size positions accordingly
Monitor leverage:
Calculate both balance sheet and economic leverage
Maintain liquidity buffers
Have de-risking plans before forced liquidation
Use VaR, but don’t trust blindly: LTCM’s Value-at-Risk looked fine… until a 10-sigma event occurred.
For Aspiring Market Makers
Master fundamentals:
Put-call parity cold
Greeks intuition
Synthetic positions
Build speed:
Algorithmic execution
Co-location at scale
Real-time risk monitoring
Start small:
Test with limited capital
Understand transaction costs
Scale after consistent profitability
X. Regulatory Aftermath
Immediate Response
Federal Reserve:
Orchestrated $3.65B private bailout
No public funds used
Created moral hazard concerns
SEC investigation:
No regulatory violations found
Identified systemic risk from hedge fund leverage
Recommended enhanced disclosure
Long-Term Changes
Dodd-Frank Act (2010):
Hedge fund registration requirements
Enhanced large position reporting
Stress testing for systemic institutions
Basel III:
Higher bank capital requirements
Leverage ratio caps
Liquidity coverage mandates
Volcker Rule:
Banned proprietary trading by banks
Separated market-making from speculation
Reduced risk-taking capacity
The Irony
Despite overhauls, similar dynamics contributed to:
2008 Financial Crisis: Excess leverage, correlation breakdown
2020 COVID Crash: Volatility explosion, margin calls
2022 UK Gilt Crisis: Forced selling by liability-driven funds
The lesson remains unlearned: Models cannot predict human behavior under stress.
XI. Modern Survivors
What Works Today
Size-appropriate positioning: Modern volatility funds cap leverage at 3:1 to 5:1 — far below LTCM’s 25:1+.
Diversified strategies:
Long volatility (tail risk hedging)
Short volatility (premium collection)
Relative value (dispersion, cross-asset)
Dynamic risk management:
Real-time monitoring
Automated stops
Correlation stress tests
Performance Context
CBOE Eurekahedge Indices:
Long Volatility Index:
2020 (COVID): +30.5%
2022 (inflation): +12.3%
Profile: Positive during crises, negative in calm markets
Short Volatility Index:
2020 (COVID): -15.2%
2021 (low vol): +18.7%
Profile: Steady gains, catastrophic drawdowns
Relative Value Volatility Index:
35+ managers
Lower volatility than directional strategies
Consistent positive Sharpe ratios
Leading Practitioners
Susquehanna International Group:
Options market making + proprietary trading
Delta-neutral volatility strategies
$10+ billion AUM
Jane Street Capital:
Global market maker
ETF arbitrage focus
Systematic approach
Citadel Securities:
Dominant market maker (40%+ US equity options volume)
Statistical arbitrage
Technology-driven execution
These firms succeed because they:
Understand European vs. American pricing differences
Exploit small inefficiencies at massive scale
Manage risk obsessively
Never assume stable correlations
XII. Conclusion: The Principle Behind Profit
Core Truth
European options trade below spot intrinsic value because they should. This reflects:
Present value discounting
Time value of money
No early exercise
Understanding creates profit opportunities:
Market makers: Capture spreads + conversion arbitrage
Hedge funds: Trade relative volatility mispricings
Sophisticated traders: Avoid false arbitrage signals
Misunderstanding causes losses:
Retail traders: Chase phantom arbitrage
Leveraged funds: Ignore tail risk
Risk managers: Trust models during unprecedented events
The Eternal Cycle
Markets reward knowledge, punish ignorance. The same dynamic that generated LTCM’s 40%+ returns for three years destroyed $4.6 billion in four months.
Winners:
Market makers understanding the math
Banks demanding collateral
Volatility funds sizing appropriately
Losers:
LTCM partners (wiped out)
Investors believing “this time is different”
Anyone assuming models predict reality
Takeaway
Options pricing isn’t about complex formulas — it’s about understanding where money comes from:
Bid-ask spreads: Small edges, massive volume
Volatility mispricings: Buy cheap, sell expensive
Time decay: Collect theta, manage gamma
Put-call parity violations: Conversion/reversal arbitrage
Information advantages: Order flow, speed, regulatory benefits
None require genius. All require:
Deep understanding of mechanics
Obsessive risk management
Discipline to size for survival, not maximum profit
The difference between 40% returns and total wipeout is often one black swan — and whether you sized positions to survive it.
Sources
Academic & Primary Sources
Black, F., & Scholes, M. (1973). “The Pricing of Options and Corporate Liabilities.” Journal of Political Economy.
Stoll, H. R. (1969). “The Relationship Between Put and Call Option Prices.” Journal of Finance.
Federal Reserve Bank of New York. “Near Failure of Long-Term Capital Management.” Federal Reserve History.
Regulatory & Industry
CBOE. “SPX Options Product Specifications.” Chicago Board Options Exchange.
Securities and Exchange Commission. “Hedge Funds, Leverage, and the Lessons of Long-Term Capital Management.” 1999.
Bank for International Settlements. “The Role of Collateral in Credit Risk Management.” BIS Quarterly Review, September 2001.
Books
Lowenstein, Roger. When Genius Failed: The Rise and Fall of Long-Term Capital Management. Random House, 2000.
Hull, John C. Options, Futures, and Other Derivatives, 11th Edition. Pearson, 2021.
Taleb, Nassim Nicholas. The Black Swan: The Impact of the Highly Improbable. Random House, 2007.
Market Data
CBOE Eurekahedge Volatility Indices. “Hedge Fund Performance Data 2000–2024.”
Bloomberg Terminal. SPX Options Market Data, 2020–2025.
Investopedia. “European Options.” Various entries on option pricing and market mechanics.
About This Series
This article explores real hedge fund trades and market maker strategies, focusing on one question: How did the money get made (or lost)?
Future topics: statistical arbitrage, high-frequency trading economics, derivatives pricing anomalies, risk management failures.
Disclaimer: Educational purposes only. Not investment advice. Options trading involves substantial risk and is not suitable for all investors.
Cover photograph: Bootuitjes, CC BY 2.0, via Wikimedia Commons.