


A forensic breakdown of the weather-model arbitrage, algorithmic execution architecture, three-stream revenue model, capital dynamics, and structural tailwinds that generated 850% EBT growth in 2022 — and why the renewable energy transition makes this edge wider every year.
In 2021, InCommodities generated €178.8 million in gross profit. In 2022, it generated €1.58 billion in gross profit and €1.37 billion in earnings before tax — an 850% EBT increase — achieved while hiring just 52 additional people. Across town in Aarhus, Danske Commodities posted €2.25 billion in adjusted EBT, generating a €439 million tax bill that made it one of Denmark’s largest corporate taxpayers. Combined EBT from two firms in a single asset class: approximately €3.6 billion in twelve months.
The reflexive explanation is “energy prices went up.” That explanation is incomplete. What happened in 2022 was a precise interaction between a structural market edge, an execution architecture built over years, three simultaneous revenue streams, and a liquidity shock that eliminated most competitors at the exact moment spreads hit their widest. The 2022 result was not a windfall — it was the payoff from infrastructure built years earlier, amplified by a crisis that rewarded the firms with the deepest balance sheets and the sharpest weather models. Understanding the mechanics requires dissecting each layer.
📊 Want the Exact Trades Behind These Numbers?
I have published a forensic reconstruction of every confirmed and inferred trade these firms executed — wind underproduction capture, solar negative-price positioning, cross-border spatial arbitrage, route-to-market optimization, and balancing market pre-positioning. Crucially, it also covers the losing trades and failure modes, which are equally important for strategy development. Every claim is tagged [CONFIRMED] or [INFERRED] so you always know exactly where the evidence ends and the logic begins.
The Market Structure They Exploit
Every European power producer that commits to future generation takes on a legal and financial obligation. Registered as a Balance Responsible Party (BRP), they must reconcile their committed volumes against actual delivery. The deviation between the two is settled at imbalance prices set by the Transmission System Operator — and those prices can be extreme. The intraday ceiling on EPEX SPOT sits at ±€9,999/MWh. Imbalance prices in stressed European markets have reached deeply negative values in the thousands of euros per MWh. These are not tail events — they are the mathematical consequence of weather-dependent generation in a market with imperfect forecasts.
European short-term electricity markets clear in three sequential layers. The day-ahead auction settles the evening before delivery, with renewable generators committing to forecast output 12–36 hours ahead. The continuous intraday market runs from day-ahead close until five minutes before delivery, allowing participants to correct their positions as weather data improves. The balancing market handles whatever residual imbalance remains after gate closure, at TSO-determined prices that can spike far beyond any traded price.
The algorithmic traders operate primarily in the intraday layer — but with simultaneous intelligence about all three. According to FT reporting, 70% of all EPEX SPOT volumes were executed algorithmically by 2024, up from 44% in 2020. This is a machine-vs-machine market. The winner is the machine with the better weather model.
The Alpha Source: Forecast Superiority, Not Price Direction
The edge is not a bet on the level of electricity prices. It is a bet on the direction of forecast revisions — specifically, that the specialist’s updated model will be right before the renewable generator’s operations team reaches the same conclusion and is forced to rebalance in the intraday market.
Mads Schmidt Christensen, Head of Strategy & Communications at Danske Commodities, described it to the FT as monitoring cloud cover, wind pattern shifts, and ice accumulation on turbines — “extreme dedication.” But the precision of that monitoring is the revenue mechanism. Danske’s meteorologists describe their core role as identifying how prevailing weather forecast data “is incorrect or may develop over time” — not supporting trading, but driving it.
The sequence works as follows. Day-ahead prices clear at midnight based on consensus forecasts. By 6am, satellite-updated numerical weather prediction (NWP) models narrow the uncertainty band for afternoon generation. A trader with faster ingestion of updated NWP data — proprietary post-processing, higher-resolution local models — builds an intraday position before the renewable producer’s operations team sees the same revision. By 9am, when the producer must rebalance, they are buying or selling into a position the algorithmic trader already holds. German research institute FfE documented that on July 3, 2023, a single wind forecast deviation drove intraday prices close to €2,000/MWh. On June 25, 2023, bids reached the exchange hard ceiling of €9,999/MWh. These are not accidents — they are the predictable outcome of forecast asymmetry in a physical delivery market.
InCommodities’ European CEO Daniel Andersen articulated the framework to the FT: algorithms are the mechanism to “navigate all that data, extract the relevant information and understand how it’s going to impact prices.” The firm was founded in 2017 by Emil Gerhardt, Jeppe Højgaard, Christian Bach, and CEO Jesper Johanson on an explicit thesis that systematic quantitative execution was structurally superior to discretionary trading in this market.
The Execution Architecture: Milliseconds to Money
Forecast advantage generates alpha. Execution architecture determines how much of it gets captured and at what scale.
Danske’s Head of Intraday Power Trading, Anders Kring, described the constraint directly to the firm’s own site: a trader managing volatile intraday markets manually “would have to use hundreds of screens to respond immediately to each market movement — this is just not possible.” The firm’s answer was automation. By 2022, 75% of Danske’s intraday trades were handled by algorithms, enabling the firm to more than double its monthly traded volumes in a single year and reach second-largest intraday trader by volume on EPEX SPOT. Average daily trade count rose from 15,000 in 2021 to 25,000 in 2022 — a 67% volume increase simultaneously with prices that were multiples higher. More trades at wider spreads is the full arithmetic.
InCommodities runs an analogous model. Its Algo Trader job posting describes a team of 20 quants developing and deploying strategies in Python, running historical backtests, monitoring live performance, and adjusting models when anomalies surface. Goldman Sachs, which took a minority stake in July 2021 valued at approximately DKK 100 million, confirmed the architecture at the time: InCommodities had “built and invested heavily in an energy trading platform that automates the value chain of data analytics, decision making algorithms, execution and settlement.”
Three Simultaneous Revenue Lines
The business is not monolithic “electricity trading.” Three distinct revenue streams run in parallel, each amplifying the others.
Speculative intraday positioning requires no physical generation assets. InCommodities’ FERC application states explicitly that it “does not own any generation assets, and does not plan to own any generation assets.” The forecast edge alone supports profitability in any market with sufficient intraday price dispersion.
Renewables asset optimization is the outsourced trading desk model. Wind and solar farm owners lacking algorithmic infrastructure hand their production schedules to Danske or InCommodities, which optimize execution across day-ahead, intraday, and balancing markets using their own forecast engines. The trading firm captures the spread between achieved revenue and what the farm would have earned independently. InCommodities’ asset management platform runs this automated execution 24 hours a day, 365 days a year. Danske grew its flexible and renewables asset portfolio by 25% in 2022, and incremental forecast improvements compound directly across that installed base.
Cross-border spatial arbitrage was the original business model, identified when Danske was founded in 2004 — buying cheap electricity in surplus zones and selling into deficit zones across national transmission interconnectors. ACER calculated that cross-border trade delivered €34 billion of societal benefit in 2021. The algorithmic traders capture part of that reallocation value as arbitrage profit, operating across 40+ markets simultaneously.
Why 2022 Was Multiplicative, Not Just Additive
These three revenue streams were already operating in 2021. The question is why 2022 generated nine times the profit. The answer has two parts — one obvious, one almost never discussed.
Prior to Russia’s invasion, 35–40% of the natural gas consumed in Europe was imported from Russia. Russian gas supplies came to a near-complete halt in 2022. Gas-fired generation — the marginal price-setter in most European markets — became structurally short. German day-ahead power peaked at €699/MWh in August 2022. The intraday volatility the algorithmic model was designed to exploit reached magnitudes never previously observed.
The model itself did not change. What changed was the size of the spreads it operated on. The same forecast accuracy, applied to multiples-higher absolute prices, generated multiples-higher gross profit per correctly-called position. This is the core arithmetic of the 850% EBT increase.
But there was a second mechanism that most post-mortems miss: the capital constraint that cleared the competitive field.
Danske’s CFO Jakob Sørensen explained the dynamic via Euronews: as prices rise, so do margin call requirements on exchanges, which must be met with posted collateral. At the peak of the summer 2022 crisis, Danske’s invested capital exceeded €9 billion — against adjusted equity of just €529 million entering the year. To remain active, Equinor injected €3.5 billion, bringing total equity to €5,794 million. CEO Helle Østergaard Kristiansen was direct in the 2022 results press release: “There was an extraordinary need for liquidity in 2022 due to the high market prices and subsequent collateral requirements from the exchanges.”
Smaller algorithmic competitors, without access to a parent balance sheet, were forced to reduce position sizes or exit the market entirely during the period of maximum volatility. Fewer competing algorithms plus maximum price dispersion equals maximum profitability for those who remain. InCommodities had Goldman Sachs as a minority investor, providing both capital access and counterparty credibility at a moment when many participants were exiting. The 2022 result reflects not just alpha from the forecast model — it reflects the near-oligopolistic conditions that emerged when margin calls eliminated marginal players.
The Structural Tailwind: Why the Edge Compounds
The forward thesis does not depend on another geopolitical supply shock. It depends on a simpler dynamic: renewable penetration structurally increases the forecast uncertainty that generates the intraday spread.
Germany recorded 301 negative price hours in 2023, rising to 475 in 2024. Across European markets, negative prices occurred for a record 7,841 hours in the first eight months of 2024 alone. The IEA confirmed that by H1 2025, 8–9% of wholesale electricity hours in Germany, the Netherlands, and Spain were negative — up from 4–5% in 2024. Each additional GW of intermittent renewable capacity installed adds forecast uncertainty to the system. The intraday spread between a negative-price surplus hour and a Dunkelflaute shortage spike is not converging — it is widening.
The Dutch ACM’s 2024 market study stated this explicitly: the energy transition “drives the use of algorithms even further” because renewable generation is less predictable, increasing the need for traders to manage positions at the last minute. The same market structure that amplified the 2022 profit is becoming more pronounced — not less — as the renewable buildout accelerates.
Danske has already extended the model to battery storage, optimizing charge/discharge decisions algorithmically across wholesale and ancillary markets — the same forecast-arbitrage logic applied to a dispatchable asset. Every adjacent asset class that can be optimized against intraday price dispersion extends the same moat.
The Regulatory Risk and Its Limits
The ACM study identified two specific manipulation concerns. “Robot battles” occur when two competing algorithms repeatedly outbid each other for the same order before one firm withdraws, sending misleading signals about genuine supply and demand. Algorithmic orders placed at millisecond speeds can also render order books functionally invisible to slower participants. InCommodities’ Head of Compliance Iain McGowan acknowledged publicly via the FT: “With greater quantities of algorithms, the risk of inadvertent market conduct increases.”
REMIT II, in force from May 2024, now requires documented risk controls, pre-trade limits, and five-year development logs per algorithm. The compliance burden is real — but it also functions as a barrier to entry. Firms that built internal compliance infrastructure during 2022–2024 are purchasing regulatory optionality that underfunded entrants will not have. The regulatory environment constrains tactics at the margin while reinforcing the structural advantage of incumbents with the resources to build durable compliance frameworks.
The Core Logic
This is not a commodity trade. It is not a macro view on gas prices. It is a systematic, compounding bet on one structural fact: renewable generators cannot forecast their own output as accurately as a dedicated specialist with better models, faster data ingestion, and higher-resolution NWP post-processing. The spread between those two forecast accuracies is the alpha. The continuous intraday market is where that alpha is monetized. The energy transition guarantees that the spread will not converge — it will widen with every incremental GW of intermittent capacity installed.
Two firms in Aarhus built the infrastructure to capture this before most market participants understood what the opportunity was. Oliver Wyman’s Adam Perkins summarized the situation with precision via the FT: it is already “clear from their profit figures that some participants had better models.” The 2022 profits funded the next generation of those models. The gap does not close — it widens.
🔬 Go Deeper: The Exact Trades, Reconstructed
If this analysis raised the question “but what exactly did they trade, and how?” — I have answered it in full. The Patreon companion piece breaks down every confirmed and inferred trade type with precise entry/exit logic, P&L mechanics, the losing positions and failure modes, and a clear map of what the public record confirms versus what logic infers. It also includes a complete table of all verified facts versus inferred conclusions — so you can build on this research without mixing sources.
→ Read: The Exact Trades — Forensic Reconstruction (Patreon)
All claims are directly sourced with inline hyperlinks to primary sources. Primary references include InCommodities and Danske Commodities 2022 annual reports, EPEX SPOT exchange data, FfE research, IEA Electricity Mid-Year Update 2025, Dutch ACM market study, Equinor press releases, Reuters/Euronews, Bloomberg, and the Financial Times.
About the Author
I write institutional-grade quantitative research on systematic trading, hedge fund strategies, and energy markets. If this analysis was useful to you:
📺 Subscribe on YouTube — The Mathematical Trader — Video breakdowns of systematic strategies and institutional trade analysis.
🔗 Connect on LinkedIn — I post regular research notes and market analysis.
📊 Join the Patreon — Exclusive quantitative research, full trading strategy breakdowns, and institutional-grade analysis published directly to members. The companion piece to this article — The Exact Trades: Forensic Reconstruction — is available now.
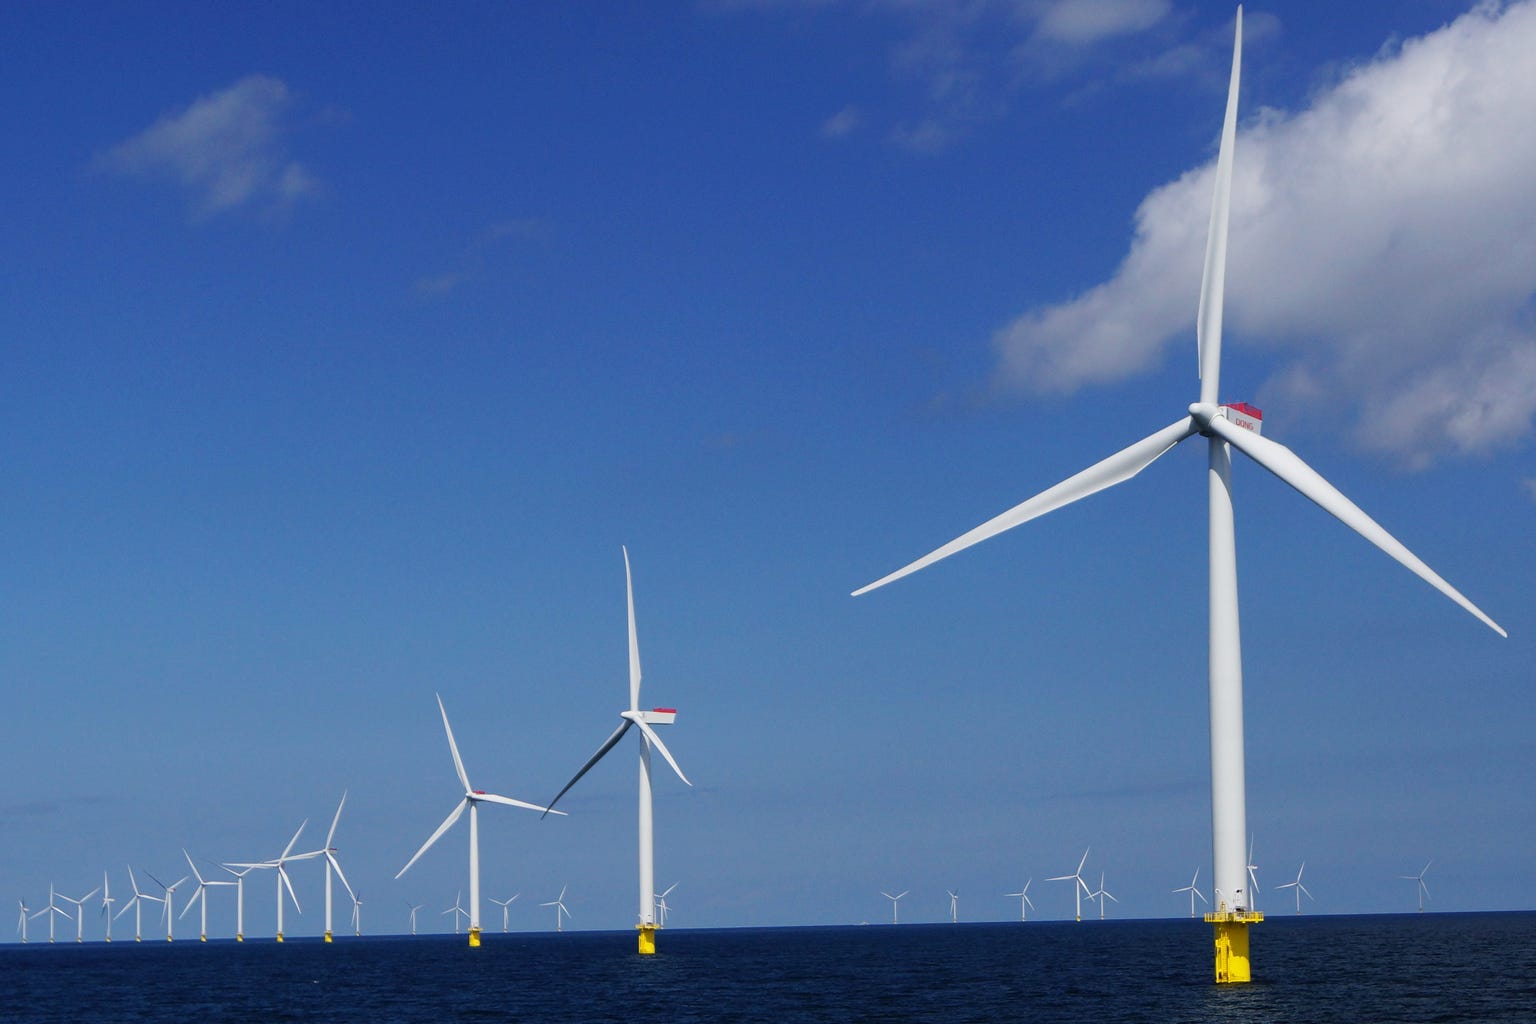
Cover photograph: Old Dane, CC BY-SA 4.0, via Wikimedia Commons.
Cover photograph: Old Dane, CC BY-SA 4.0, via Wikimedia Commons.