


Between 1980 and 2025, US companies left over $250 billion on the table through IPO underpricing, according to Jay Ritter’s authoritative database at University of Florida. While this wealth transfer primarily benefited institutional investors broadly — mutual funds, pension funds, sovereign wealth funds, and hedge funds — a specific subset of hedge funds systematically exploited allocation advantages to capture outsized returns.
This analysis examines how hedge funds with prime brokerage relationships gained a 2.75x allocation advantage over other market participants, positioned in pre-IPO rounds to multiply returns 10–30x, and timed lockup expirations to profit from predictable selling pressure. The mechanics reveal not illegal extraction, but legal exploitation of systematic market inefficiencies.
The Foundation: $250B in Institutional Wealth Transfer
According to Jay Ritter’s IPO data, the IPO underpricing system created unprecedented wealth transfers:
1980–2025 Cumulative Statistics:
Total money left on table: $250.1 billion
Average first-day return: 19.0%
Total IPOs analyzed: 9,343 companies
2020: The Peak Year
Money left on table: $29.7 billion (single-year record)
Average first-day return: 41.6% (highest since dot-com bubble)
Companies analyzed: 165 IPOs raising $61.9 billion
Bill Gurley calculated that 2020’s average company faced a 38% cost of capital: 31% underpricing plus 7% in IPO fees.
Approximately 90% of IPO shares flow to institutional investors. The question becomes: within this institutional allocation system, which players gained systematic advantages?
The Allocation Machine: Hedge Funds’ 2.75x Advantage
NSF-funded research quantified the precise edge hedge funds gained through prime brokerage relationships:
Allocation Probability Analysis:
Hedge funds with prime broker relationships: 37.42% allocation probability
Average unconditional probability: 13.58%
Systematic advantage: 2.75x multiplier
This advantage stems from dual agency conflicts. Underwriters simultaneously represent issuing companies and their prime brokerage clients — the hedge funds who generate the most trading commissions. The research confirms hedge funds with these relationships possess private information about IPO quality, enabling them to secure larger allocations in the most underpriced offerings.
The mechanism creates a self-reinforcing cycle: prime brokers allocate underpriced shares to hedge funds, hedge funds generate trading commissions, underwriters maintain the relationship by continuing favorable allocations.
Layer Two: Pre-IPO Positioning for 10–30x Returns
Beyond allocation advantages, sophisticated hedge funds positioned in pre-IPO secondary markets and late-stage venture rounds, multiplying returns before public trading began.
DST Global’s Facebook Strategy
Yuri Milner’s Digital Sky Technologies demonstrated systematic pre-IPO value extraction:
May 2009: 1.96% stake for $200 million at $10B valuation
January 2011: Goldman Sachs round at $50B valuation (5x markup)
May 2012 IPO: DST realized approximately $1.7 billion
Total return: ~20x on initial investment
The Facebook S-1 filing documents this valuation progression, showing how pre-IPO positioning captured the majority of value creation before public investors gained access.
SoftBank Vision Fund’s Record Quarter
SoftBank’s Vision Fund executed the largest single hedge fund IPO profit in history through Coupang’s March 2021 listing:
Coupang Investment Mechanics:
Total investment: $3 billion across 2015–2018 rounds
IPO stake: 35.1% of company
IPO price: $35 per share
First-day close: $49.25 (40.7% gain)
Market cap at close: $84.47 billion
Peak intraday: $69 (97% gain from IPO price)
Stake value at close: $28 billion (some sources report close to $30 billion)
This single position contributed to SoftBank’s $36.99 billion quarterly profit — the largest quarterly profit ever recorded by a Japanese company.
Additional Vision Fund Documented Gains:
DoorDash: $680M investment → $11.2 billion value (16.5x return)
ARM Holdings: $9.5 billion crystallized profit from 2023 IPO stake sale
Tiger Global’s Systematic 2021 Deployment
Tiger Global positioned in 38 companies that went public in 2021, demonstrating industrial-scale pre-IPO positioning:
Documented Stakes:
By November 2021, Tiger Global had generated $26.5 billion in total returns since 2001 inception, ranking it the #14 most profitable hedge fund in history.
First-Day Wealth Transfers: Documented Examples
Within the broader institutional allocation system, specific 2020–2021 IPOs demonstrate the magnitude of first-day transfers available to allocated institutions:
Snowflake (September 2020)
IPO price: $120
First-day close: $254
Money left on table: $3.8 billion
First-day return: 112%
DoorDash (December 2020)
IPO price: $102
First-day close: $189.51
Money left on table: $2.9 billion
First-day return: 86%
Coinbase (April 2021)
Reference price: $250
Opening price: $381
First-day gain: 52%
Andreessen Horowitz stake: 15.8% ≈ $9.7 billion at opening valuation
These examples illustrate the first-day gains available to institutions with allocation access — gains systematically tilted toward hedge funds with prime brokerage relationships.
The Scandals: When Advantages Became Crimes
The allocation advantage system occasionally crossed from legal exploitation to criminal conduct, revealing the underlying mechanics through enforcement actions.
The $1.4B Global Settlement
The SEC’s 2003 Global Research Analyst Settlement involved 10 major firms paying $1.4 billion for conflicts of interest including “inappropriate spinning of ‘hot’ Initial Public Offering allocations.”
Frank Quattrone’s “Friends of Frank” System
The SEC enforcement action against Credit Suisse First Boston detailed a systematic scheme:
Mechanism:
Allocate underpriced IPO shares to executives at Cisco, Netscape, Amazon
Executives direct future investment banking business to CSFB
CSFB wins lucrative underwriting mandates
This wasn’t allocation advantage through legitimate prime brokerage relationships — it was quid pro quo corruption.
CSFB’s Commission Kickback Scheme
CSFB settled for $100 million in 2002 for a more direct extraction mechanism:
The System:
Normal institutional commission: 6 cents/share
CSFB demanded: $3.15/share (52x normal rate)
Allocation recipients: Primarily hedge funds
The SEC complaint documented how CSFB allocated IPO shares to 100+ customers requiring them to return 33–65% of first-day profits through elevated commissions.
Modern Enforcement: The 2017 Brian Hirsch Case
The 2017 enforcement action demonstrated ongoing allocation manipulation: a broker accepted $1M+ in undisclosed kickbacks for preferential IPO access, subverting stated allocation policies.
These scandals reveal the edge: allocation advantages exist legally through prime brokerage, but the incentives create persistent pressure toward illegal conduct.
Lockup Expiration: Timing Predictable Selling Pressure
Sophisticated hedge funds exploited a different timing advantage: lockup expirations when insiders can finally sell.
Standard Strategy:
Identify IPOs with large insider holdings
Short the stock 30–60 days before lockup expires (typically 90–180 days post-IPO)
Wait for predictable selling flood when insiders liquidate
Cover shorts at depressed prices
Academic research confirms short-selling volume peaks on lockup expiry day, precisely when stock returns hit their lowest point.
Uber Lockup Profits (November 2019)
The Uber lockup expiration demonstrated the strategy’s profitability:
Documented Results:
Short-sellers made $270 million in two days
Short interest: $2 billion (74 million shares on loan)
Stock decline: 34% in Q3 2019
The timing advantage came from public information (lockup dates in S-1 filings) combined with position-building ahead of predictable insider selling.
The Counterexample: When Hedge Funds Lost
The Uber IPO (May 2019) demonstrates allocation advantages don’t guarantee profits. The IPO produced the largest first-day dollar loss in US history: $655 million.
Q3 2019 Hedge Fund Paper Losses (Uber declined 34%):
Dragoneer Investment Group: -$338M
Viking Global Investors: -$178M
Coatue Management: -$166M
Tiger Global Management: -$106M
Lone Pine Capital: -$40.3M
These losses reveal a critical point: allocation advantages provide access to underpriced shares, not immunity from business fundamentals. The hedge funds received allocations, but Uber’s business model struggles overwhelmed the first-day pop advantage.
Paradoxically, underwriters engaged in naked short selling to stabilize the offering — a legal practice demonstrating how the same firms allocating shares to hedge funds simultaneously bet against the stock.
Market Maker Information Asymmetry
Beyond allocation, Citadel Securities serves as Designated Market Maker for over 80% of NYSE IPOs, creating additional information advantages:
DMM Privileges:
Opening auction order flow visibility
Bid-ask spread capture
First-day volatility stabilization mandate
Real-time demand signal access
This role places market makers at the center of IPO price discovery, with access to information unavailable to other participants — including the hedge funds receiving allocations.
SPAC Arbitrage: The Temporary Risk-Free Trade
From 2019–2021, hedge funds exploited SPAC structures for near-risk-free arbitrage:
The Mechanism:
Buy SPAC units at ~$10 (capital held in trust)
If proposed merger unappealing, redeem at NAV ($10)
If merger compelling, hold and profit from warrants
Capture spread between trading price and NAV floor
Documented Profits:
Chamath Palihapitiya created 12 SPACs, pocketing approximately $750 million as sponsor through founder shares and warrants. Retail investors who bought post-merger lost 70–98% on most de-SPAC combinations.
Bill Ackman’s Pershing Square Tontine Holdings raised $4 billion — the largest SPAC ever — but liquidated in July 2022 without completing a deal, returning capital to investors.
The arbitrage window closed as redemption rates exceeded 90% on many 2022 SPACs, eliminating the NAV floor advantage.
The Exception: Google’s Dutch Auction
Google’s 2004 IPO attempted to bypass the allocation advantage system:
Dutch Auction Mechanics:
All investors (retail and institutional) bid shares and price
Uniform clearing price: $85/share
First-day close: $100.34 (18% gain)
Google still left money on table, but substantially less than traditional bookbuilding would have produced. The auction democratized access but couldn’t eliminate underpricing entirely — market dynamics and risk aversion among bidders still created first-day pops.
Quantitative Advantage Summary
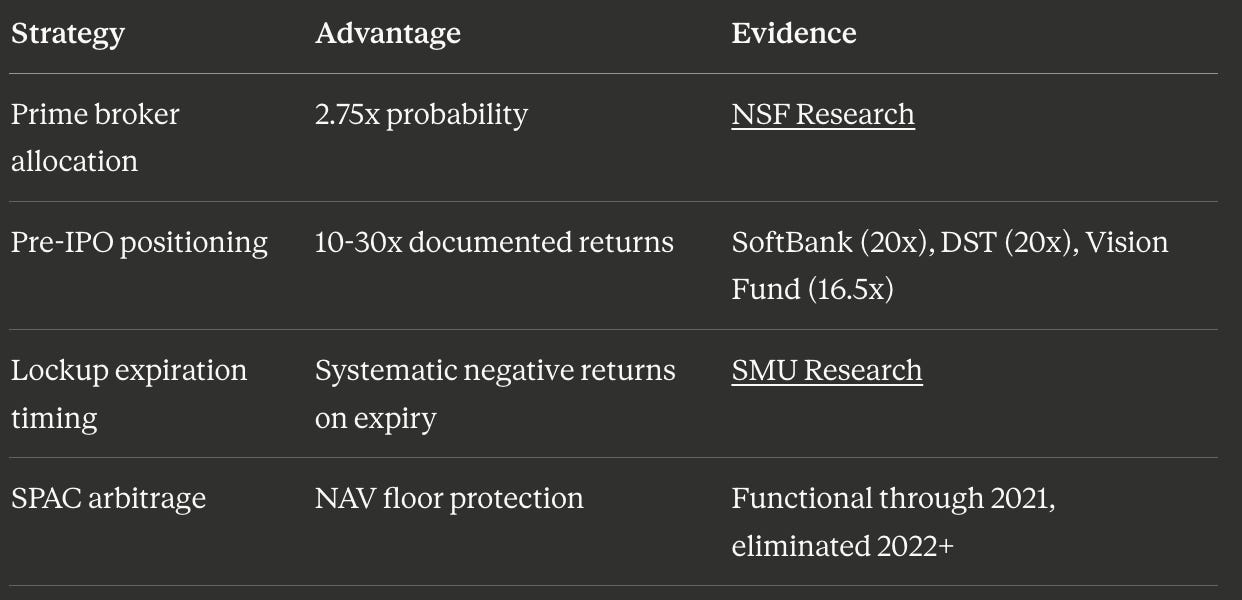
The systematic advantages documented above create measurable, replicable edge:
Historical Underpricing Statistics (1980–2025):
Average first-day return: 19.0%
2020 peak: 41.6%
Dot-com bubble (1999–2000): >60%
Total money left on table: $250.1 billion
Regulatory Framework and Limitations
FINRA Rule 2712 explicitly prohibits allocating IPO shares “as consideration or inducement for excessive compensation.”
Yet systematic allocation advantages persist legally through:
Prime brokerage relationships based on trading volume
Pre-IPO secondary market access (no regulatory restriction)
Public information exploitation (lockup dates, ownership structures)
Market maker privileges (exchange-sanctioned role)
The regulatory framework addresses quid pro quo corruption (Quattrone, CSFB kickbacks) while permitting structural advantages embedded in the underwriting business model.
Conclusion: Systematic Advantages Within a $250B System
Between 1980 and 2025, IPO underpricing transferred $250.1 billion from company founders and employees to institutional investors. Within this system, hedge funds with specific relationships and strategies captured disproportionate returns through:
Primary Allocation Advantages:
2.75x higher allocation probability via prime brokerage relationships
Access to most underpriced offerings through information asymmetries
Concentration of allocations among established institutional players
Secondary Positioning:
10–30x returns documented through pre-IPO venture and secondary positioning
First-mover access to companies years before public listing
Valuation markup capture before retail investor access
Timing Exploitation:
Lockup expiration short-selling based on predictable selling pressure
SPAC arbitrage capturing NAV floor protection (2019–2021)
Market maker information advantages during IPO price discovery
The 2020 peak — $29.7 billion left on table in one year — demonstrates these structural inefficiencies persist despite decades of regulatory intervention. Direct listings, Dutch auctions, and SPAC regulation emerged as partial solutions, though each introduces distinct complications.
For quantitative practitioners, replicable edge exists primarily in pre-IPO secondary markets and systematic lockup expiration strategies. Primary allocation advantages remain concentrated among prime brokerage clients, creating persistent information asymmetries favoring established institutional players.
The system isn’t criminal extraction — it’s legal exploitation of structural market design. The allocation mechanism, created to ensure orderly markets and long-term investor bases, generates systematic advantages for sophisticated players with the right relationships and positioning.
📊 Want Deeper Quantitative Analysis?
This research took very long time of data collection, verification, and analysis. If you found value in this deep-dive, I publish exclusive quantitative research, trading strategies, and institutional-grade analysis on Patreon.
By joining, you’ll be supporting my work and motivating me to publish more content like this.
→ Join the Patreon community here
All figures verified against primary sources including Jay Ritter’s IPO database (University of Florida), SEC enforcement actions, and regulatory settlements. Dollar amounts reflect point-in-time valuations as reported in original filings and press releases.
About the Author
For more quantitative finance analysis and systematic trading research, subscribe to my YouTube channel: The Mathematical Trader
Connect on LinkedIn: Navnoor Bawa
Cover photograph: Billie Grace Ward, CC0, via Wikimedia Commons.