


Hedge funds control $1.85 trillion in Treasury securities through the basis trade — the same structure that unwound catastrophically in March 2020. This time, regulators claim they’re prepared. The April 2025 tariff shock tested that claim.
By The Mathematical Trader | Quantitative Finance Research
The Trade Structure
The Treasury cash-futures basis trade exploits pricing discrepancies between physical Treasury bonds and their corresponding futures contracts. A fund buys the cheapest-to-deliver Treasury note, finances it overnight in repo markets at rates tracking SOFR (approximately 5.3% in late 2024), and sells Treasury futures at CME. The spread — typically 5–15 basis points — becomes profitable only through extreme leverage: 20–100x is standard.
Current scale as of December 2024: Cayman-domiciled hedge funds hold $1.85 trillion in Treasuries, financed with $2.5 trillion in repo borrowing — a 104% surge in two years. Leveraged funds maintain $1.2 trillion in short Treasury futures positions. The true basis trade volume sits between $260–574 billion using Fed TRACE data, substantially below the headline futures figures that include directional positioning.
Why It Exists: Regulatory Arbitrage
The trade doesn’t exist because hedge funds possess superior information — it exists because they face no Supplementary Leverage Ratio constraints. Fed researchers document that dealer banks’ capital requirements and SLR/eSLR limits restrict Treasury-futures intermediation, creating space for hedge fund arbitrage. Between 2017–2019, hedge funds net-purchased $428 billion in Treasuries — nearly matching Fed balance sheet reduction during quantitative tightening — with 91% executed by likely basis traders. The Fed notes these funds were “essentially warehousing Treasury securities on behalf of non-hedge fund asset managers.”
Asset managers systematically prefer futures for capital efficiency. Between October 2022 and May 2023, asset manager long futures positions expanded while hedge fund shorts grew to fill a $304 billion demand imbalance. By May 2023, asset manager longs exceeded hedge fund shorts by just $34 billion, down from $338 billion seven months earlier.
March 2020: Anatomy of the Unwind
BIS researchers Andreas Schrimpf, Hyun Song Shin, and Vladyslav Sushko documented the mechanism: “For a two-week period in mid-March 2020, government bond markets experienced uncharacteristic turbulence, sometimes selling off sharply in risk-off episodes when they would normally attract safe haven flows. Evidence in the U.S. Treasury market points to forced selling of Treasury securities by investors who had attempted to exploit small yield differences through the use of leverage.”
The numbers from Fed Form PF analysis: Hedge funds sold $173 billion in Treasuries (net, after valuation adjustments) and reduced total Treasury exposure by $426 billion. Short derivatives positions fell $232 billion. Basis traders accounted for 90% of hedge fund Treasury sales during the crisis. The Federal Reserve ultimately purchased $1.6 trillion in Treasuries to stabilize markets.
Risk transmission operated through four channels: futures variation margin calls as 10-year yields swung 75+ basis points intraday, repo rollover failures as GC rates spiked, basis widening creating mark-to-market losses, and internal VaR breaches at hedge funds triggering forced liquidations.
April 2025: A Different Outcome
The April 2, 2025 tariff announcement tested the system. 30-year Treasury yields surged approximately 46–50 basis points in the week ending April 11 (April 4–11, 2025) — among the sharpest weekly increases in decades. Unlike March 2020, basis positions remained stable. The key difference: the Standing Repo Facility established in July 2021 provided overnight backstop liquidity, preventing funding squeezes.
NY Fed official Roberto Perli noted in May 2025: “In March 2025, leveraged funds’ notional value of short Treasury futures positions with maturities up to 10 years stood at about $1 trillion, well above levels observed in February 2020. The sudden unwind of those trades could have been an additional and significant source of market instability. But this by and large did not happen in April since repo rates were fairly stable and dealers remained willing and able to intermediate.”
The trade experienced some deleveraging — market desk estimates suggest average gross notional fell approximately 10% over three trading sessions — but margin calls were met without cascade failures. BIS analysis shows the cash-futures basis trade has largely stagnated since Q2 2024, with growth shifting to Treasury-swap spread trades.
Concentration Amplifies Systemic Risk
Fed Form PF data reveals extreme concentration: the top 50 hedge funds control 85% of Treasury exposure and 90% of repo activity, yet represent less than 3% of qualifying hedge funds. This concentration matters because 70%+ of non-centrally cleared bilateral repo transacts with zero or negative haircuts. The NY Fed’s Treasury Market Practices Group recommends implementing prudent haircuts by June 2026 to manage counterparty credit risk in default scenarios.
Key participants include Citadel, Millennium Management, and ExodusPoint Capital Management. These multi-strategy platforms combine basis trading with other relative value strategies, creating operational leverage across multiple arbitrage positions. Industry reporting identifies specific desks within these firms as major basis trade operators, though precise position sizes and returns remain proprietary.
Regulatory Response: Partial Solutions
Post-2020 reforms target clearing and transparency but leave leverage unconstrained:
Implemented measures: The SEC Treasury Clearing Rule mandates central clearing for eligible Treasury transactions by December 31, 2026 (cash) and June 30, 2027 (repo), extended one year in February 2025. The OFR began collecting non-centrally cleared bilateral repo data with Category 1 reporting starting December 2024. SEC Form PF amendments require more granular hedge fund reporting by October 2026. CME and DTCC launched enhanced cross-margining in January 2024, reducing margin requirements by approximately $8 billion daily through portfolio offsets.
Missing elements: No uniform margin requirements exist for non-bank arbitrageurs — leverage constraints remain asymmetric between banks and hedge funds. No hard leverage caps limit position sizing in Treasury relative value trades. Real-time position reporting remains unavailable; Form PF data lags by more than one quarter. Comprehensive NCCBR data collection won’t be complete until July 2025.
Measurement Precision Matters
Fed researchers developed a hierarchy of measurement proxies, with validation from OFR working papers:
CFTC leveraged fund shorts ($1.2 trillion): Overestimates basis trade volume by including directional positioning and other relative value strategies. CFTC analysis acknowledges this proxy captures multiple strategies. Weekly frequency, one-week lag.
Form PF net repo ($574 billion, September 2023): Moderately overestimates because hedge funds use more repo than reverse repo in non-basis trades. Quarterly frequency, approximately 90–120 day reporting lag.
TRACE cash-futures proxy ($317 billion, January 2024): Most accurate measure, identifying Treasury purchases with simultaneous futures sales through FINRA TRACE transaction-level data. Daily frequency, one-day lag. May underestimate if dealers can’t flag all offsetting futures legs.
True basis trade volume therefore sits in the $260–574 billion range, not the headline $1 trillion+ futures figures.
The P&L Formula
The option-adjusted basis net of carry (OABNOC) captures expected returns:
OABNOC = [(CF × P_F + AI + O - P_T) / P_T × (360/t)] - R_Repo
Where CF is the conversion factor, P_F is futures price, AI is accrued interest, O is delivery option value (timing and quality options), P_T is the full Treasury price, R_Repo is the bond-specific term repo rate, and t is days to optimal delivery. The delivery option value — driven by yield volatility, curve shape, and financing rates — typically contributes 1–3 basis points.
At current levels (5.3% repo, 5–15 bp positive basis), unlevered returns are uneconomic. A 50x levered position transforms 10 bp into 500 bp (5%) annual returns — a stylized calculation that abstracts funding volatility, margin dynamics, and option complexity. The actual edge derives entirely from providing balance sheet capacity banks cannot offer: regulatory arbitrage, not informational advantage. Returns materialize only when overnight funding remains stable and variation margin calls don’t force liquidation.
Implications for Quants
The fragility is the feature. Returns come from warehousing systemic risk during normal markets and harvesting the spread between Treasury cash and futures implied repo rates. Position sizing, repo access stress-testing, and VaR headroom matter more than basis prediction models. The trade’s profitability depends on overnight funding remaining available precisely when variation margin calls hit hardest.
Leading indicators to monitor: GC repo rate volatility and Treasury-OIS spreads provide early warning signals. The SOFR-BGCR-TGCR spread complex indicates funding stress. Widening Treasury term premium relative to swaps suggests balance sheet constraints binding. CFTC Commitments of Traders reports show positioning buildup with one-week lag.
The regulatory incompleteness matters. Clearing mandates reduce bilateral counterparty risk but concentrate exposure at FICC. Increased transparency helps regulators but doesn’t constrain leverage. Zero-haircut repo persists because competitive dynamics prevent unilateral margin increases. The Standing Repo Facility backstops funding but creates moral hazard — knowing the Fed will provide overnight liquidity encourages larger positions.
The Persistent Paradox
Treasury market liquidity increasingly depends on highly leveraged, highly concentrated, non-bank arbitrage. The same structure that forced $173 billion in distressed sales in March 2020 now operates at larger scale. The April 2025 shock tested the new infrastructure — the Standing Repo Facility worked, basis positions held — but extrapolating from one episode to systemic stability commits the classic mistake of generals preparing for the last war.
The next stress may not originate in repo funding. It could emerge from simultaneous deleveraging across multiple relative value strategies, from regulatory change affecting futures margining, from geopolitical shocks impacting foreign demand for Treasuries, or from correlations breaking down between cash and derivatives markets in ways that overwhelm option-adjusted models.
What remains certain: the basis trade’s returns derive from providing liquidity precisely when markets are stable and balance sheet capacity is abundant. That capacity disappears exactly when needed most — the fundamental risk of any leveraged arbitrage. The question isn’t whether the trade can survive normal volatility, but whether $2 trillion in notional exposure can unwind without amplifying the next shock.
For more quantitative finance research and analysis:
Subscribe to The Mathematical Trader on YouTube for deep dives into systematic trading strategies, institutional arbitrage mechanics, and quantitative market structure analysis.
Sources verified January 2026. All hyperlinks lead directly to Federal Reserve research (FEDS Notes, Financial Stability Reports), BIS publications (Schrimpf, Shin, Sushko 2020), SEC filings and press releases, CFTC Commitments of Traders data, NY Fed speeches (Perli 2025) and documentation, OFR Hedge Fund Monitor and working papers, and market infrastructure providers (CME Group, DTCC). Scale figures ($1.85T Cayman holdings, $2.5T repo, $173B March 2020 sales), regulatory timelines (Dec 2026/June 2027 clearing deadlines), and historical unwind data cross-verified against multiple primary sources. Firm participation assessments based on industry reporting and market intelligence; specific trader attributions and proprietary performance figures cannot be independently verified through public filings.
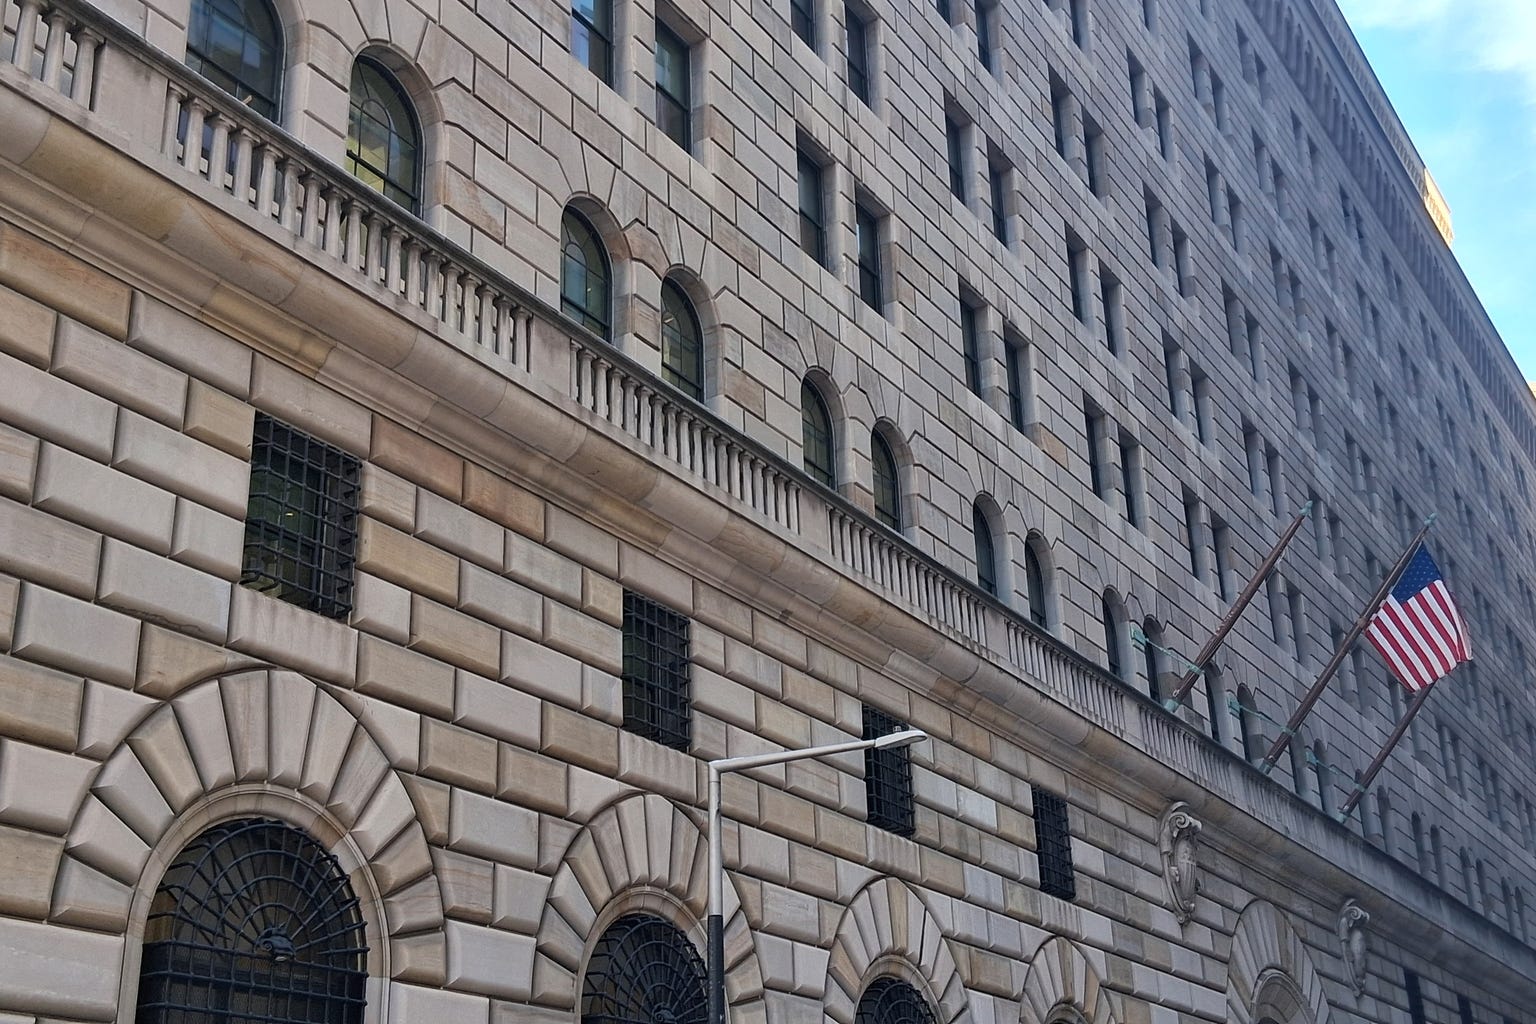
Cover photograph: Kidfly182, CC BY 4.0, via Wikimedia Commons.
Cover photograph: Kidfly182, CC BY 4.0, via Wikimedia Commons.