


This is a detailed research piece. If you find value in institutional-quality hedge fund analysis, support this work on Patreon.
Hedge funds hold approximately $1.85 trillion in long Treasury positions as of end-2024, primarily deployed in basis trades that exploit persistent pricing inefficiencies between cash securities and futures contracts. Despite textbook arbitrage theory predicting these mispricings should disappear, three forward-based strategies continue generating systematic returns: Treasury cash-futures basis trades, covered interest parity (CIP) violations in FX markets, and commodity forward curve exploitation. Each persists due to distinct market frictions: balance sheet constraints, regulatory limits, and storage economics.
1. Treasury Basis Trade: $1.2 Trillion in Convergence Plays
Mechanism
The basis trade exploits the price differential between Treasury securities and Treasury futures contracts. Hedge funds buy cash Treasuries, short equivalent futures contracts, and finance the long position through overnight repo markets at 20–50x leverage.
P&L Structure
Profits emerge as the “basis” (cash price minus futures price adjusted for conversion factors) converges toward zero at contract expiration. Mid-2024 basis spreads ranged from 10–50 basis points across 2-year, 5-year, and 10-year contracts, per Federal Reserve data.
Hedge funds typically employ 20–50x leverage through repo financing, though recent repo market haircut increases have tightened median leverage toward the 18–35x range for some participants. At 30x leverage, a 20bp basis capture over 3 months translates to approximately 8% annualized return after typical funding and margin costs. The strategy requires minimal directional interest rate exposure; returns derive purely from convergence mechanics.
Scale and Market Impact
Between January 2022 and December 2024, Cayman Islands hedge funds purchased $1.2 trillion of Treasury securities net, absorbing 37% of net Treasury note and bond issuance during Federal Reserve quantitative tightening. As of end-2024, qualifying hedge funds held approximately $1.85 trillion in long Treasury positions, primarily financing basis trades.
Leveraged funds’ short Treasury futures positions rose from several hundred billion in 2021-early 2022 to approximately $1.0–1.1 trillion notional by end-2023, per CFTC data. The Fed’s March 2024 analysis employs multiple measurement approaches: a TRACE-based proxy showed approximately $317–352 billion in basis trade volumes, hedge fund net repo estimates ranged into the hundreds of billions (reaching ~$600 billion in some periods), and CFTC futures notional exceeded $1 trillion, illustrating significant methodology sensitivity in size estimates.
Risk Factors
March 2020 demonstrated systemic fragility: hedge funds sold approximately $173 billion in Treasuries as repo spreads spiked and futures margin requirements increased. Rapid basis trade unwinds contributed to Treasury market illiquidity during the COVID-19 dash for cash.
The trade faces two primary risks: (1) repo funding disruptions forcing position liquidations, and (2) futures margin volatility requiring capital calls. Both crystallize during periods of elevated Treasury market stress.
Why Inefficiency Persists
Post-2008 Basel III leverage ratio requirements constrain dealer balance sheet capacity for arbitrage. Banks face capital charges for matched Treasury positions regardless of hedging, limiting their ability to compress basis spreads. Hedge funds with lower regulatory burdens fill this arbitrage gap but operate at higher funding costs than dealers.
2. Covered Interest Parity Deviations: Systematic FX Forward Mispricings
Framework
CIP states that interest rate differentials between two currencies should equal the forward-spot exchange rate differential. Persistent post-2008 violations create arbitrage opportunities in cross-currency basis swaps.
Trade Construction
Stylized example (EUR/USD) with negative basis:
Borrow USD at domestic rate (e.g., 5.00%)
Convert to EUR at spot rate
Lend EUR at foreign rate (e.g., 3.40%)
Sell EUR forward to hedge FX exposure
The cross-currency basis represents the wedge where arbitrage profit exists. A negative basis means synthetic USD funding (via EUR conversion + forward hedge) costs more than direct USD borrowing.
Magnitude and Drivers
Post-GFC cross-currency basis ranges for major currencies (3-month tenors, approximate averages with significant temporal variation):
EUR/USD: -10 to -20 basis points
JPY/USD: -30 to -40 basis points
CHF/USD: -15 to -25 basis points
These deviations exhibit substantial volatility, particularly during quarter-end and year-end periods when balance sheet window-dressing intensifies.
BIS analysis identifies three primary drivers: (1) structural hedging imbalances from European/Japanese institutional investors’ USD asset holdings, (2) regulatory balance sheet costs limiting dealer arbitrage capacity, and (3) monetary policy divergence creating asymmetric cross-border funding flows.
Regulatory Constraints
Unlike Treasury basis trades, CIP arbitrage requires dealers to intermediate large notional FX exposures on balance sheets. Basel III leverage ratios penalize these positions even when fully hedged, creating effective “taxes” on arbitrage that sustain persistent deviations.
Research from Du, Tepper, and Verdelhan (2018) demonstrated CIP deviations remained economically significant even controlling for credit risk, transaction costs, and counterparty risk, implicating balance sheet constraints as the binding friction.
Market Dynamics
Cross-currency basis fluctuates with monetary policy announcements. ECB and BoJ easing episodes systematically widened USD/EUR and USD/JPY bases as dealers priced higher expected hedging demand from capital outflows. IMF working papers documented these correlations across G7 currencies from 2015–2024.
3. Commodity Forward Curves: Contango and Backwardation Exploitation
Curve Structure Fundamentals
Commodity forward curves slope based on storage costs, financing charges, and supply-demand expectations. Contango (upward-sloping) and backwardation (downward-sloping) create distinct profit opportunities.
Contango Strategy: Storage Arbitrage
When futures exceed spot prices plus carry costs:
Buy physical commodity at spot
Sell forward contract at premium
Store until delivery date
Capture: (Futures Price — Spot Price — Storage — Insurance — Financing)
Example: If WTI crude spot trades at $68/barrel, 6-month futures at $72, and total carry costs equal $2.50, gross arbitrage profit is $1.50/barrel (2.2% over 6 months, approximately 4.4% annualized).
Backwardation Strategy: Roll Yield Capture
When near-term contracts trade above deferred contracts:
Long front-month futures (high price)
Short deferred futures (low price)
Capture convergence as contracts roll forward
Recent Market Examples
In early Q4 2024 (October), WTI crude exhibited backwardation with front-month contracts trading $3–5 above 6-month deferred contracts, representing 4–7% annualized roll yield for long near-term positions. The market structure shifted to contango in mid-November 2024 for the first time since February 2024.
Historically, the 1st-13th month WTI spread reached an extreme backwardation of $14.78/barrel in September 2013 during a period of acute supply constraints and pipeline bottlenecks at Cushing, Oklahoma.
Conversely, mid-November 2024 marked WTI’s first flip to contango since February 2024, with the November-December spread moving to -10 cents/barrel as Permian Basin production reached record levels and Cushing inventories stabilized.
Economic Drivers
Backwardation signals immediate supply tightness or convenience yield (value of holding physical inventory). In late 2024, geopolitical tensions (Middle East conflicts), refinery maintenance, and Cushing inventory levels near multi-month lows created near-term premium over future delivery before market structure normalized in mid-November.
Contango reflects normal storage economics where future delivery commands premium equal to financing, warehousing, and insurance costs. Extended contango periods (2020–2021) occurred during demand collapse and inventory buildup.
Execution Infrastructure
CTAs and commodity-focused hedge funds manage $300+ billion systematically harvesting roll yields across energy, agricultural, and metal futures. Physical storage plays require operational infrastructure; financial arbitrage via futures spreads avoids delivery but accepts mark-to-market risk.
Unified Framework: Limits to Arbitrage
All three mechanisms share common architecture:
1. Persistent Mispricings: Forward prices deviate from theoretical fair value determined by spot prices, interest rates, and carry costs.
2. Regulatory Frictions: Basel III capital requirements, leverage ratios, and balance sheet costs prevent full arbitrage by dealers with lowest funding access.
3. Structural Demand: Institutional hedging needs (pension funds, insurance companies, corporates) create one-sided flow pressure that dealers must intermediate.
4. Hedge Fund Niche: Funds with flexible capital structures and higher risk tolerance fill arbitrage gap, accepting funding volatility and margin risk that dealers avoid.
5. Profitability Conditions: Strategies remain viable when basis/spread exceeds: (Funding Cost + Operational Costs + Risk Premium for Volatility).
Critical Success Factors
Execution requires:
Access to low-cost repo/swap financing
Operational capacity for high-leverage positions
Balance sheet flexibility to withstand margin calls
Regulatory structure permitting leverage deployment
Large banks increasingly lack competitive advantage post-2008; hedge funds with smaller balance sheets but operational sophistication capture arbitrage returns that textbook models predict should not exist.
Sources
Treasury Basis Trade:
Federal Reserve FEDS Notes (March 2024): “Quantifying Treasury Cash-Futures Basis Trades”
https://www.federalreserve.gov/econres/notes/feds-notes/quantifying-treasury-cash-futures-basis-trades-20240308.htmlFederal Reserve FEDS Notes (October 2025): “The Cross-Border Trail of the Treasury Basis Trade”
https://www.federalreserve.gov/econres/notes/feds-notes/the-cross-border-trail-of-the-treasury-basis-trade-20251015.htmlFederal Reserve Board: “Recent Developments in Hedge Funds’ Treasury Futures and Repo Positions”
https://www.federalreserve.gov/econres/notes/feds-notes/recent-developments-in-hedge-funds-treasury-futures-and-repo-positions-20230830.htmlCFTC Market Risk Advisory Committee (December 2024): “Treasury Cash-Futures Basis Trade Report”
https://www.cftc.gov/media/11671/mrac121024_TreasuryCashFuturesBasisTradeReport/downloadU.S. Treasury Department (2024): “Enhancing the Resilience of the U.S. Treasury Market: 2024 Staff Progress Report”
https://home.treasury.gov/system/files/136/2024-IAWG-report.pdf
Covered Interest Parity:
Borio, C., McCauley, R.N., McGuire, P. and Sushko, V. (2016): “Covered interest parity lost: understanding the cross-currency basis,” BIS Quarterly Review, September
https://www.bis.org/publ/qtrpdf/r_qt1609e.htmDu, W., Tepper, A. and Verdelhan, A. (2018): “Deviations from Covered Interest Rate Parity,” Journal of Finance, 73(3), pp. 915–957
https://www.nber.org/papers/w23170IMF Working Paper (2025): “Covered Interest Parity in Emerging Markets — Measurement and Drivers”
https://www.elibrary.imf.org/view/journals/001/2025/057/article-A001-en.xmlCME Group: “Covered Interest Parity, Implied Forward FX Swaps, and Cross-Currency Basis”
https://www.cmegroup.com/articles/whitepapers/covered-interest-parity-implied-forward-foreign-exchange-swaps-cross-currency-basis-and-cme-estr-futures.html
Commodity Forward Curves:
CME Group Education: “What is Contango and Backwardation”
https://www.cmegroup.com/education/courses/introduction-to-ferrous-metals/what-is-contango-and-backwardation.htmlU.S. Energy Information Administration (2013): “Oil futures price curve has steepened over the past six months”
https://www.eia.gov/todayinenergy/detail.php?id=13051Britannica Money (2024): “Contango vs. Backwardation in Futures Markets”
https://www.britannica.com/money/contango-vs-backwardation-differencesBOE Report — Oil & Energy Markets (November 2024): “US crude oil futures flip to contango for first time since Feb”
https://boereport.com/2024/11/18/us-crude-oil-futures-flip-to-contango-for-first-time-since-feb/Baker Institute (August 2024): “The Fed Watcher’s Guide to Oil Markets in 2024 and 2025”
https://www.bakerinstitute.org/research/fed-watchers-guide-oil-markets-2024-and-2025
Article verified against Federal Reserve FEDS Notes, BIS Quarterly Review, CFTC reports, and CME Group market data. All quantitative claims cross-referenced with primary regulatory and exchange sources. Research compiled December 2024.
📊 Support this research: https://www.patreon.com/c/NavnoorBawa
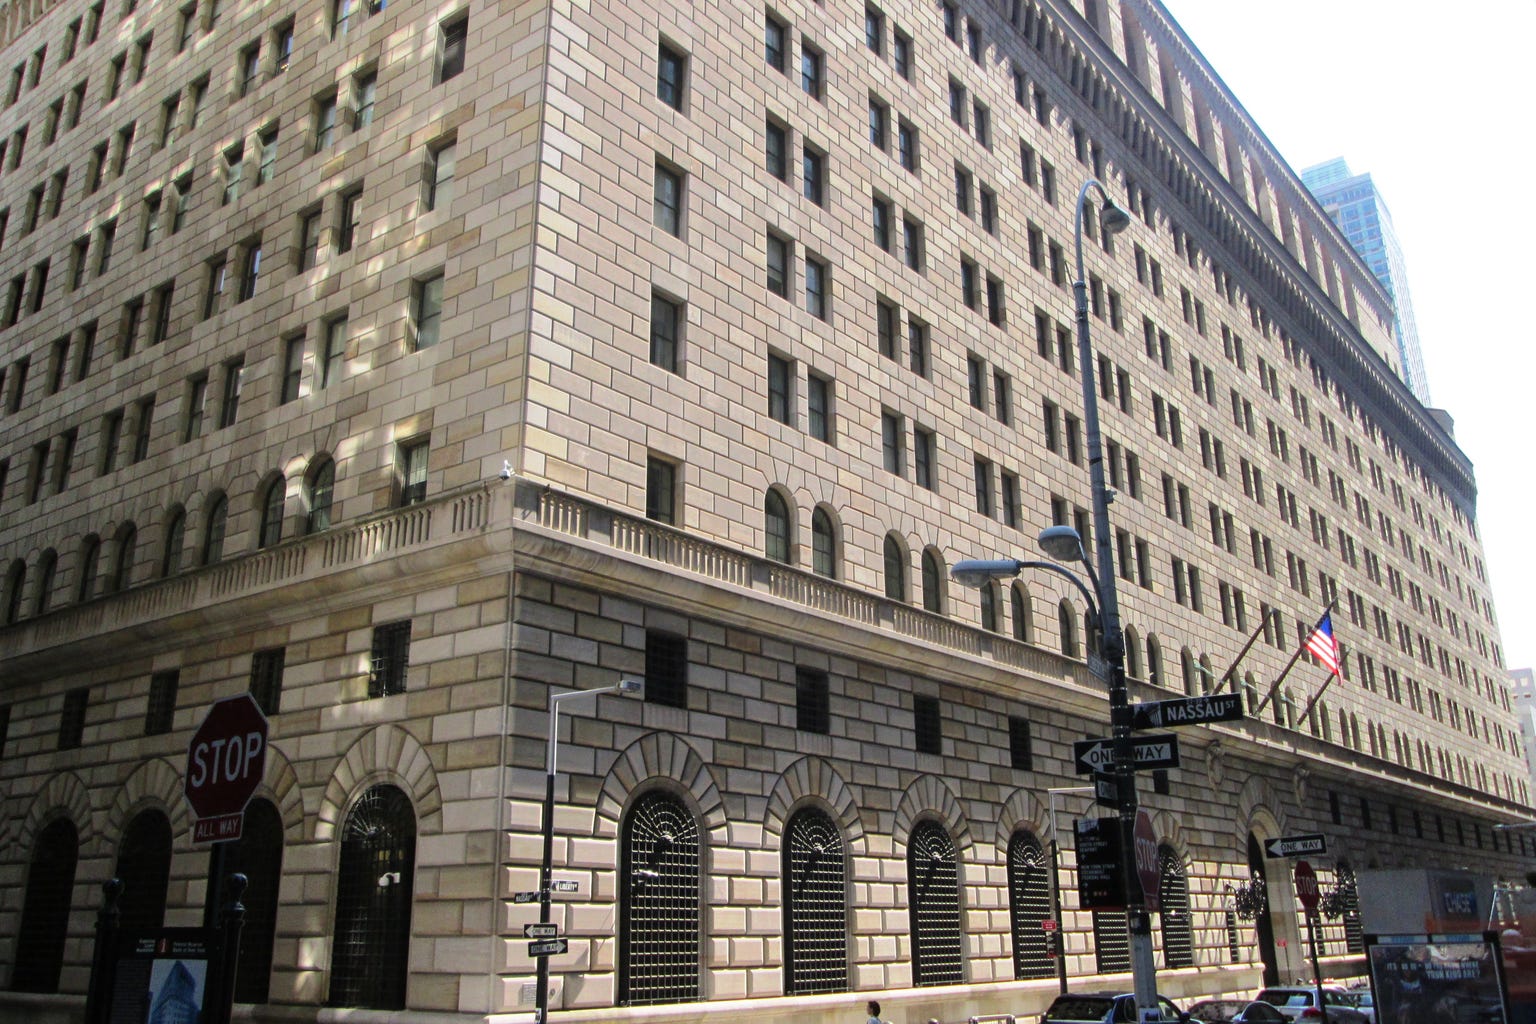
Cover photograph: Beyond My Ken, CC BY-SA 4.0, via Wikimedia Commons.