


In 2025, TCI Fund Management generated $18.9 billion in net gains — the largest single-year profit ever recorded by any hedge fund, surpassing Citadel’s $16 billion record from 2022. Since launching in January 2004, the London-based activist hedge fund has compounded $68.4 billion in total net gains with an 18% annualized return versus 9% for the S&P 500 over the same period — a difference that compounds to roughly 38x vs. 6.7x cumulative returns.
This breakdown examines the specific trade prices, court cases, failed campaigns, and exact decision criteria that explain how Chris Hohn’s concentrated 9-stock portfolio generates alpha.
Chris Hohn’s Investment Philosophy: Moats Trump Everything
In his May 2025 interview with Nicolai Tangen, Chris Hohn articulated TCI’s core investment criterion with precision:
“I think this is something a lot of people get wrong. They think it’s about growth, often. Or something new. Neither of those things, in themselves, to us, matter by themselves. The most important thing… is high barriers to entry. The moats that Warren Buffett has talked about.”
On when to sell:
“When it’s a view of intrinsic value that is not as good as other things. Not just value, but conviction.”
On company persistence:
“If you find a company that is going to be a good company long-term, then you should hold on to it because there’s a persistency of these barriers to entry. In simple terms: good companies stay good and bad companies stay bad.”
TCI’s process: identify moats first, then value. Financial models are irrelevant if barriers to entry don’t pass inspection. The fund excludes entire industries — banks, retailers, commodity manufacturers, airlines, automotive, insurance — due to high competition and limited pricing power.
TCI’s 2025 Portfolio Strategy: 9 Concentrated Positions, $52.7 Billion
TCI’s Q3 2025 13F filing reveals extreme concentration: 9 holdings with top 5 representing 84% of the $52.7 billion portfolio.
Important: 13F filings only disclose US-listed securities. TCI’s total AUM includes non-US holdings (such as Safran, Aena, and other European companies) that do not appear in 13F reports. The $52.7 billion represents TCI’s US-listed equity positions only.
Current Portfolio Allocation (Q3 2025 — US holdings only):
GE Aerospace: 27.1% ($14.3B)
Visa: 18.2% ($9.6B)
Microsoft: 16.3% ($8.6B)
Moody’s: 12.0% ($6.3B)
S&P Global: 10.3% ($5.4B)
Canadian Pacific: 7.0% ($3.7B)
Alphabet: 3.5% ($1.8B)
Canadian National: 3.4% ($1.8B)
Ferrovial: 2.1% ($1.1B)
Average holding period: 8 years per Hohn’s statements. Portfolio turnover: 11.1%.
The Trades: Reconstructed Entry Analysis and Verified Returns
Methodology Note: 13F filings disclose position sizes and market values at quarter-end but do not reveal actual trade execution prices or cost basis. Price ranges below are estimated by cross-referencing documented accumulation periods (from quarterly 13F changes) with historical stock prices during those quarters. Actual TCI entry prices may differ.
GE Aerospace: The Position That Made 2025
TCI built its GE Aerospace position across multiple quarters starting in early 2023. Based on GE’s stock price history during TCI’s documented accumulation periods (per 13F filings), estimated entry ranges were:
Q1 2023: ~$66–94
Q2 2023: ~$94–110
Q1 2024: ~$99–144
Late 2025: Stock traded in $290–320 range
Return: Approximately 3.1x to 4.8x from initial accumulation range to late-2025 prices. GE stock gained approximately 80% in 2025 alone, fueled by strong aerospace performance. Now TCI’s largest holding at 27% of portfolio.
Moody’s: The Perfect Cycle Trade
TCI has held Moody’s through multiple cycles, using sell discipline to take profits and reenter at higher valuations when conviction warranted. Based on historical price action during TCI’s documented holding periods:
2008–2009 crisis accumulation: ~$50 range
Partial exit when doubled: ~$100 range
Repurchase at higher levels: ~$150+ range
Q3 2025 quarter-end: ~$476
Return: Approximately 9–10x from financial crisis entry points to Q3 2025, demonstrating the power of holding monopolistic credit rating agencies through economic cycles.
Visa: Building the “Global Tollbooth”
TCI’s Q3 2025 13F filing revealed aggressive accumulation:
Verified: +47% stake increase (added approximately 8.99M shares per 13F)
Verified: Q3 2025 position value: $9.58 billion
Verified: Q3 2025 quarter-end price: ~$341
Estimated: Based on timing of documented accumulation, average entry likely in $250–270 range
Return: Approximately 25–35% gain from estimated accumulation range to Q3 2025 quarter-end. TCI’s aggressive buying in Q3 2025 signals strong conviction in digital payments infrastructure and Visa’s global network effects.
CSX vs. TCI: The Court Case That Revealed the Derivative Tactic
CSX Corporation v. TCI (2007–2008): Total Return Swaps as Stealth Accumulation
The Southern District of New York case exposed TCI’s most sophisticated accumulation method:
The Setup:
TCI wanted to launch activist campaign at CSX railroad
Used cash-settled total return swaps (TRS) to build economic exposure
TCI gained exposure to 14% of CSX ($2.5B+ notional) without direct ownership
Counterparties hedged by purchasing actual CSX shares
TCI distributed swaps among multiple counterparties so no single entity held 5%+ (avoiding 13D disclosure)
TCI’s Admitted Intent: Expert testimony and court findings revealed TCI entered swaps “to acquire an interest without disclosure to the market or the company” to avoid stock price increases.
Court Ruling: The District Court found TCI violated Section 13(d) of the Securities Exchange Act, ruling TCI used TRS as a “plan or scheme to evade” disclosure requirements under Rule 13d-3(b). Court issued permanent injunction against future violations.
Appellate Outcome: The Second Circuit later vacated the permanent injunction and notably did not resolve the broader question of whether cash-settled swaps confer beneficial ownership, noting “disagreement within the panel.” This left the beneficial ownership issue unresolved in securities law.
Practical Outcome: Despite the legal controversy, TCI won 4 of 5 board seats at the CSX shareholder meeting. CSX stock subsequently fell 50% and TCI exited the position.
Significance: The case established important precedent on equity swap disclosure requirements but crucially left unresolved whether cash-settled total return swaps automatically confer beneficial ownership in all circumstances. The legal ambiguity means sophisticated funds can still use derivatives for economic exposure, though with heightened scrutiny. TCI’s demonstrated tactic: use derivatives for stealth accumulation, then convert to direct ownership before launching activism.
The Failed Campaigns: What TCI Doesn’t Advertise
J-Power Japan (2008): Government Blocks Foreign Activist
The Campaign:
TCI held 9.9% stake, sought to increase to 20%
Demanded double the dividend (¥60 → ¥120)
Demanded 3 outside directors
Demanded ¥70 billion share buyback
Demanded limits on cross-shareholdings
What Happened:
Japanese government blocked TCI’s stake increase from 9.9% to 20% under Foreign Exchange and Foreign Trade Law
First time national security law used against foreign investor
Government cited concerns TCI could cut investment in nuclear facilities and power infrastructure
Hohn’s Response: “TCI is unlikely to make further investments in Japan. I would advise investors to avoid the country.”
Lesson: Activism fails when government controls strategic sectors and can invoke national security.
Coal India (2010–2014): Emerging Market Pricing Power Failure
The Investment:
Acquired 1.8% stake (11 crore shares) at 2010 IPO
Sued Coal India directors for selling coal below market prices
Claimed company lost billions in pre-tax profits
What Happened:
Coal India refused to raise prices (government-controlled pricing)
TCI abandoned entire stake by October 2014
Lesson: Activism fails when government controls pricing mechanisms in state-influenced companies.
Safran/Zodiac (2017): When Shareholders Vote Against You
TCI’s Position: ~4% of Safran
The Fight:
TCI valued Zodiac at €7–10 per share
Safran offered €29.50 per share
TCI called it “massive value destruction”
Created website: www.astrongersafran.com
Threatened to sue board members personally
Demanded shareholder vote
What Happened:
Safran completed acquisition anyway (February 2018)
TCI’s opposition failed
Irony: TCI remains a Safran shareholder (Safran is French-listed and does not appear in US 13F filings), and Safran stock gained 40.22% in 2025, vindicating the long-term quality of the underlying business despite TCI losing the acquisition vote.
The Wins That Made Billions
ABN AMRO (2007): $1 Billion on 1% Stake
Position: Only 1% stake
Demand: Solicit takeover offers or spin off assets
Outcome:
ABN AMRO sold to RBS/Fortis/Santander consortium
Acquisition price: €38.40 per share
Total deal: €71 billion
ROI: Massive return on minimal stake. Demonstrates power of activism to create catalysts even with small ownership.
Deutsche Börse (2005): CEO Takedown
Position: Major stake with Atticus Capital
Fight: Block London Stock Exchange acquisition
Outcome:
CEO Werner Seifert resigned
Chairman resigned
LSE acquisition blocked
Capital returned to shareholders
Cultural Impact: Seifert published “Invasion of the Locusts,” calling Hohn’s tactics “poison.”
Canadian National Railway (2022): CEO Replacement
Position: 5%+ stake ($4+ billion)
The Fight:
Called bid a “basic misunderstanding of the railroad industry”
Demanded CEO replacement
Proposed Jim Vena as candidate
Outcome:
New CEO Tracy Robinson appointed (January 2022)
Two TCI-backed directors added to board
The Sell Discipline
TCI’s selling criteria from Hohn interviews:
1. Intrinsic Value Comparison
“When our view of intrinsic value is not as good as other things — not just value, but conviction.”
2. Profit Taking at Peaks
TCI sold Visa shares in 2023 while price was rising. Trimmed Moody’s in Q3 2023 during price ascent.
3. Barrier Erosion
If competitive dynamics shift or moat weakens, TCI exits.
4. Capital Reallocation
Q3 2025: Trimmed Canadian National (-18.4%), Alphabet (-41.4%) to reallocate to Visa (+47%), maintaining highest-conviction positions.
Track Record and Returns: 18% Annualized Since Launch (January 2004)
Track Record:
2004–2007: ~40% annualized
2008: -43% (financial crisis)
2009: +5% (missed rally)
2022: -18% (~$8B loss)
2023: +$12.9B gains
2025: +$18.9B gains, 27% return
Since Inception: $68.4B net gains, 18% annualized
S&P 500 (same period): ~9% annualized
Outperformance: TCI’s 18% annualized return vs. the S&P 500’s ~9% annualized return over 22 years represents a massive difference in wealth creation. To illustrate: $1 invested in TCI at launch (January 2004) would have grown to approximately $38, while the same $1 in the S&P 500 would have grown to approximately $6.70.
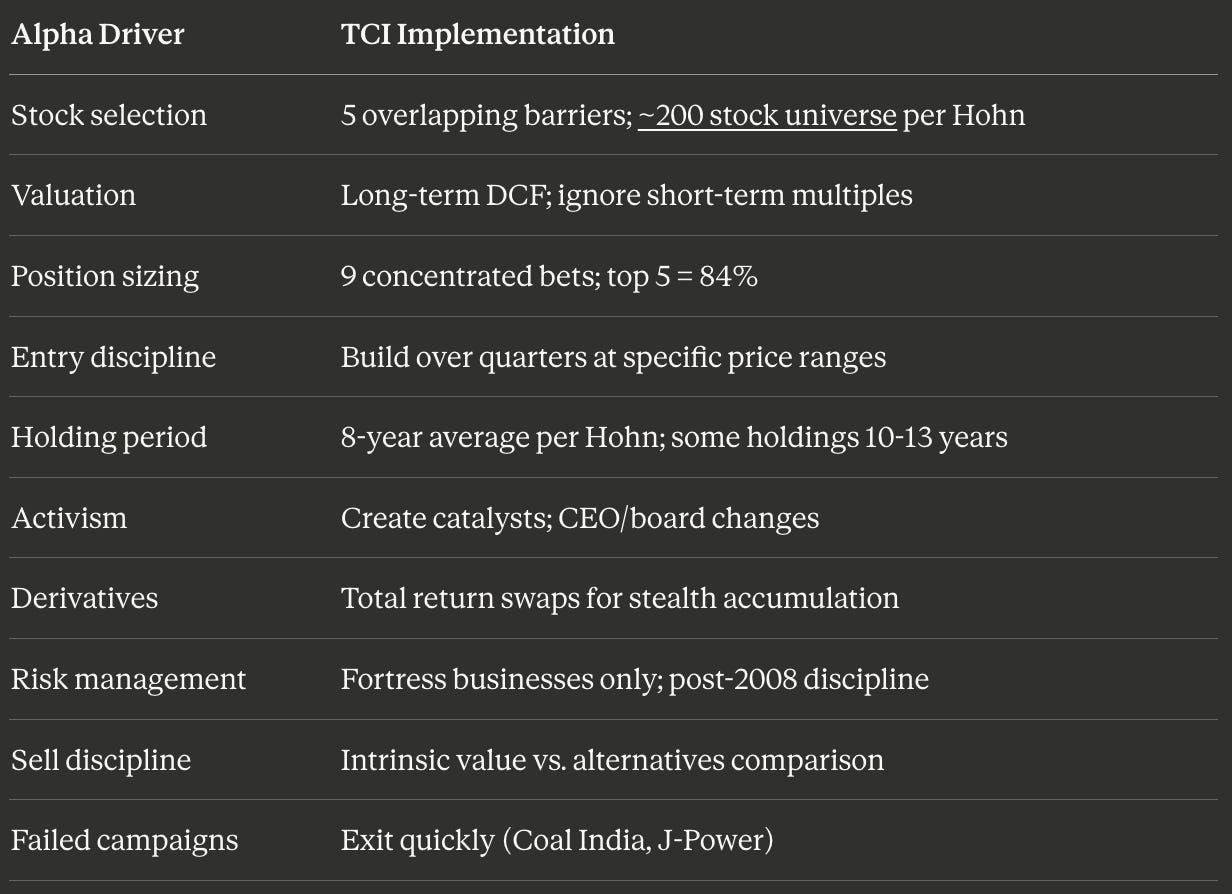
The Alpha Formula
Team Structure
Christopher Hohn: Sole portfolio manager with final decision authority
Total AUM: ~$77 billion as of late 2025
Entities: TCI Fund Management Limited (FCA regulated), TCI Advisory Services LLP, TCI Fund Services LLP, TCI Fund Management (US) Inc., TCI Fund Management (Ireland) Limited
TCI operates with a lean structure focused on deep research and long-term conviction rather than large teams.
Key Lessons for Investors and Allocators: What Makes TCI Different
Accumulation timing matters: Based on stock price history during TCI’s documented accumulation periods, building positions during volatility (GE in 2023 at ~$66–144 range vs. $308 by late 2025) generates outsize returns. 13F filings show when positions were built; historical prices show the opportunity cost of waiting.
Activism creates catalysts: ABN AMRO ($1B on 1% stake), Deutsche Börse (CEO ousted), Canadian National (CEO replaced).
Failures inform strategy: J-Power taught “avoid Japan,” Coal India taught “avoid government-controlled pricing,” Safran taught “bet size matters more than winning votes.”
Derivatives enable stealth: CSX total return swaps case shows sophisticated accumulation tactics despite legal challenges.
Conviction concentration: 9 positions, 84% in top 5, 8-year average hold periods per Hohn’s statements.
18% annualized vs. 9% compounds dramatically over 22 years: $1 becomes $38 in TCI vs. $6.70 in the S&P 500, demonstrating the power of extreme concentration in moated businesses.
The Bottom Line
TCI Fund Management’s 2025 record demonstrates that concentrated activist investing in moated businesses can generate extraordinary returns when executed with discipline. The fund’s $18.9 billion single-year gain and $68.4 billion cumulative performance prove that extreme concentration (9 stocks, 8-year holding periods) combined with sophisticated activism tactics can meaningfully outperform diversified strategies.
The key differentiators: forensic research to find pricing power moats, willingness to hold through volatility, strategic use of derivatives for stealth accumulation, and learning from failures (Japan, Coal India) to refine targeting criteria.
For investors and allocators studying concentrated equity strategies, TCI’s approach offers a blueprint — though one requiring substantial capital, legal resources, and conviction that few can replicate.
Sources:
All data from Q3 2025 13F filings, court documents, and verified interviews. Performance data from LCH Investments hedge fund rankings. Portfolio holdings from SEC EDGAR filings. Interview quotes from Nicolai Tangen podcast transcript. Court case details from Cleary Gottlieb and WilmerHale legal analysis.
Methodology Note: Entry prices and average cost basis estimates are reconstructed from historical stock prices during periods when 13F filings show position changes. 13F regulations do not require funds to disclose actual trade execution prices. Additionally, 13F filings only cover US-listed securities; TCI’s complete portfolio includes European and other non-US holdings (such as Safran, Aena) that do not appear in US regulatory filings. All price estimates are clearly labeled as such; returns calculations use documented position sizes and publicly available price data. Average holding period of 8 years is from Hohn’s May 2025 interview with Nicolai Tangen.
Data as of January 2026. Returns reported net of fees.
For more quantitative finance research and hedge fund analysis, visit The Mathematical Trader on YouTube.
Cover photograph: Foreign, Commonwealth & Development Office, CC BY 2.0, via Wikimedia Commons.
Cover photograph: Foreign, Commonwealth & Development Office, CC BY 2.0, via Wikimedia Commons.