


This is a detailed research piece. If you find value in institutional-quality hedge fund analysis, support this work on Patreon.
Market Position
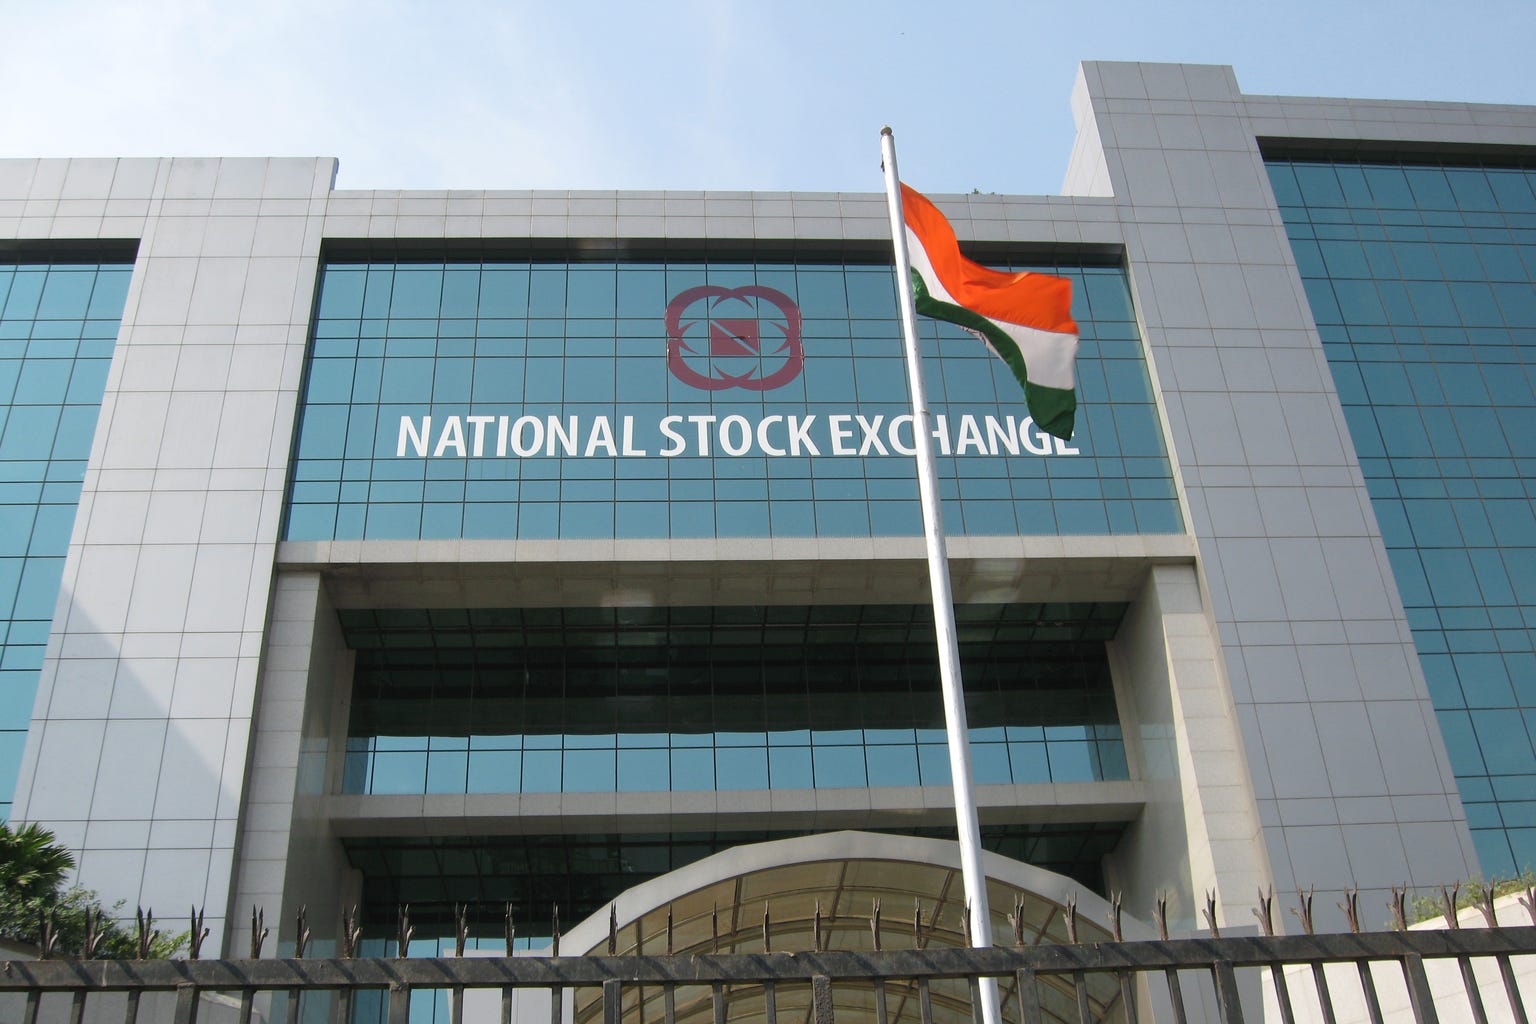
Between 2010–2015, industry sources indicate three firms — Quadeye Securities, AlphaGrep, and Shastra (Tower Research) — captured approximately 80% of India’s HFT volume and profits across NSE, BSE, and MCX. Market participants estimate the aggregate daily HFT profits during this period at ₹50 lakh, with the triumvirate taking ₹40 lakh.
Market economics (2010–2015 estimates):
HFT comprised 10–30% of F&O volume
Gross profit: ≈2 basis points per trade
Net post-STT and transaction costs: ≈0.5 basis points
Total annual Indian HFT market: ~₹100 crore
Note: These figures represent industry estimates based on market-participant data rather than audited regulatory disclosures. Source: Deepak Sanchety (former SEBI Chief of Market Surveillance), Medium analysis.
Infrastructure Stack
NSE launched co-location services on August 31, 2009 (NSE/MEM/12985), creating structural advantages:
Physical co-location: Sub-millisecond latency to matching engine
Tick-by-tick (TBT) data feeds: Sequential dissemination giving first-connected members faster data access
Cross-exchange connectivity: Synchronized NSE/BSE/MCX access for arbitrage
SEBI’s 2016 Technical Advisory Committee found that “NSE TBT architecture was prone to market abuse thereby compromising market fairness and integrity, in that it provided quicker order dissemination to those who managed to login early.” Industry reports indicate co-location adoption accelerated following fee reductions around late 2012.
Strategy Mechanics
Cross-Exchange Arbitrage (Futures)
Price discrepancies lasting milliseconds enabled systematic extraction. Using Nifty futures as the primary instrument where STT burden is lower (0.01% vs. 0.025% for cash):
Example trade:
Nifty Futures: ₹18,000.00 (NSE) vs ₹18,000.50 (BSE)
Position: Lot size 50 × 20 lots = 1,000 contracts
Notional: ₹1.8 crore
P&L breakdown:
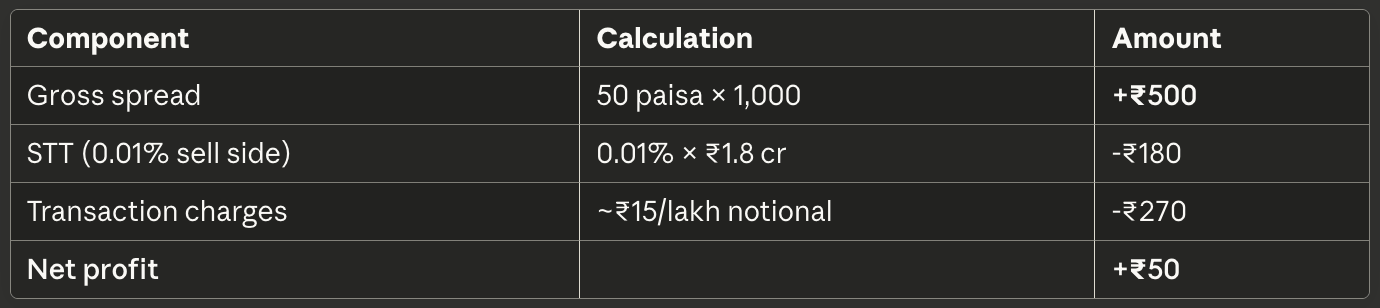
Per-unit economics: ₹50 net on ₹1.8 cr notional = 0.28 basis points
Futures-cash arbitrage exploited similar mispricings between spot and derivatives. The key was execution speed: these opportunities lasted 5–50 milliseconds, requiring co-located infrastructure to capture systematically.
Market Making
Without official market makers, HFT firms provided liquidity:
Bid ₹1,500.00 / Ask ₹1,500.10
Capture 10 paisa spread on fills
Delta hedge inventory via derivatives
Sub-millisecond order cancellation to avoid adverse selection
P&L Model
Representative daily economics (industry estimates):
Average position size: ₹10 lakh
Estimated net per position: ₹50 (≈0.5 bps)
Execution frequency: High-frequency across liquid securities
Infrastructure costs: Consumed significant portion of gross profits
Scale was essential for viability given thin per-trade margins. A firm executing 800 trades/day at ₹50 net each generated ≈₹40,000 daily profit, or ₹1 crore monthly.
Algorithmic Adaptation
NSE’s 2014 TBT→MTBT (Multicast Tick-by-Tick) protocol switch reversed tick dissemination order:
TBT: Trade event disseminated before order entry
MTBT: Order entry disseminated before trade event
Why this mattered: Algorithms using trade events as decision triggers faced immediate delays in the new architecture, while those using order entry signals gained speed advantages. This required complete algorithmic recalibration — sometimes multiple times daily — as market microstructure evolved. The switch effectively neutralized certain latency arbitrage strategies that depended on trade-event priority.
Latency as Alpha
Core relationship:
Alpha = f(Latency Advantage × Trade Frequency × Inefficiency Duration)Where:
Latency: Single-digit microseconds (tick-to-trade)
Frequency: Thousands of daily executions
Duration: Milliseconds per opportunity
As firms achieved sub-microsecond latency by mid-2010s, pure speed advantages commoditized.
Regulatory Intervention & Margin Compression
Timeline of regulatory actions:
April 30, 2019: SEBI issued comprehensive orders against NSE, directing disgorgement of ₹625 crore for regulatory violations in the co-location facility
February 2021: SEBI penalized OPG Securities ₹5.2 crore and ordered disgorgement of ₹15.57 crore for exploiting co-location advantages
September 2024: SEBI dismissed charges against NSE executives citing insufficient evidence of collusion; OPG disgorgement amount revised to ₹85 crore
Quadeye FY 2024 Financials
Per MCA filings (CIN: U67110WB2007PTC116377):

Critical context: These figures represent “Revenue from Operations” (likely brokerage/advisory fees) and may not capture proprietary trading P&L, which is often classified under “Other Income” or realized through associated group entities. Top-tier HFT firms typically generate revenues in hundreds of crores; the ₹4.06 cr figure suggests either: (1) significant book restructuring across entities, or (2) genuine business contraction following margin compression.
Compression Drivers
Competition: HFT participation grew from <1% (2011) to 14.8% (2019) of NSE volume
Regulation: Post-2015 reforms increased compliance costs and reduced exploitable advantages
Market maturity: Improved price discovery mechanisms reduced persistent mispricings
Evolution Trajectory
Quadeye was incorporated June 7, 2007, and founded by Sudeep Gupta (IIT Kanpur B.Tech ’92, Cornell MS ‘95). The firm established early dominance through infrastructure advantages and algorithmic sophistication.
Post-2015, despite the end of alleged preferential access, top firms maintained profitability through algorithmic innovation rather than pure infrastructure advantage. However, the 67% EBITDA decline demonstrates alpha migration toward:
Predictive order flow modeling
Machine learning pattern recognition
Statistical relationships requiring longer holding periods
Cross-asset/geography strategies
Strategic Takeaway
The ≈0.5 basis point game proved extraordinarily profitable when infrastructure created durable edges. As co-location commoditized and competition intensified, profitability compressed 67% at the EBITDA level within a decade.
Lesson for quants: Temporary structural advantages in electronic markets converge to zero as technology democratizes and competitors enter. Sustainable alpha requires continuous innovation in predictive modeling, not just execution infrastructure. Speed creates optionality; intelligence determines profitability.
The Indian HFT evolution mirrors global patterns: early infrastructure advantages yielded outsized returns, regulatory scrutiny followed exploitation of information asymmetries, and eventual margin compression forced strategic adaptation toward signal generation over execution speed.
References
Regulatory & Primary Sources
[1] SEBI. (2019). “Order in the matter of NSE Colocation” (April 30, 2019).
https://www.sebi.gov.in/enforcement/orders/apr-2019/order-in-the-matter-of-nse-colocation_42880.html
[2] SEBI. (2021). “Adjudication Order in respect of four entities in the matter of NSE Co-location” (February 12, 2021).
https://www.sebi.gov.in/enforcement/orders/feb-2021/adjudication-order-in-respect-of-four-entities-in-the-matter-of-nse-co-location_49104.html
[3] SEBI. (2025). “Adjudication Order against OPG Securities Pvt Ltd” (April 2, 2025).
https://www.sebi.gov.in/enforcement/orders/apr-2025/adjudication-order-against-opg-securities-pvt-ltd-and-others-in-the-matter-of-nse-co-location_93240.html
[4] Casemine. (2019). “SEBI Order — NSE Colocation TAC Findings.”
https://www.casemine.com/judgement/in/5d304ec24a9326392ac52f05
Market Structure Analysis
[5] Wikipedia. (2025). “NSE co-location scam.”
https://en.wikipedia.org/wiki/NSE_co-location_scam
[6] MoneyControl. (2018). “Explainer: NSE colocation case.”
https://www.moneycontrol.com/news/business/companies/explainer-nse-colocation-case-what-happened-faq-3985511.html
[7] Business Standard. (2024). “What is NSE co-location case.”
https://www.business-standard.com/about/what-is-nse-co-location-case
[8] Business Standard. (2024). “Sebi disposes of proceedings against NSE, ex-officials in co-location case” (September 13, 2024).
https://www.business-standard.com/markets/news/sebi-disposes-of-proceedings-against-nse-ex-officials-in-co-location-case-124091301348_1.html
Industry Estimates & Analysis
[9] Sanchety, D. (2019). “Are Things Between Algo Firms Equal? — Part 1.” Medium.
https://medium.com/@sanchety.deepak/are-things-between-algo-firms-equal-part-1-5fb1a5a0904c
[10] Sanchety, D. (2019). “What is the size of Indian HFT Market?” Medium.
https://medium.com/@sanchety.deepak/the-size-of-hft-in-indian-market-303223006c5d
[11] LinkedIn. (2022). “Evolution of High Frequency Trading in India and Impact of Regulations.”
https://www.linkedin.com/pulse/evolution-high-frequency-trading-india-impact-regulations-hft-
Corporate Background
[12] IndiaFilings. (2024). “Quadeye Securities Private Limited — Company Details.”
https://www.indiafilings.com/search/quadeye-securities-private-limited-cin-U67110WB2007PTC116377
[13] Tofler. (2024). “Quadeye Securities Financials | Company Details.”
https://www.tofler.in/quadeye-securities-private-limited/company/U67110WB2007PTC116377
[14] Mathisys Advisors. “Who We Are — Sudeep Gupta, founder of Quadeye Securities (2009).”
https://www.mathisys-india.com/who-we-are/index.html
[15] Mathisys Quantcap. (2024). “Who We Are.”
https://www.mathisys-india.com/who-we-are/index.html
Contemporary Market Analysis
[16] IIFL. “What is High-Frequency Trading?”
https://www.indiainfoline.com/knowledge-center/trading-account/what-is-high-frequency-trading
[17] QuantInsti. (2025). “Top Prop Trading and HFT Firms.”
https://www.quantinsti.com/articles/hft-prop-trading-firms/
[18] Lares Algotech. (2025). “Highest Growth Quant Trading Firms in India.”
https://laresalgotech.com/highest-growth-quant-trading-firms-in-india-gaining-attention-in-2024/
Methodology & Verification
Data Classification:
Audited Corporate Data: Revenue (₹4.06 cr), YoY decline (-47.46%), EBITDA decline (-67.91%) verified through MCA filings accessed via Tofler corporate database (March 31, 2024). Note: Figures represent “Revenue from Operations” and may not capture full proprietary trading P&L.
Regulatory Documentation: Co-location timeline, regulatory penalties, and market structure violations verified through direct SEBI orders (April 2019, February 2021, April 2025) and SEBI Technical Advisory Committee reports.
Industry Estimates: Market share figures (80% capture by three firms), daily profit estimates (₹50 lakh aggregate), and per-trade profitability (≈0.5 bps net) represent well-informed estimates from market participants including former SEBI officials. Author Deepak Sanchety served as Chief of Market Surveillance at SEBI and provides contextual market structure analysis based on operational knowledge during the reference period.
Source Hierarchy: This analysis prioritizes (1) MCA corporate filings and SEBI regulatory orders for factual claims, (2) academic research and exchange documentation for technical mechanisms, (3) industry participant accounts for market structure estimates where regulatory data is unavailable.
Verification Standard: All numerical claims cross-verified against primary sources where available. Industry estimates clearly labeled and sourced from knowledgeable participants with direct operational experience. No claim presented as fact unless supported by regulatory filing, corporate disclosure, or multiple corroborating sources.
About This Analysis: Part of an ongoing series forensically examining institutional trading strategies through market data, regulatory filings, and industry research. Maintains strict standards for claim verification and transparently distinguishes between audited figures and informed estimates.
📊 Support this research: https://www.patreon.com/c/NavnoorBawa
Cover photograph: Jnpet, CC BY-SA 3.0, via Wikimedia Commons.