



Optiver reported net trading income €3.494B (+26% YoY) and net profit €1.369B for 2024, ending the year with total equity €4.905B and ~2,100 employees. The revenue derives from applying Avellaneda-Stoikov inventory-risk optimization — asymmetric quoting around reservation price rather than mid-price — to systematically convert bid-ask spread capture into risk-adjusted returns across 50+ exchanges.
Market Position
20% market share: European ETP off-exchange (Bloomberg/Tradeweb RFQ venues; reported 2022)
#1 by volume (2022): Hong Kong equity index & single-stock options, JPX Nikkei options by volume and notional
Scale: 50+ exchanges, ~2,100 employees, €4.905B equity
Three P&L Channels
Channel 1: Spread Capture
Optimal spread width from Avellaneda-Stoikov (2008):

Where δ^a and δ^b are the ask and bid half-spreads, and κ is the arrival-sensitivity parameter in the exponential arrival model λ(δ) = Ae^(-κδ).
Parameters:
γ = risk aversion coefficient
σ² = price variance
(T-t) = time to session close
κ = order arrival intensity decay rate
Trade-off: Higher γ widens spreads (lowers inventory risk but reduces fill rate). Lower γ tightens spreads (increases fills but raises directional exposure). Spreads automatically widen approaching close and during volatility spikes.
Channel 2: Inventory Premium
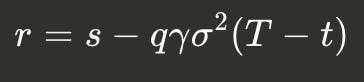
Reservation price calculation:
Mechanics:
q > 0 (long) → r < s → ask quotes migrate toward mid-price (facilitates selling)
q < 0 (short) → r > s → bid quotes migrate toward mid-price (facilitates buying)
Symmetric quotes around r (not s) force mean reversion through price skewing. Inventory decay is mathematical, not discretionary.
Channel 3: Maker Rebates
Passive fill rebates scale linearly with volume. At Optiver’s scale across 50+ venues, rebates contribute meaningful revenue (firm does not disclose aggregate rebate income).
Risk Management
VPIN (Volume-Synchronized Probability of Informed Trading): Real-time toxicity metric from Easley, López de Prado & O’Hara (2012). Measures order flow imbalance in volume-time. Elevated VPIN can trigger position liquidation and quote withdrawal.
Edge: HFT market makers detect adverse selection faster than traditional dealers. Survival requires identifying toxic flow before P&L impact.
Order Arrival Dynamics
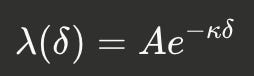
Exponential decay models fill probability vs. quote depth.
Implications:
Dense books (high κ) → tight optimal spreads
Illiquid markets (low κ) → wide optimal spreads
Arrival intensity calibrated per instrument dynamically
Session-End Behavior
In the Avellaneda-Stoikov model, as (T-t) → 0, the time-dependent spread component γσ²(T-t) contracts toward zero, encouraging more aggressive quoting (higher fill probability) to liquidate inventory before session close. Empirically, end-of-day markets often show wider displayed spreads and higher price impact as some liquidity providers withdraw positions — Optiver’s capital structure enables continued liquidity provision during these periods.
Inventory Control Implementation
From Stanford MSANDE implementation (Fushimi et al., 2018):
Dynamic order sizing:
Long position → reduce bid size exponentially, maintain full ask size
Short position → reduce ask size exponentially, maintain full bid size
Function: for excess direction

Emergency unwinding:
Unwanted fill → immediate market order in opposite direction
Cost: taker fee vs. full spread (fee structure varies by venue; ~2bp is representative but not universal)
Speed advantage converts inventory risk into measurable execution cost
2024 Catalysts
Optiver’s 2024 results cited “political elections in more than 100 countries and continued geopolitical tensions” as drivers of elevated volatility and volume. Independent election trackers counted approximately 64–74 national elections in 2024, widely described as an election “super-year.” The resulting dual expansion created optimal market-making conditions:
High volatility → wider natural spreads → higher per-trade revenue
High volume → increased fill frequency → more trades
Both revenue channels expanded simultaneously.
Mathematical Optimization Problem
Avellaneda-Stoikov solves:
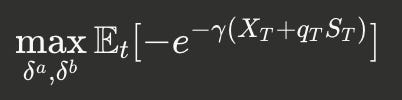
Subject to:
Mid-price diffusion: dS_t = σdW_t
Poisson arrivals: λ^(a,b)(δ^(a,b))
Inventory process: dq_t = dN^b_t — dN^a_t
Solution delivers:
Automatic inventory mean reversion (quote skewing)
Dynamic spread calibration (volatility-responsive)
Closed-form optimal quotes (computationally tractable)
Time-dependent liquidation (session-end forcing)
Core Framework
The reservation price r = s — qγσ²(T-t) is the indifference price for a market maker holding inventory q. Quoting symmetrically around r instead of s mathematically guarantees inventory mean reversion while maintaining positive expected spread. This transforms market making from reactive position management to systematic optimization.
Optiver’s €3.5B revenue is the aggregate result of this framework applied at scale: thousands of small, mathematically-optimized trades per second, converted into risk-adjusted returns through disciplined inventory management and toxicity detection.
References
Company Data:
Optiver. (2025). Optiver reports strong financial results for 2024. https://optiver.com/optiver-reports-strong-financial-results-for-2024/
Optiver. Institutional Sales — Trade with us in Asia Pacific. https://optiver.com/institutional-trading/trade-with-us-apac/ (market rankings as of 2022)
Risk.net. (2022). Optiver overtakes SocGen and SIG in European ETF trading. https://www.risk.net/investing/7950906/optiver-overtakes-socgen-and-sig-in-european-etf-trading
Core Framework:
Avellaneda, M., & Stoikov, S. (2008). High-frequency trading in a limit order book. Quantitative Finance, 8(3), 217–224. https://people.orie.cornell.edu/sfs33/LimitOrderBook.pdf
Extensions:
Guéant, O., Lehalle, C.-A., & Fernandez-Tapia, J. (2013). Dealing with the inventory risk: A solution to the market making problem. Mathematics and Financial Economics, 7(4), 477–507
Toxicity Detection:
Easley, D., López de Prado, M., & O’Hara, M. (2012). Flow toxicity and liquidity in a high-frequency world. Review of Financial Studies, 25(5), 1457–1493. https://papers.ssrn.com/sol3/papers.cfm?abstract_id=1695596
Implementation:
Fushimi, T., Rojas, C. G., & Herman, M. (2018). Optimal high-frequency market making. Stanford MSANDE 448 Final Report. https://stanford.edu/class/msande448/2018/Final/Reports/gr5.pdf
Intraday Dynamics:
Adrian, T., Capponi, A., Fleming, M., Vogt, E., & Zhang, H. (2020). Intraday market making with overnight inventory costs. Journal of Financial Markets, 50, Article 100524
Election Data Context:
Wikipedia. (2024). List of elections in 2024. https://en.wikipedia.org/wiki/List_of_elections_in_2024 (independent count: ~64–74 national elections)
Cover photograph: Choinowski, CC BY-SA 4.0, via Wikimedia Commons.