


Data note: Market figures in this article are reproduced from a proprietary vendor slide deck (Bloomberg / BMLL / FIA, Jan–Aug 2025). Arithmetic has been independently verified. Public exchange reports (FIA, Cboe, Eurex, B3, NSE) support the directional context but do not reproduce the vendor daily averages line-for-line.
TL;DR
Counting contracts is a convenient headline — and a highly misleading one. Normalize to notional per contract, premium per contract, and vega-notional before comparing markets. Using the vendor slide figures (Jan–Aug 2025), SPX contracts represent ≈€555k of underlying exposure each while NIFTY contracts represent ≈€19.4k each — about 28× the per-contract notional. That per-contract economics determines capital, hedging, and systemic risk — not raw contract counts.
Why Headline Contract Counts Mislead
A contract is only a unit — its economic size depends on the contract multiplier and underlying price. Headlines like “Market A traded 100M contracts vs Market B 3M” hide three critical facts:
Notional per contract — how much underlying exposure each contract implies.
Premium per contract — cash that changes hands and funds hedging/MTM.
Vega-notional — currency exposure to volatility moves (essential for options risk).
Dealers, market makers, and risk managers provision capital and set margin based on currency-sized exposures and vega, not on contract counts.
The Vendor Headline Figures
Vendor slide aggregates (Jan–Aug 2025):
Contracts traded (daily avg):
NIFTY: 108.3M
IBOV: 5.1M
SPX: 3.6M
ESX: 0.9M
Daily notional (EUR):
NIFTY: €2.1T
SPX: €2.0T
ESX: €0.05T
IBOV: €0.001T
Daily premium (EUR):
NIFTY: €4.5B
SPX: €11.7B
ESX: €0.9B
IBOV: €0.01B
The Math You Must Compute — Every Time
Two simple, high-value scalars:
Notional per contract =
daily_notional / daily_contractsPremium per contract =
daily_premium / daily_contracts
Working these through the vendor aggregates:
NIFTY:
Notional ≈ €19,387 / contract
Premium ≈ €41.6 / contract
SPX:
Notional ≈ €555,556 / contract
Premium ≈ €3,250 / contract
ESX:
Notional ≈ €55,556 / contract
Premium ≈ €1,000 / contract
IBOV:
Notional ≈ €196 / contract
Premium ≈ €1.96 / contract
Key takeaway: SPX contracts carry ~28× the notional of a NIFTY contract under these aggregates; SPX premium per contract is orders of magnitude larger. That’s what drives hedging cadence, margin, and dealer balance-sheet usage.
Interpretations That Matter for Trading and Research
Hedging frequency & gamma carry: Higher premium/notional per contract → larger per-trade P&L and heavier hedging requirements. Model hedging in notional and vega terms.
Execution & slippage modeling: Convert spreads and fees into bps of notional so transaction costs are comparable across products.
Capacity & scalability: A strategy that looks scalable by contract count can be capital-constrained once mapped to notional, margin, and funding.
Stress testing & systemic risk: Shock vega-notional (currency per 1% vol) — that’s the metric that moves dealer P&L and margin calls.
What Every Market-Size Paragraph Should Contain
Raw contracts (daily/monthly) — label the source
Notional traded — total and per contract
Premium traded — total and per contract
Vega-notional — total and per contract (if vega available)
Turnover / open interest ratio and median trade size
Effective spread (bps of notional) and margin % of notional
Contract multiplier and settlement currency (document conversion)
Finish with one declarative sentence: e.g., “Although NIFTY trades ~30× more contracts than SPX, the SPX’s per-contract notional makes it the dominant pool of economic exposure for dealers.”
Context & Corroboration
Public exchange reports confirm the broad picture: global ETD volumes remain huge and are concentrated by region and product (see FIA monthly ETD summaries), and exchange releases (Cboe, Eurex, B3, NSE) show very large index options activity across the major venues. Use exchange releases for contextual citations, and vendor aggregates only when you can provide provenance (screenshot or vendor citation).
Appendix — Reproducible Calculations & Code
Formulas:
Notional_per_contract = daily_notional / daily_contracts
Premium_per_contract = daily_premium / daily_contracts
Vega_notional ≈ vega_per_option × contract_multiplier × underlying_price
Python example:
contracts = 108300000  # NIFTY daily contracts
notional = 2100000000000  # NIFTY daily notional in EUR
premium = 4500000000  # NIFTY daily premium in EUR

notional_per_contract = notional / contracts
premium_per_contract = premium / contracts

print(f”Notional per contract: €{notional_per_contract:,.2f}”)
print(f”Premium per contract: €{premium_per_contract:,.2f}”)
CSV schema for reproducibility:
contract_id, multiplier, underlying_price, premium_index_points,
volume, open_interest, implied_vol, vega_index_points, timestamp
Figure Captions
Average Daily Contracts Traded — “Raw contract counts; normalize to notional per contract for economic comparison.”
Average Daily Notional Traded — “Total underlying exposure; per-contract notional shows dealer exposure.”
Average Daily Premium Traded — “Premium funds hedging and MTM flows; premium per contract shows cash intensity.”
Final Thoughts
The next time you read “Market X traded 100 million contracts,” ask yourself: what’s the notional per contract? What’s the premium per contract? What’s the vega exposure? Those numbers — not the raw contract count — determine whether a market is economically significant for dealers, whether it’s capital-intensive to trade, and whether it poses systemic risk.
Raw contract counts make for good headlines. Normalized metrics make for good decisions.
If you found this useful, consider sharing it with your quant team. For questions about the methodology or to discuss custom market analysis, connect with me on LinkedIn.
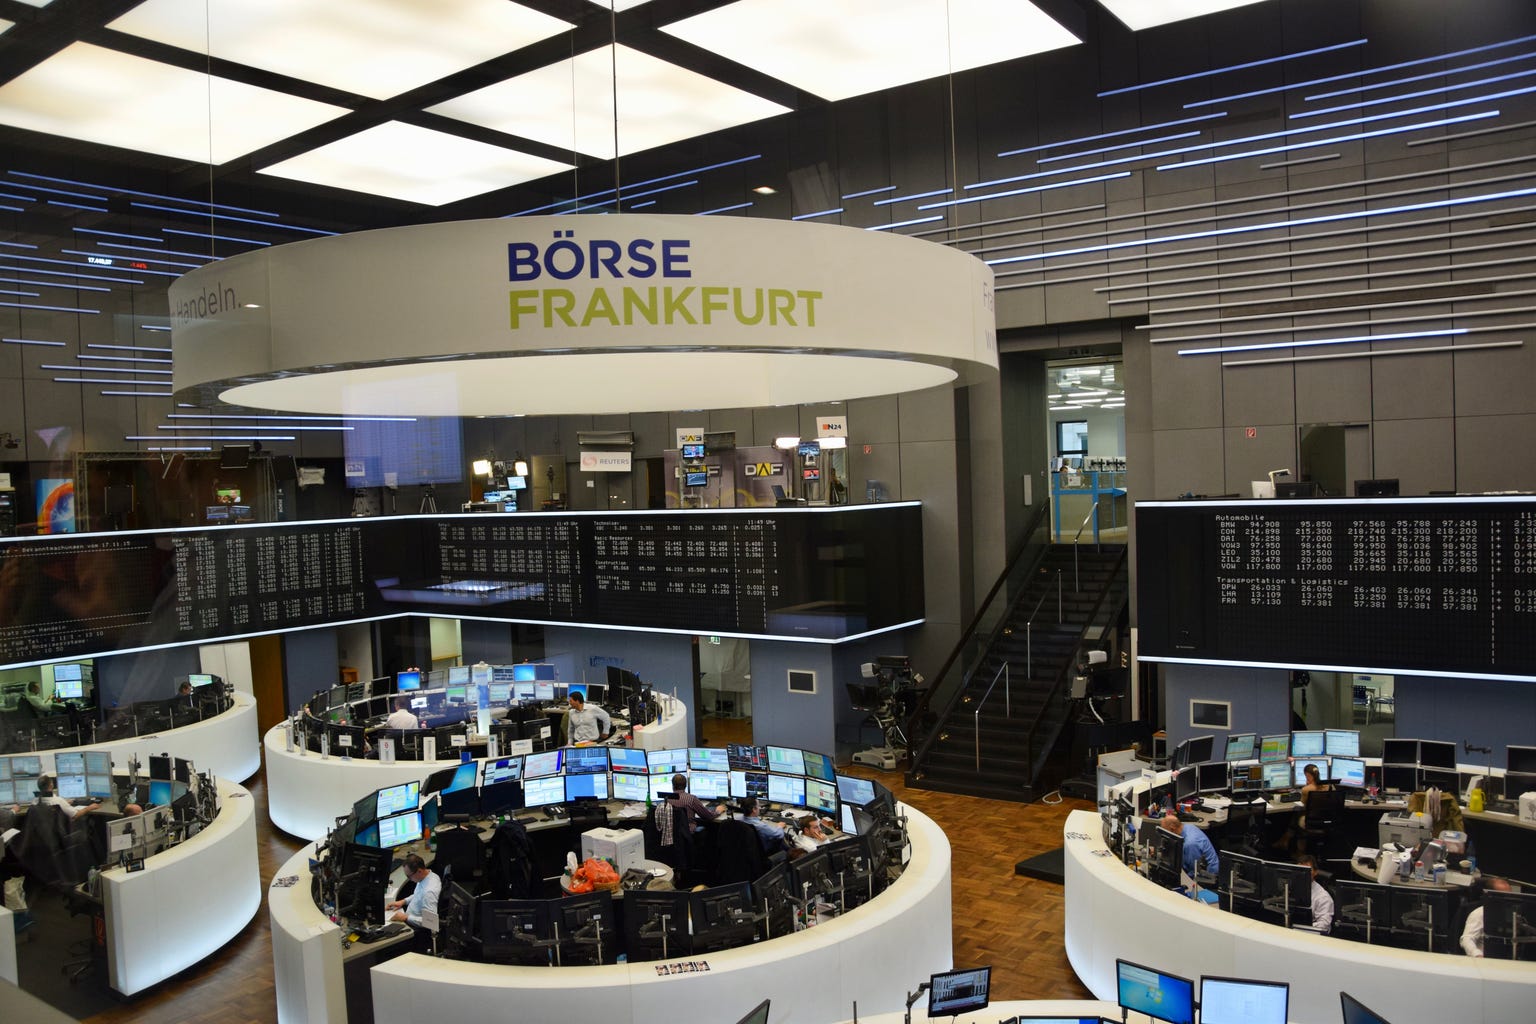
Cover photograph: Ank Kumar, CC BY-SA 4.0, via Wikimedia Commons.