


Equity index option alpha, the compensation investors earned for selling volatility beyond what their market exposure alone would explain, has converged to statistically indistinguishable from zero over the past fifteen years, as the frictions that once kept non-dealer investors from selling options eroded and the burden of warehousing that risk spread beyond a small set of capital-constrained dealers. Crude oil’s variance risk premium has not been shown to follow the same path, but that claim needs to be stated precisely: the literature on it runs from 2013 through 2025, yet no published study has re-tested whether the premium’s defining number, a roughly 40% Sharpe ratio for a diversified short-variance portfolio, still holds outside the 1989–2011 sample it comes from. Absence of a decay study is a gap in the evidence, not proof the edge survived intact, and the rest of this piece tries not to blur that distinction. What the evidence does support is narrower and still useful: capturing this premium requires a full options surface and balance-sheet access that remain genuinely scarce, a structural barrier rather than an informational one, and that barrier is also the reason no one has published a capacity estimate for the trade. This article sets out that mechanism, what the literature does and does not say about decay, and what can and cannot be inferred about capacity from the size of the market the trade would have to clear through.
🎬 Prefer to watch rather than read? A NotebookLM-generated video overview of this article is available here: Watch the video overview → Full analysis, citations, and data remain in the article below.
The consensus, stated precisely
Using options on 21 commodities from 1989 to 2011, Prokopczuk and Wese Simen construct synthetic variance swaps and document significantly negative variance risk premia in 17 of 21 markets at 60 days, meaning implied variance systematically overpays for the realized variance that follows. A diversified short-variance portfolio earns an annualized Sharpe ratio near 40%, roughly four times a passive long-futures portfolio over the same sample; energy-sector Sharpe ratios at the two-month horizon range from 34% to 47%. The result survives interpolation-method changes, alternative truncation points, jump-risk adjustment, transaction costs up to 5% of the swap rate, and a 20% performance fee. This is a well-established empirical fact in the derivatives literature. The questions an institutional reader actually needs answered are why it has not been arbitraged away, and how much capital could chase it before it was.
What killed the equity index version, and why it hasn’t happened here
The clearest available decay study is not about commodities. Dew-Becker and Giglio, in a 2025 Chicago Fed working paper, document that traded equity index option alphas have converged to statistically indistinguishable from zero over the past 15 years; their general statistical tests place the break around 2010, and a more targeted test using net dealer gamma exposure dates the specific shift to 2012m5. Their explanation is not simply that dealer balance sheets grew; it is that the frictions preventing non-dealer investors from supplying (selling) options declined, so the asymmetric risk-bearing burden that used to fall on dealers spread across a wider pool of capital, including the growing hedge fund sector and structured-product issuance to retail. The paper documents this directly: net dealer gamma exposure in S&P 500 options went from consistently negative before 2012 to roughly zero or positive after, with timing the paper describes as highly similar to the timing of the shift in the option premium. This is the textbook decay path for a known anomaly: a structural inefficiency exists, the frictions that prevented competition from closing it erode, and the alpha goes to zero.
No equivalent decay study exists for crude oil, and that needs separating from a different, true fact: the literature has kept extending, just not on the question of whether the original 40% Sharpe ratio replicates in fresher data. Li and Li (2025) decompose crude oil’s tail risk premium from its variance risk premium and find the tail component, though smaller in magnitude, carries more significant predictive power for futures returns. Ammann, Moerke, Prokopczuk and Würsig (2023) go further: across commodity markets generally, both left- and right-tail risk implied by options are economically large, a contrast with the equity-options literature, where the Dew-Becker and Giglio data above shows risk aversion rising sharply on the downside specifically, the familiar left-skew, crash-premium pattern. The Ammann et al. paper adds a second, separate finding directly relevant here: left and right tail risk are largely independent of the variance risk premium itself, the academic confirmation of the mechanical point above that tail/skew risk and the level of implied variance are different objects, priced separately, and a single 30-day point estimate cannot carry information about one while measuring the other. None of this is a test of whether the 1989–2011 Sharpe ratio survives on, say, 2015–2025 data. That specific test does not appear to have been published. Its absence should be read as an open question the data-access barrier may itself help explain, since replicating it requires the same options-chain data that limits practitioners, not as evidence either way about whether the edge has decayed.
The mechanistic reason the two markets diverged is access, not attention. Closing the equity VRP required frictions on non-dealer option supply to erode, a process that unfolded steadily as structured-product access for retail and the hedge fund sector both grew after the financial crisis. Closing the commodity VRP requires something narrower: a full strike-and-maturity options surface, sourced from a paid vendor, to replicate the variance swap and read the skew that prices the tail. CBOE’s OVX collapses that entire surface into one 30-day number computed from near-month USO options. CME’s CVOL index computes the actual skew and convexity from the full curve, proving the surface problem is solvable, but distributes the result through several licensed channels, live streaming via the CME Market Data Platform and CME Direct, historical data via CME DataMine, and programmatic access via a paid REST API, every one of them gated behind a paid account entitlement. A capital constraint eases as more capital arrives. A data-access constraint does not ease just because more people want the data; it eases only when someone pays for it. That is a structurally different, and more durable, kind of barrier, and it is the direct explanation for why the commodity premium has not traced the equity premium’s path to zero.
What would actually constrain capacity, and what doesn’t
The absence of a published capacity estimate for crude oil variance harvesting is itself informative: capacity research gets written about trades that are crowded enough to need it. Value, momentum, and carry in commodities have exactly that literature. Kang, Rouwenhorst and Tang construct a crowding measure directly from CFTC positioning data and show it has a strong negative predictive impact on those factors’ expected returns, with historical factor returns accumulated primarily during periods of low crowding. No comparable study exists for commodity variance harvesting, because the data barrier above has kept the population of participants who can correctly measure and size the trade small enough that crowding has not yet become the binding constraint research needs to explain.
That does not mean the ceiling is infinite, and the outer bound can be reasoned from public market-size data even without a published capacity study. CME states that NYMEX WTI futures and options trade over 1 million contracts daily, against roughly 4 million contracts of open interest. CFTC’s own reporting shows two different numbers depending on which report is pulled, and the gap between them is itself instructive. The Disaggregated Petroleum Combined report, which nets futures and options together and is the more relevant measure for a variance-replication strategy, shows the WTI-Physical contract at 3,032,488 contracts of open interest as of the May 12, 2026 reading; as of this writing (June 20), that combined report has not updated past May 12 despite CFTC’s stated weekly cadence. The separate futures-only report for the same contract has continued updating normally, showing 2,025,180 contracts as of June 2, 2026. The two figures are not directly comparable, one nets in options exposure and one does not, but the combined report’s monthlong gap is a live, current example of the exact problem described later in this piece: the data series that actually matters for sizing options-based risk lags worse in practice than its official cadence promises. At a WTI price near $78 per barrel as of June 19, 2026 (CNBC), the combined figure alone represents approximately $237 billion in notional exposure. That headline figure is the outer bound, not the relevant one: it is dominated by liquid near-the-money strikes, while variance-swap replication needs depth specifically in the out-of-the-money wings, and the share of total open interest concentrated there is not published in any aggregate public series (magnitude not obtainable from public data).
A widely cited example of how short-volatility capacity constraints can fail is the XIV and SVXY collapse, but the mechanism behind it needs to be stated precisely before it can be borrowed for a different market. By early 2018, the two largest short-volatility exchange-traded products, XIV and SVXY, held a combined notional position of roughly $280 million in VIX futures vega, against a total VIX futures market notional of roughly $7 billion the prior year. Augustin, Cheng, and Van den Bergen, in the peer-reviewed account published in the Financial Analysts Journal, document how the ETPs’ daily rebalancing mandates forced them to buy VIX futures into the closing minutes precisely as volatility was spiking, mechanically increasing the size of the next required purchase in a self-reinforcing feedback loop. Independent tracking of the session by volatility analyst Vance Harwood found that a combined $4 billion of the two front-month VIX futures contracts changed hands at the close, as the VIX itself closed up roughly 116% on the day. XIV lost over 90% of its value within hours; Credit Suisse announced its termination the next day, with trading continuing until February 15 and final cash settlement on February 21, sixteen days after the crash.
The forced-selling mechanism here was specific to the product structure, not to being short volatility in general. XIV and SVXY were exchange-traded notes with a contractual, daily, price-insensitive rebalancing mandate: by prospectus, they had to trade toward a constant leverage target every day regardless of where the market was, which is what created the reflexive loop. A hedge fund running discretionary or systematic variance-swap replication has no such covenant. It can widen hedging bands, cut size, or stop trading into a dislocation in a way an ETN legally cannot. Importing the “fails discontinuously, not gradually” conclusion from Volmageddon without checking for that precondition would be reasoning by analogy dressed up as derivation, and it is worth naming the better-grounded mechanism instead.
That mechanism is margin and VaR-driven deleveraging, documented well outside the ETP world. Brunnermeier and Pedersen model what they call the margin spiral and the loss spiral: as volatility rises, a position’s value-at-risk rises with it, prime brokers raise margin requirements, and a fund is forced to cut the position to stay within risk limits, which itself pushes prices further and tightens margins again. This is a real constraint on actual funds, not a contractual artifact of an ETP structure, and it is the closest thing to a generalizable mechanism for how a short-oil-variance book could be forced into procyclical selling exactly when liquidity is thinnest. But naming the mechanism is not the same as showing it binds here: no published source documents a margin or VaR-driven unwind specific to an oil variance-replication strategy, at any size, and the capital and risk-limit terms that would actually trigger one are fund-specific, private, and not observable from outside.
That gap connects to a separate, plainer problem: no public track record of a fund actually running this trade exists. Every figure in this piece comes from an academic dataset or a dead VIX product, not from a disclosed P&L. That absence cuts both ways. It is consistent with the data-access barrier described above, if the trade were being run successfully at scale by identifiable participants, some trace of it would likely be visible by now, in marketing materials, a research note, or a recognizable positioning pattern, and none is. But it also means every claim in this section about capacity is reasoning from market size and an adjacent but structurally different blowup, not from observed behavior of the actual trade. The honest statement is that a real mechanism for capacity constraints exists in principle, margin- and VaR-driven, not contractually forced the way XIV’s was, and that the data needed to size it for crude oil variance harvesting specifically, OTM wing depth, fund-level risk limits, or a disclosed track record, is not publicly available. That is a narrower claim than a derived ceiling, and it is the one the evidence supports.
COT cannot substitute for the crowding signal it could in principle provide
The Kang, Rouwenhorst, and Tang result above establishes something specific: CFTC positioning data, used correctly, does carry real predictive power over forward commodity factor returns. That makes its limitations for this purpose a sharper problem than a generic data-quality complaint. The Commitment of Traders report is published every Friday for positions held the preceding Tuesday, a built-in three-day lag, and by law the CFTC does not disclose how individual traders are classified within each reporting category. In practice the lag is sometimes worse than the design: the combined futures-and-options report cited above was, as of this writing, still anchored to a May 12 reading more than five weeks stale, even as the futures-only report for the same contract kept updating weekly. A crowding measure that is structurally lagged, intermittently more so than advertised, and category-level rather than participant-level can flag a slow build in aggregate positioning. It cannot tell a risk manager, in real time, whether their own variance-replication flow is approaching the kind of liquidity fraction that broke the VIX futures market in 2018. The data exists in principle to monitor this capacity ceiling. The free version of it is built for weekly macro context, not real-time risk management, and even that weekly cadence is not always honored for the specific report type that matters most here.
The 2026 Hormuz episode, including the de-escalation
Brent opened January 2026 near $60.75, reached $116.29 on March 9 as fighting closed the Strait of Hormuz to tanker traffic, fell to $80.33 the following day, and recovered to roughly $105.38 by mid-May (Capital.com). That alone is the whipsaw a short-variance position is exposed to. But the episode kept moving after mid-May. Trump and Iranian President Pezeshkian signed a memorandum of understanding at the Palace of Versailles on June 17, halting hostilities for a 60-day negotiating window, and crude fell nearly 25% over the following week as the geopolitical premium came out of the market (Capital.com). Two days later, the first round of follow-up technical talks, scheduled for June 19 at Switzerland’s Bürgenstock resort and meant to begin converting the interim truce into a lasting settlement, were postponed indefinitely, with the Swiss Foreign Ministry citing unresolved logistics rather than a breakdown in the agreement itself. OVX, which peaked at 125.99 during the crisis, closed at 51.54 on June 18 (Yahoo Finance), reflecting the de-escalation but still well above its pre-crisis 52-week low of 23.59.
This second move is, if anything, a sharper illustration of the argument than the original spike. A trailing single-point OVX read taken any day in this sequence, the March peak, the March crash, the May recovery, or the post-MOU plunge, would have told a researcher the level of 30-day implied volatility and nothing about which of those regimes they were actually in or how durable it was. The Bürgenstock postponement makes that concrete within 48 hours of the MOU itself: a peace agreement and a stall in the talks meant to cement it landed within the same week, and a position sized off any single day’s OVX print in between would have had no way to distinguish a market pricing durable peace from one pricing a truce that could still unravel. The interim MOU is real and the price move it caused is real, but the postponed talks mean the underlying political risk has not resolved, only repriced, and a single 30-day number cannot tell a risk manager whether the next move is further decay toward pre-crisis levels or a snap back if the negotiating window stalls. CBOE’s own volatility research desk documented the same mechanism during a comparable, smaller 2025 Iran-linked spike: WTI one-month implied volatility jumped to 68% before easing to 51% within the same week, while the implied-realized spread, the premium a short-variance position is actually paid, compressed from 30 points to 14 (CBOE). The premium compresses fastest exactly when a position needs it most, in both directions, and that is true whether the regime shift is an escalation or a de-escalation.
The mechanism note that builds the variance-swap replication formula from first principles — including the vol-squared derivation behind the 59%/83% gap above and the three data acquisitions needed to size against it properly — is on Patreon.
The obvious objection
OVX has documented predictive power for subsequent realized oil volatility, in-sample and out-of-sample, raising a fair question: why isn’t that good enough to time entries into the premium? Forecasting the average level of realized variance and constructing a hedgeable short-variance position are different tasks. Forecasting skill says implied volatility is rich or cheap on average; it says nothing about the price of the convexity being sold, which is where the tail-risk literature above places the loss exposure, and which only shows up in strike-level surface data. The underlying instrument compounds this: USO near-month options, what OVX is built from, thin out precisely in the deep-wing strikes that matter most during a stress event, a liquidity constraint separate from data availability.
What would change this view
Two specific findings would falsify the claims made here. First, a published study showing crude oil variance-swap-replication alphas converging toward zero over a recent sample, the commodity equivalent of the Dew-Becker and Giglio equity result, would mean the data-access barrier has closed faster than the literature reviewed here suggests. No such study currently exists. Second, a published capacity or crowding estimate specific to commodity variance or volatility-selling strategies, comparable to the Kang-Rouwenhorst-Tang result for value, momentum, and carry, would mean the trade has become crowded enough to study, which would also mean it is closer to its ceiling than the absence of such research currently implies. Both are reasonable things to expect eventually; neither has been published yet, and that gap is the actual state of the evidence rather than a claim about what it will always show.
The actionable implication
A fund without a full options surface, faster positioning data, and point-in-time fundamentals should treat its oil volatility research as regime-level and directional, not as a sized short-variance strategy with a stated Sharpe ratio. That data barrier is real and is the most defensible reason the edge has persisted in the published record. For a fund that does have the full surface and balance-sheet access to implement variance-swap replication properly, the binding constraint shifts from data to liquidity and risk-capital terms: position sizing needs to be set against the depth of the specific OTM wing strikes being traded, not against the headline open-interest figure, and against margin and VaR terms that tighten exactly when realized volatility spikes, particularly through a regime shift of the kind the 2026 Hormuz episode produced twice in four months, first the escalation, then the de-escalation, where wing liquidity disappears fastest in both directions. No public source states what fraction of available liquidity, or what margin terms, would actually bind for this trade. That is a real gap in what can be said here, not a number this piece is able to round to. What the public record does support is narrower: margin- and VaR-driven deleveraging is a documented feature of how short-volatility books fail under stress, and whoever is capturing this premium today is doing so without a published capacity study to size against.
Further reading: The full mechanism note covers the static replication formula (Britten-Jones-Neuberger), the CFTC combined-report staleness problem, the margin-spiral capacity mechanism (Brunnermeier-Pedersen), and the three specific data acquisitions that close the gap from the 1989–2011 academic finding to a sized position in 2026.
📊 Want Deeper Quantitative Analysis?
This research involved extensive data collection, source verification, and multi-round fact-checking against primary sources. If you found value in this deep-dive, I publish exclusive quantitative research, trading strategies, and institutional-grade analysis on Patreon — the same rigour as this piece, applied to ideas that don’t make it into public articles.
By joining, you will be supporting independent research and motivating me to publish more content like this.
→ Join the Patreon community here
For more quantitative finance research, subscribe to The Mathematical Trader on YouTube · Connect on LinkedIn
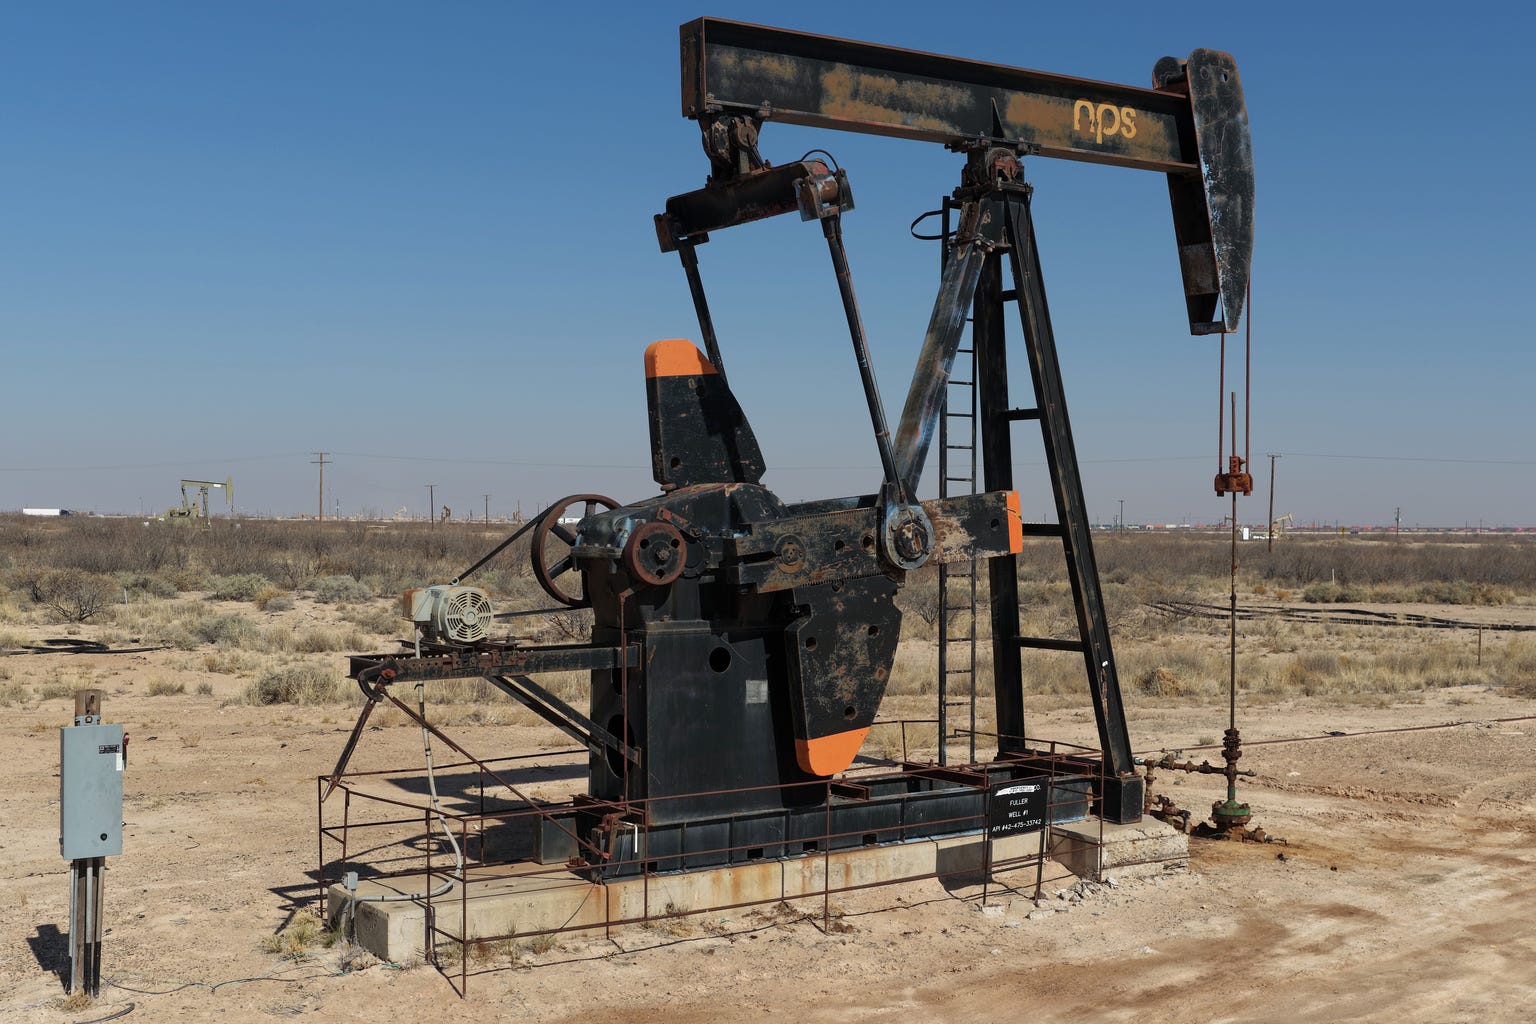
Cover photograph: Quintin Soloviev, CC BY 4.0, via Wikimedia Commons.