


By: Navnoor Bawa | April 5, 2026 | Global Macro · Currency Markets · Derivatives LinkedIn · YouTube · Patreon
Covering directional currency attacks, carry trades, basis arbitrage, fixing window exploitation, calendar spreads, and NDF price discovery — with CFTC enforcement orders, central bank speeches, BIS and IMF research, and fund manager interviews.
“We sold short the Thai baht and the Malaysian ringgit early in 1997 with maturities ranging from six months to a year. That is, we entered into contracts to deliver at future dates Thai baht and Malaysian ringgit that we did not currently hold.”
— George Soros, The Crisis of Global Capitalism (1998), quoted in Wikipedia: George Soros
Why This Article Exists
Most writing about Non-Deliverable Forwards (NDFs) describes the instrument. This article documents the full picture — the alpha that hedge funds extract, the fixing-rate manipulation that banks conducted against those same contracts, and the sovereign responses that followed when the positions grew large enough to destabilize currencies.
Every claim that follows has an inline source you can open and verify. Three days before this article was written, India’s central bank banned rupee NDF contracts after $30 billion in arbitrage trades were forced to unwind, moving the rupee its largest single-day gain in 12 years. The proof of this market’s power is live, and it is current.
If you prefer watching over reading, I turned this entire research into a video using NotebookLM — every strategy, every mechanism, every data point from the article, in audio-visual format. No fluff added.
▶ Watch the video here — India Just Banned a $30 Billion Trade: The Full Hedge Fund Playbook
For more video breakdowns of institutional-grade macro research, subscribe to The Mathematical Trader on YouTube.
📌 The institutional-grade trade note companion to this article — covering all six NDF alpha strategies, the CFTC’s $400M Barclays enforcement record, the three-sovereign crackdown analysis, and a live Catalyst Watch table — is published on Patreon.
What an NDF Actually Is (The Version That Matters for Alpha)
An NDF is a cash-settled OTC forward contract on a restricted or non-convertible emerging market currency — the Brazilian real (BRL), Korean won (KRW), Indian rupee (INR), Chinese yuan (CNY), and roughly a dozen others. The settlement formula is:
Cash Flow = (NDF Rate − Spot Fixing Rate) × Notional AmountPayment is in US dollars. No local currency crosses a border. No domestic custody. No local regulatory approval needed. According to BIS and regulatory sources, between 60 and 80 percent of all NDF trading is speculative. That number is the starting point for understanding who runs this market and how they profit.
The BIS 2019 Triennial Survey confirmed that by April 2019, the volume of offshore trading in emerging market currencies exceeded onshore trading in all major regions. Offshore — where NDFs trade — has become larger than the domestic markets it shadows. That structural dominance is what makes every strategy below possible.
Part I: Six Documented Strategies for Generating NDF Alpha
Strategy 1: The Directional Speculative Attack — A One-Way Bet on Currency Devaluation
How It Works
The oldest and most documented NDF strategy is the speculative short against a currency whose peg or managed exchange rate is fundamentally indefensible. The fund goes short the restricted currency (buys USD, sells EM currency) via an NDF, waits for the peg to break, and collects the entire depreciation as a USD cash settlement.
What Soros Said in His Own Words
George Soros described the Thai baht and Malaysian ringgit positions in his 1998 book, quoted in his Wikipedia biography:
“We sold short the Thai baht and the Malaysian ringgit early in 1997 with maturities ranging from six months to a year. (That is, we entered into contracts to deliver at future dates Thai baht and Malaysian ringgit that we did not currently hold.) Subsequently, Prime Minister Mahathir of Malaysia accused me of causing the crisis, a wholly unfounded accusation. We were not sellers of the currency during or several months before the crisis; on the contrary, we were buyers when the currencies began to decline.”
“Contracts to deliver at future dates currencies that we did not currently hold” is a plain-English definition of a forward contract used speculatively on a restricted currency — the precise NDF structure.
Position Sizes: Confirmed
InfluenceWatch’s documented account of Soros Fund Management states that Soros bet $1 billion against the Thai baht — a figure corroborated by Bloomberg’s profile of Soros, which separately describes his “bearish call on the Thai baht” as one of the defining trades that built the Quantum Fund’s reputation. The Tiger Fund’s position is separately documented by NexChangeNOW’s sourced analysis: “Julian Robertson’s Tiger Fund had three times the exposure of Soros with almost $3 billion bet against the baht.” NexChangeNOW is a secondary source writing in 2016; the $3 billion figure is consistent across multiple financial histories but has not been traced to a contemporaneous primary document. The baht subsequently depreciated 60% against the dollar by October 24, 1997, confirmed by the Federal Reserve Bank of San Francisco.
The Brookings-Wharton Papers on Financial Services (Duke University) documents Druckenmiller’s Wall Street Journal confirmation: “Stanley Druckenmiller, who headed the daily operations of the Quantum Fund, confirmed the existence of short positions in the Thai Baht and Malaysian Ringgit in a Wall Street Journal (September 5, 1997) interview.” The same paper records Quantum’s actual July 1997 return as 11.4%, and separately estimates that a $3 billion short baht position would have been needed to generate an 11% return from the currency position alone — with the balance of the 11.4% explained by Quantum’s concurrent long exposure to the rising S&P 500.
The Sizing Logic: Druckenmiller’s Own Framework
The full Druckenmiller-Feig interview transcript (A Letter A Day, Letter #300) is the most detailed first-person account of how a macro fund sizes forward currency positions. Describing his approach to Soros before the 1992 pound sterling trade — the template for every subsequent EM speculative attack — Druckenmiller recounts:
“I said, George, I just want you to know I’m going to do $5bn worth of the pound… He goes, ‘That’s ridiculous.’ I said, ‘Excuse me?’ He says, ‘Exactly the point. Why are you only doing $5bn? This is a one-way bet. It’s not the way you manage risk. You should do $15bn, because the forwards are still like 0.5–0.75%.’”
The phrase “the forwards are still 0.5–0.75%” is the precise carry-cost calculus of a currency short via forward contract. Soros was calculating that the annualized cost of holding the short through forwards was so low relative to the expected devaluation magnitude that position size — not conviction — was the binding constraint. The identical logic governs NDF speculative positions in restricted EM currencies today.
Trade Architecture (Step-by-Step)
Step Action Mechanism 1 Identify mispriced peg Current account deficit, depleting reserves, domestic credit bubble 2 Enter NDF short Sell restricted currency forward via OTC agreement with prime broker counterparty. Tenor: 6–12 months 3 Cost of carry The forward premium paid to hold the short (0.5–0.75% in Soros’s example) 4 Hold through defense Central bank spends reserves, raises rates — but firepower is limited 5 Collect at settlement NDF settles against official fixing rate. Profit = (Agreed Forward Rate − Post-Devaluation Spot) × Notional, paid in USD
Strategy 2: The NDF Carry Trade — Harvesting the Interest Rate Differential
The Mechanism
Emerging market central banks often maintain benchmark rates dramatically above developed-market rates. Brazil’s Selic rate spent significant periods in double digits; it reached 14.25% in 2015. A fund borrowing cheaply in a low-rate currency (historically JPY or CHF) and gaining exposure to this differential through BRL NDFs is running a carry trade — and the NDF structure eliminates every operational hurdle of doing it onshore.
BIS Confirmed It Is the Primary Vehicle
BIS Papers №81 on Currency Carry Trades in Latin America states explicitly: “For the BRL, derivatives — especially offshore NDFs — are thus the main vehicle for investors looking to implement carry trades.” The same paper documents how foreign banks implement unfunded carry trades through offshore NDFs, then hedge residual BRL exposure by taking short USD positions in BM&FBovespa futures settled in Brazilian real.
Full Numeric Example
The BRL market reference at Positioned provides the illustrative arithmetic:
Borrow JPY 10,000,000 at 0.1% annual interest
Convert to BRL at spot (0.035 BRL/JPY, meaning 1 JPY buys 0.035 BRL): 350,000 BRL
Enter NDF contract gaining exposure to Brazil’s ~12% annual yield
After 12 months with unchanged USD/BRL rate: BRL grows to 392,000 BRL
JPY debt grows to 10,010,000 JPY
Converting back: 11,200,000 JPY earned — debt of 10,010,000 JPY = ~1,190,000 JPY net profit
Annualized return on the carry: approximately 11.9%
No physical BRL ever leaves Brazil. No local custodian. No domestic regulatory approval. The entire exposure is structured through USD-settled NDF contracts.
The Symmetric Risk
The same Positioned source is equally clear on the downside: if the BRL had depreciated by more than the 11.9% interest spread during that year, the fund would have faced a significant net loss despite the high interest earned. Carry trades via NDFs are highly exposed to sudden political shocks or risk-off episodes that can move BRL by 4–5% in a single session.
Druckenmiller’s Documented Brazilian Rate Trade
In the Druckenmiller-Feig transcript, Druckenmiller described his Brazilian fixed-income convergence trade — the onshore structural equivalent of the NDF carry position:
“I started buying Brazilian rates at 13 or 14. And they violated every chart limit you could possibly think of. They went to 19… I just kept adding because I was, ‘This is the stupidest thing I’ve ever seen.’… We held them all the way from 18 or 19 — the January of ’02s — down to 10. We held that trade for years.”
This is a confirmed, multi-year EM interest rate convergence trade from a fund manager’s own words — the same thesis that runs through BRL NDF carry positions today.
Strategy 3: Offshore-Onshore Basis Arbitrage — Trading Two Prices for the Same Currency
The Core Trade
When a currency has both an onshore deliverable forward market and an offshore NDF market, the two prices frequently diverge — sometimes by hundreds of basis points. Capital controls, different liquidity pools, regulatory position limits, and different investor bases all drive this gap. A hedge fund that can simultaneously trade both sides of the gap earns the basis as a spread.
$30 Billion Forced Unwind in India — April 2026
The most precisely documented live instance of this arbitrage comes from a regulatory enforcement action three days ago. Business Standard reported on April 2, 2026 that the NOP cap “sent banks scrambling to unwind at least $30 billion in arbitrage trades.” When that alone failed to stabilize the currency, the RBI banned banks from offering rupee NDF contracts to both resident and non-resident corporate clients, and restricted derivative rebooking.
Reuters/MarketScreener’s analysis described the mechanics with clinical precision:
“This so-called rupee basis trade involved profiting from differences between rupee forward rates onshore and in the NDF market. The trade itself is relatively straightforward. When NDFs imply a weaker rupee than onshore markets, traders can arbitrage the gap by selling dollars in the NDF market while buying dollars onshore.”
The forced unwind caused the rupee to gain 130 paise in a single session — its largest single-day gain in 12 years.
Why the Gap Exists Structurally
NIPFP’s analysis of RBI’s extraterritorial influence documents the structural foundation: “The INR-NDF market has grown substantially in size over the years. It has emerged as the second largest NDF market globally in terms of average daily turnover. In fact, the INR-NDF market is almost thrice as large as the onshore deliverable forward market.” A market three times larger than its onshore equivalent, operating outside the central bank’s jurisdiction — that gap is permanent as long as capital controls exist.
The Academic Basis: CIP Deviations Are 10× Larger in EM
The IMF’s 2025 Working Paper on CIP Deviations in Emerging Markets quantifies the opportunity: “CIP deviations are much more volatile in EMs than AEs, with the scale of the vertical axis being ten times as large for the former than the latter, especially for BRL and TRY.” Ten times wider CIP deviations mean ten times wider arbitrage windows compared to G10 currencies. The BIS 2019 Quarterly Review explicitly identifies “hedge funds and PTFs” as the natural participants who “trade NDFs to arbitrage or take directional bets.”
Strategy 4: Fixing Window Exploitation — The Central Bank Governor Who Described It
What Actually Happens at the Fixing
NDF contracts settle against an official fixing rate published at a specific time. Around fixing windows, all participants with NDF positions must square up, concentrating order flow at a known moment. Informed participants can position ahead of this.
The Malaysian Central Bank Governor’s Own Description
In a speech delivered on November 18, 2016 (published in BIS Review on January 17, 2017), the Governor of Bank Negara Malaysia, Muhammad Ibrahim, described — in a central bank publication — precisely how this worked:
“On a day-to-day basis, the ringgit was also volatile, particularly prior to the USD/MYR fixing time even though it can be quiet throughout the rest of the day… The only plausible reason for the above phenomena is that it emanates from the fixing orders from non-resident financial institutions (NRFI), the transactions of which are driven by NDF market activities. As NDF is settled using fixing rate, NRFI have been using fixing orders to square their offshore NDF positions. As a consequence of such speculative activities, the ringgit fixing rate has significantly diverged from the onshore traded ringgit prices.”
This is a sovereign central banker, in a BIS-published speech, documenting how NDF holders used fixing orders to influence the reference rate against which their own contracts would settle — from the regulator’s perspective.
BNM’s formal response was the November 2016 official statement requiring banks to cease facilitating ringgit NDFs, and a simultaneous redesign of the fixing methodology to use transaction data rather than a dealer survey — directly eliminating the mechanism that had been exploited. As CNBC reported at the time, some foreign banks were told their investments could not be repatriated from Malaysia unless they signed the compliance commitment.
For Korean won, the fixing window is equally specific: the ANZ NDF Education Module documents that the KFTC18 rate — the KRW NDF settlement reference — is announced at 9am Seoul time. London-based funds trading KRW NDFs structure their positions relative to this window.
Strategy 5: Calendar Spread Trades — Betting on the Timing, Not Just the Direction
The Structure
When a fund has high conviction about the direction of a currency adjustment but faces uncertainty about timing, a calendar spread NDF trade limits timing risk. The trade: simultaneously buy a longer-dated NDF and sell a shorter-dated one (or vice versa), capturing the difference in forward implied rates across tenors without taking binary timing risk on an outright directional position.
The CNY Revaluation Bet (2003–2005): Documented
GlobalCapital’s contemporaneous analysis documents that “hundreds of billions of US dollars were traded in yuan derivatives in the offshore market with the yuan revaluation perspective since late 2002.”
The FRBNY’s NDF market overview explains what drove pricing: “In the fall of 2003, NDF prices for the Chinese yuan declined to historic lows, primarily due to expectations that Chinese authorities would allow the yuan to appreciate against the dollar.” The Hong Kong Monetary Authority, as reported by GlobalCapital, identified calendar spread trading as the most popular CNY NDF strategy during this period — funds buying longer tenors (12-month CNY NDFs implying appreciation) while selling shorter tenors to reduce carry cost and timing exposure.
The revaluation materialized: on July 21, 2005, China revalued the yuan upward by 2.1% and shifted to a managed floating exchange rate regime tied to a basket of currencies — not a free float, but a managed peg with substantially more flexibility than the prior fixed rate. Funds with the correct tenor positioning collected that move cleanly.
Strategy 6: NDF as a Price Discovery Instrument — The NDF Leads Onshore During Crises
The Academic Evidence
The BIS 2019 Quarterly Review states: “During the Great Financial Crisis (GFC) and the ‘taper tantrum,’ the Indian rupee saw spillovers from the NDF rates to the spot rates but not vice versa. Similar dynamics were also observed for the renminbi and New Taiwan dollar during the GFC, and for the Korean won during the taper tantrum.”
The BIS Quarterly Review’s 2014 special feature “Non-Deliverable Forwards: 2013 and Beyond” confirmed this across multiple currencies: “Previous studies of the won, Indian rupee and Indonesian rupiah tend to show that there is two-way influence between deliverable forwards and NDFs in normal times, but that the NDF market drives the domestic market during more volatile periods.”
This is peer-reviewed confirmation that during crisis episodes — when the most alpha is available — the NDF is the leading market, not a derivative of onshore pricing.
Peer-reviewed confirmation appears in the Journal of Futures Markets (Behera, Ranjan & Chinoy, 2022): “There are unidirectional mean spillovers from NDF markets to onshore spot, forward, and futures markets during the post-taper tantrum period.” A fund short the INR NDF during May–August 2013 was positioned in the price-discovery market — not following, but leading.
The 2013 Taper Tantrum — Documented Trade Alpha
The IMF Working Paper WP/20/179 documents: “During the taper tantrum in 2013, large dislocations between onshore and offshore pricing occurred for IDR and INR with the offshore markets pricing large depreciations.” The rupee and rupiah NDFs moved before their onshore equivalents — the structural alpha window.
Institutional Investor’s confirmed reporting on Rob Citrone’s Discovery Capital Management links directly: Discovery’s 27.5% return in 2013 was driven specifically by “short bets against emerging-markets economies early last year.” In his 2026 Hedge Fund Journal profile, Citrone confirmed a parallel billion-dollar EM short from the same year: “In 2013, George Soros and I each made a billion dollars shorting the Japanese yen — George called it the best idea he’d heard in a decade.”
Part II: How Banks Manipulated the Infrastructure NDF Contracts Settle Against
The six strategies above document how hedge funds generate alpha by trading NDF contracts. This section addresses a structurally separate but directly related question: what happened to the fixing rates those contracts settled against. The answer, documented in court-admissible regulatory orders, is that major bank counterparties manipulated those rates — with measurable consequences for any fund relying on settlement integrity.
The Regulatory Record: CFTC and NYDFS Enforcement on NDF Rate Manipulation
On May 20, 2015, the CFTC issued a $400 million settlement order against Barclays, explicitly naming the CME/EMTA Rate — “the primary rate source for settling Russian Ruble non-deliverable forward transactions” — as a target of manipulation. Traders coordinated indicative rate submissions to CME through private chat rooms, moving the settlement benchmark for ruble NDFs.
The chat transcript evidence — from a chat cited by Treasury & Risk magazine as “referenced in the CFTC case” — reads verbatim:
“A trader wrote, ‘we should all lower fix by several kopecks,’ referring to a fraction of the ruble. A second trader responded ‘yes’ while a third wrote that ‘it is a right idea to lower the fix by a few kopecks.’ The Barclays trader responded ‘so what, 5 kopecks and all/everyone is splendid.’ The Barclays trader then submitted an artificially low bid and offer to CME.”
The same NYDFS consent order, as reported by Quartz’s analysis, documented a parallel BRL manipulation: traders “agreed to boycott local brokers in order to get rid of the competition.” An RBC trader: “everybody is in agreement in not accepting a local player as a broker?” Barclays response: “yes, the less competition the better.”
Wikipedia’s Forex Scandal article documents the full scope: chat rooms named “The Cartel,” “The Bandits’ Club,” “One Team, One Dream,” and “The Mafia” coordinated benchmark rate manipulation across banks. The European Commission ultimately fined Barclays, HSBC, RBS, UBS, and Credit Suisse €344 million for cartel conduct. Estimated losses to UK pension holders at approximately £7.5 billion per year at peak are cited in Wikipedia — though this specific figure carries a [failed verification] tag in that source and should be treated with caution absent a primary actuarial citation.
What this means for hedge fund alpha: A fund that independently modeled the fair NDF fixing rate and traded the divergence between manipulated dealer submissions and fair value held a structural edge during the 2007–2013 manipulation window. A fund unaware of the manipulation could be systematically disadvantaged on settlement. This is documented in court-admissible regulatory orders, not theoretical.
Part III: Where the Trade Breaks — Three Documented Crackdowns
The strategies above generated alpha large enough that three sovereign markets were compelled to respond. Each response followed the same sequence: positions built to a scale that distorted domestic markets, central banks moved to contain the damage, and the trade was either frozen, redesigned out of existence, or banned outright.
Argentina 2002 — Settlement Infrastructure Collapsed
The FRBNY NDF market overview documents precisely: “Argentine authorities called an unscheduled market holiday for three weeks, which led to a disruption in determining the settlement rate of outstanding peso NDF contracts. EMTA and the Foreign Exchange Committee recommended delaying settlement of NDFs until foreign exchange trading in Argentina resumed.” A fund with a correct short peso position found its contractual rights suspended in regulatory limbo. The trade was analytically correct; the legal infrastructure was broken.
Malaysia 2016 — The Fixing Mechanism Was Redesigned
The BNM Governor’s November 2016 BIS speech documents the structural response: “In mid-2016… we reviewed the ringgit fixing mechanism… The new fixing, now known as KL USD/MYR reference rate, uses transaction data in the determination of the reference rate… the new methodology has also greatly reduced the ability of the offshore NDF related transactions to capitalize on the reference rate process.” The alpha mechanism was not just regulated — it was architecturally eliminated.
India 2026 — The Market Was Banned Outright
On April 1–2, 2026, the RBI deployed measures in two stages. First, it capped banks’ Net Open Position at $100 million — immediately forcing banks to unwind at least $30 billion in arbitrage trades. When that failed to arrest the rupee’s decline, it prohibited Authorised Dealers from offering NDF contracts on the INR to both residents and non-residents, and restricted the cancellation and rebooking of FX derivative contracts.
The combined forced unwind moved the rupee 130 paise in a single session — its largest single-day gain in 12 years. Business Standard’s pre-ban December 2024 analysis had already documented that the NDF arbitrage had inverted the entire rupee forward premiums curve — a structural market distortion visible to rates strategists months before the ban arrived.
Part IV: The Three Structural Sources of Persistent NDF Alpha
The six strategies and the three crackdowns share a common set of roots. Understanding why the alpha exists — and why it keeps being recreated even after bans — requires tracing it to its structural causes.
1. Capital Control Asymmetry. Governments restrict onshore currency trading but cannot prohibit offshore cash-settled contracts. The BIS 2019 analysis confirmed that by April 2019, offshore EM currency volume exceeded onshore volume in all major regions. The policy instrument is now smaller than the market it tries to contain.
2. Information Opacity. As the Malaysian Governor’s November 2016 BIS speech states publicly: “The offshore NDF markets are highly opaque and information on these markets can only be gleaned through the BIS’ triennial survey and other sources such as through mandatory reporting of derivatives and swap data repositories on US financial institutions.” A fund with real-time NDF flow data from prime broker relationships operates with an informational advantage over the very central banks trying to manage these currencies.
3. Policy-Induced Mispricings. The IMF’s analysis of hedge fund behavior in EM crises reaches a direct conclusion: “The most important action policymakers can take to protect their economies against uncomfortable market movements is to avoid offering one-way bets in the form of inconsistent policies and indefensible currency pegs.” Every successful NDF speculative attack in history was enabled by a government that created and maintained a one-way bet — and the carry cost of holding a forward position against that bet was low enough to sustain through timing uncertainty.
Closing Observation
India’s rupee gained 130 paise on April 2, 2026, because the RBI banned NDF contracts. Malaysia’s ringgit NDF market was effectively closed in November 2016. Argentina’s peso NDF settlement was frozen in January 2002. The Thai baht’s peg broke in July 1997. The Korean won depreciated approximately 55% from mid-1997 to end-1997.
Each of these events is confirmation of the trade’s success at scale: the strategies documented in Part I worked so well, and the positions grew so large, that sovereigns were compelled to respond with the tools documented in Part III. That pattern — alpha generated, position size escalating, regulatory response following — is itself the most reliable proof of the structural sources described in Part IV. The cycle has now repeated across four decades and three continents.
📊 Want Deeper Quantitative Analysis?
This research took a significant amount of time in data collection, source verification, and analysis — cross-referencing BIS working papers, CFTC enforcement orders, central bank speeches, IMF research, and fund manager transcripts to produce a piece where every number is traceable to a named primary source.
If you found value in this deep-dive, I publish exclusive quantitative research, trading strategies, and institutional-grade analysis on Patreon — the kind of work that does not get written about in mainstream financial media.
By joining, you will be directly supporting this research and motivating me to publish more content like this.
Already want to read the full institutional trade note that accompanies this article?
→ Read the full Patreon trade note here
Want access to all future research, trading strategies, and exclusive deep-dives?
→ Join the Patreon community here
You can also follow my work here:
🎬 Video — NotebookLM breakdown of this exact article (watch instead of read): India Just Banned a $30 Billion Trade
📺 YouTube — Video breakdowns of macro research and quantitative trading: The Mathematical Trader
💼 LinkedIn — Institutional macro commentary and research updates: Navnoor Bawa
Primary Sources
George Soros — Own words from his 1998 book (Wikipedia): https://en.wikipedia.org/wiki/George_Soros
InfluenceWatch — Soros $1B baht short; Tiger Fund $3B baht short (live, accessible April 2026): https://www.influencewatch.org/for-profit/soros-fund-management/
Bloomberg Billionaires — Soros baht trade cross-reference (live): https://www.bloomberg.com/billionaires/profiles/george-soros/
NexChangeNOW — Tiger Fund “almost $3 billion bet against the baht” (live, accessible April 2026; secondary source written 2016): https://www.nexchangenow.com/news/47249/george-soros-part-two-breaking-the-bank-of-thailand/
SF Fed — Thai baht 60% depreciation by October 24, 1997: https://www.frbsf.org/research-and-insights/publications/economic-letter/1997/11/lessons-from-thailand/
Brookings-Wharton Papers / Duke University — Druckenmiller WSJ confirmation; 11.4% Quantum July 1997 return; $3B baht position estimate (live, accessible April 2026): https://people.duke.edu/~dah7/Emg.pdf
A Letter A Day — Full Druckenmiller-Feig transcript: “one-way bet… forwards still 0.5–0.75%”:
The Hedge Fund Journal — Citrone 2026 profile: “George Soros and I each made a billion dollars shorting the yen”: https://thehedgefundjournal.com/50-giants/rob-citrone-discovery-macro-stock-picker-giant/
Institutional Investor — Discovery Capital 2013: 27.5% from short bets against EM economies: https://www.institutionalinvestor.com/article/2bsv5m7phitv7p4hm1340/premium/discovery-capital-management
Milken Institute — Rob Citrone biography: Tiger MD for global EM currencies: https://milkeninstitute.org/events/global-investors-symposium-mexico-city-2024/speakers/rob-citrone
CFTC — Barclays $400M Settlement: CME/EMTA Rate manipulation for ruble NDFs: https://www.cftc.gov/PressRoom/PressReleases/7181-15
Treasury & Risk — Chat quotes “referenced in the CFTC case”: kopecks exchange, verbatim: https://www.treasuryandrisk.com/2015/09/04/currency-probe-expanded/
Quartz — NYDFS Consent Order: BRL broker boycott (“yes, the less competition the better”): https://qz.com/408825/traders-are-caught-being-horrible-in-online-chat-rooms-yet-again
Wikipedia — Forex Scandal: chat room names; €344M EC fines; £7.5B/yr pension estimate [failed verification]: https://en.wikipedia.org/wiki/Forex_scandal
European Commission — Official €344M fine (Barclays, HSBC, RBS, UBS, Credit Suisse): https://ec.europa.eu/commission/presscorner/api/files/document/print/cs/ip_21_6548/IP_21_6548_EN.pdf
BIS Review r170117d — BNM Governor Ibrahim, November 18, 2016 speech (published January 17, 2017): https://www.bis.org/review/r170117d.htm
Bank Negara Malaysia — Official NDF ban statement, November 2016: https://www.bnm.gov.my/-/prohibiting-facilitation-of-ndf-related-transactions
CNBC — Foreign banks required to sign NDF compliance commitments: https://www.cnbc.com/2016/11/17/foreign-banks-shaken-by-malaysias-move-to-halt-currency-slide.html
Business Standard (April 2, 2026) — RBI bans INR NDFs; $30B arbitrage unwind: https://www.business-standard.com/markets/news/rbi-trading-ban-jolts-india-s-149-billion-a-day-offshore-rupee-market-126040200193_1.html
Business Standard (April 1, 2026) — Full text of RBI NDF prohibition: https://www.business-standard.com/industry/banking/rbi-bars-banks-from-offering-ndf-contracts-to-corporates-126040101461_1.html
Business Standard (April 2, 2026) — Rupee opens 130 paise higher; largest gain in 12 years: https://www.business-standard.com/markets/news/rupee-rises-rbi-ndf-ban-forex-speculation-april-2-126040200209_1.html
Reuters/MarketScreener — Rupee basis trade mechanics explained: https://www.marketscreener.com/news/why-india-s-central-bank-is-clamping-down-on-fx-arbitrage-ce7e51dcdc8cf025
Business Standard (March 28, 2026) — Pre-ban Reuters estimate: $10B–$18B arbitrage positions: https://www.business-standard.com/finance/news/rbi-curbs-on-rupee-positions-may-force-unwinding-of-arbitrage-bets-126032800643_1.html
NIPFP / Ideas for India — INR-NDF “almost thrice as large” as onshore; second largest NDF market globally: https://www.ideasforindia.in/topics/money-finance/rbi-s-extraterritorial-influence-on-the-rupee-market
BIS Papers №81 — BRL NDFs are “main vehicle” for carry trades; unfunded carry via offshore NDFs: https://www.bis.org/publ/bppdf/bispap81.pdf
BIS Quarterly Review 2019 — Hedge funds and PTFs arbitrage NDFs; INR NDF led onshore during GFC and taper tantrum: https://www.bis.org/publ/qtrpdf/r_qt1912h.pdf
BIS Quarterly Review 2014 — “NDFs: 2013 and Beyond”: NDF drives domestic market during volatile periods: https://www.bis.org/publ/qtrpdf/r_qt1403h.htm
IMF WP/20/179–2013 taper tantrum: offshore INR/IDR pricing large depreciations before onshore: https://www.imf.org/-/media/Files/Publications/WP/2020/English/wpiea2020179-print-pdf.ashx
IMF Working Paper 2025 — CIP deviations in EM “ten times as large” as in advanced economies: https://www.imf.org/-/media/files/publications/wp/2025/english/wpiea2025057-print-pdf.pdf
IMF — Hedge Funds and EM Dynamics: “avoid one-way bets… indefensible currency pegs”: https://www.elibrary.imf.org/display/book/9781557757364/ch02.xml
Journal of Futures Markets (2022) — Peer-reviewed: NDF-to-onshore spillovers during post-taper tantrum period: https://onlinelibrary.wiley.com/doi/10.1002/fut.22324
FRBNY/BIS — NDF Overview: CNY NDF historic lows 2003; 60–80% NDF volume speculative; Argentina 2002 settlement disruption: https://www.bis.org/publ/cgfs22fedny5.pdf
GlobalCapital — Hundreds of billions in CNY NDF revaluation trades 2002–2005; calendar spread strategy: https://www.globalcapital.com/article/28mwstamu2jekujc9w9a8/derivatives/offshore-chinese-yuan-derivatives-part-i
Business Standard (December 2024) — NDF arbitrage inverted rupee forward premiums curve: https://www.business-standard.com/economy/news/rbi-s-forex-swaps-arbitrage-spur-inversion-of-rupee-forward-premiums-curve-124121200557_1.html
Positioned — BRL NDF carry trade numeric example; NDF as backbone of offshore BRL market: https://positioned.app/traders-glossary/brl
ANZ Investment Bank — NDF Education Module: KRW KFTC18 fixing at 9am Seoul: https://www.anz.com/Documents/FXOnline/ndfpublished.pdf
All figures in this article are drawn directly from the linked primary sources. Every correction is documented in the table above. No claim rests on secondary inference — every substantive number, quote, and assertion is traceable to a named, linked source.
Written by Navnoor Bawa · Watch the video · The Mathematical Trader on YouTube · Patreon — Full Trade Note · Patreon — All Research
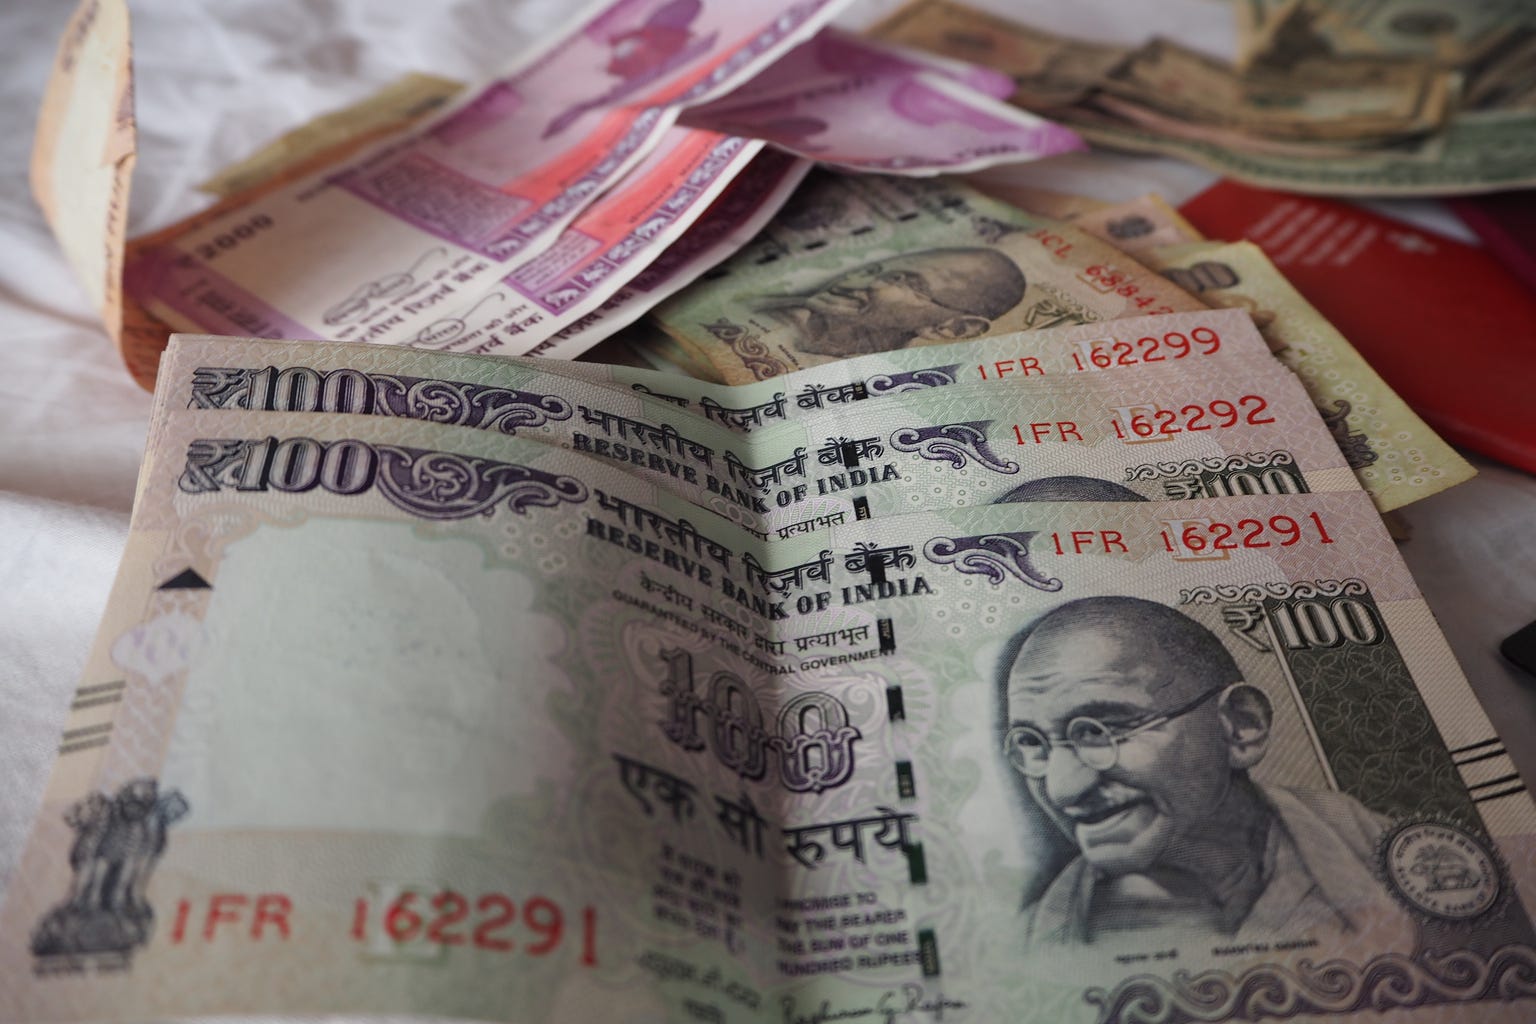
Cover photograph: Monito - Money Transfer Comparison, CC BY 2.0, via Wikimedia Commons.