


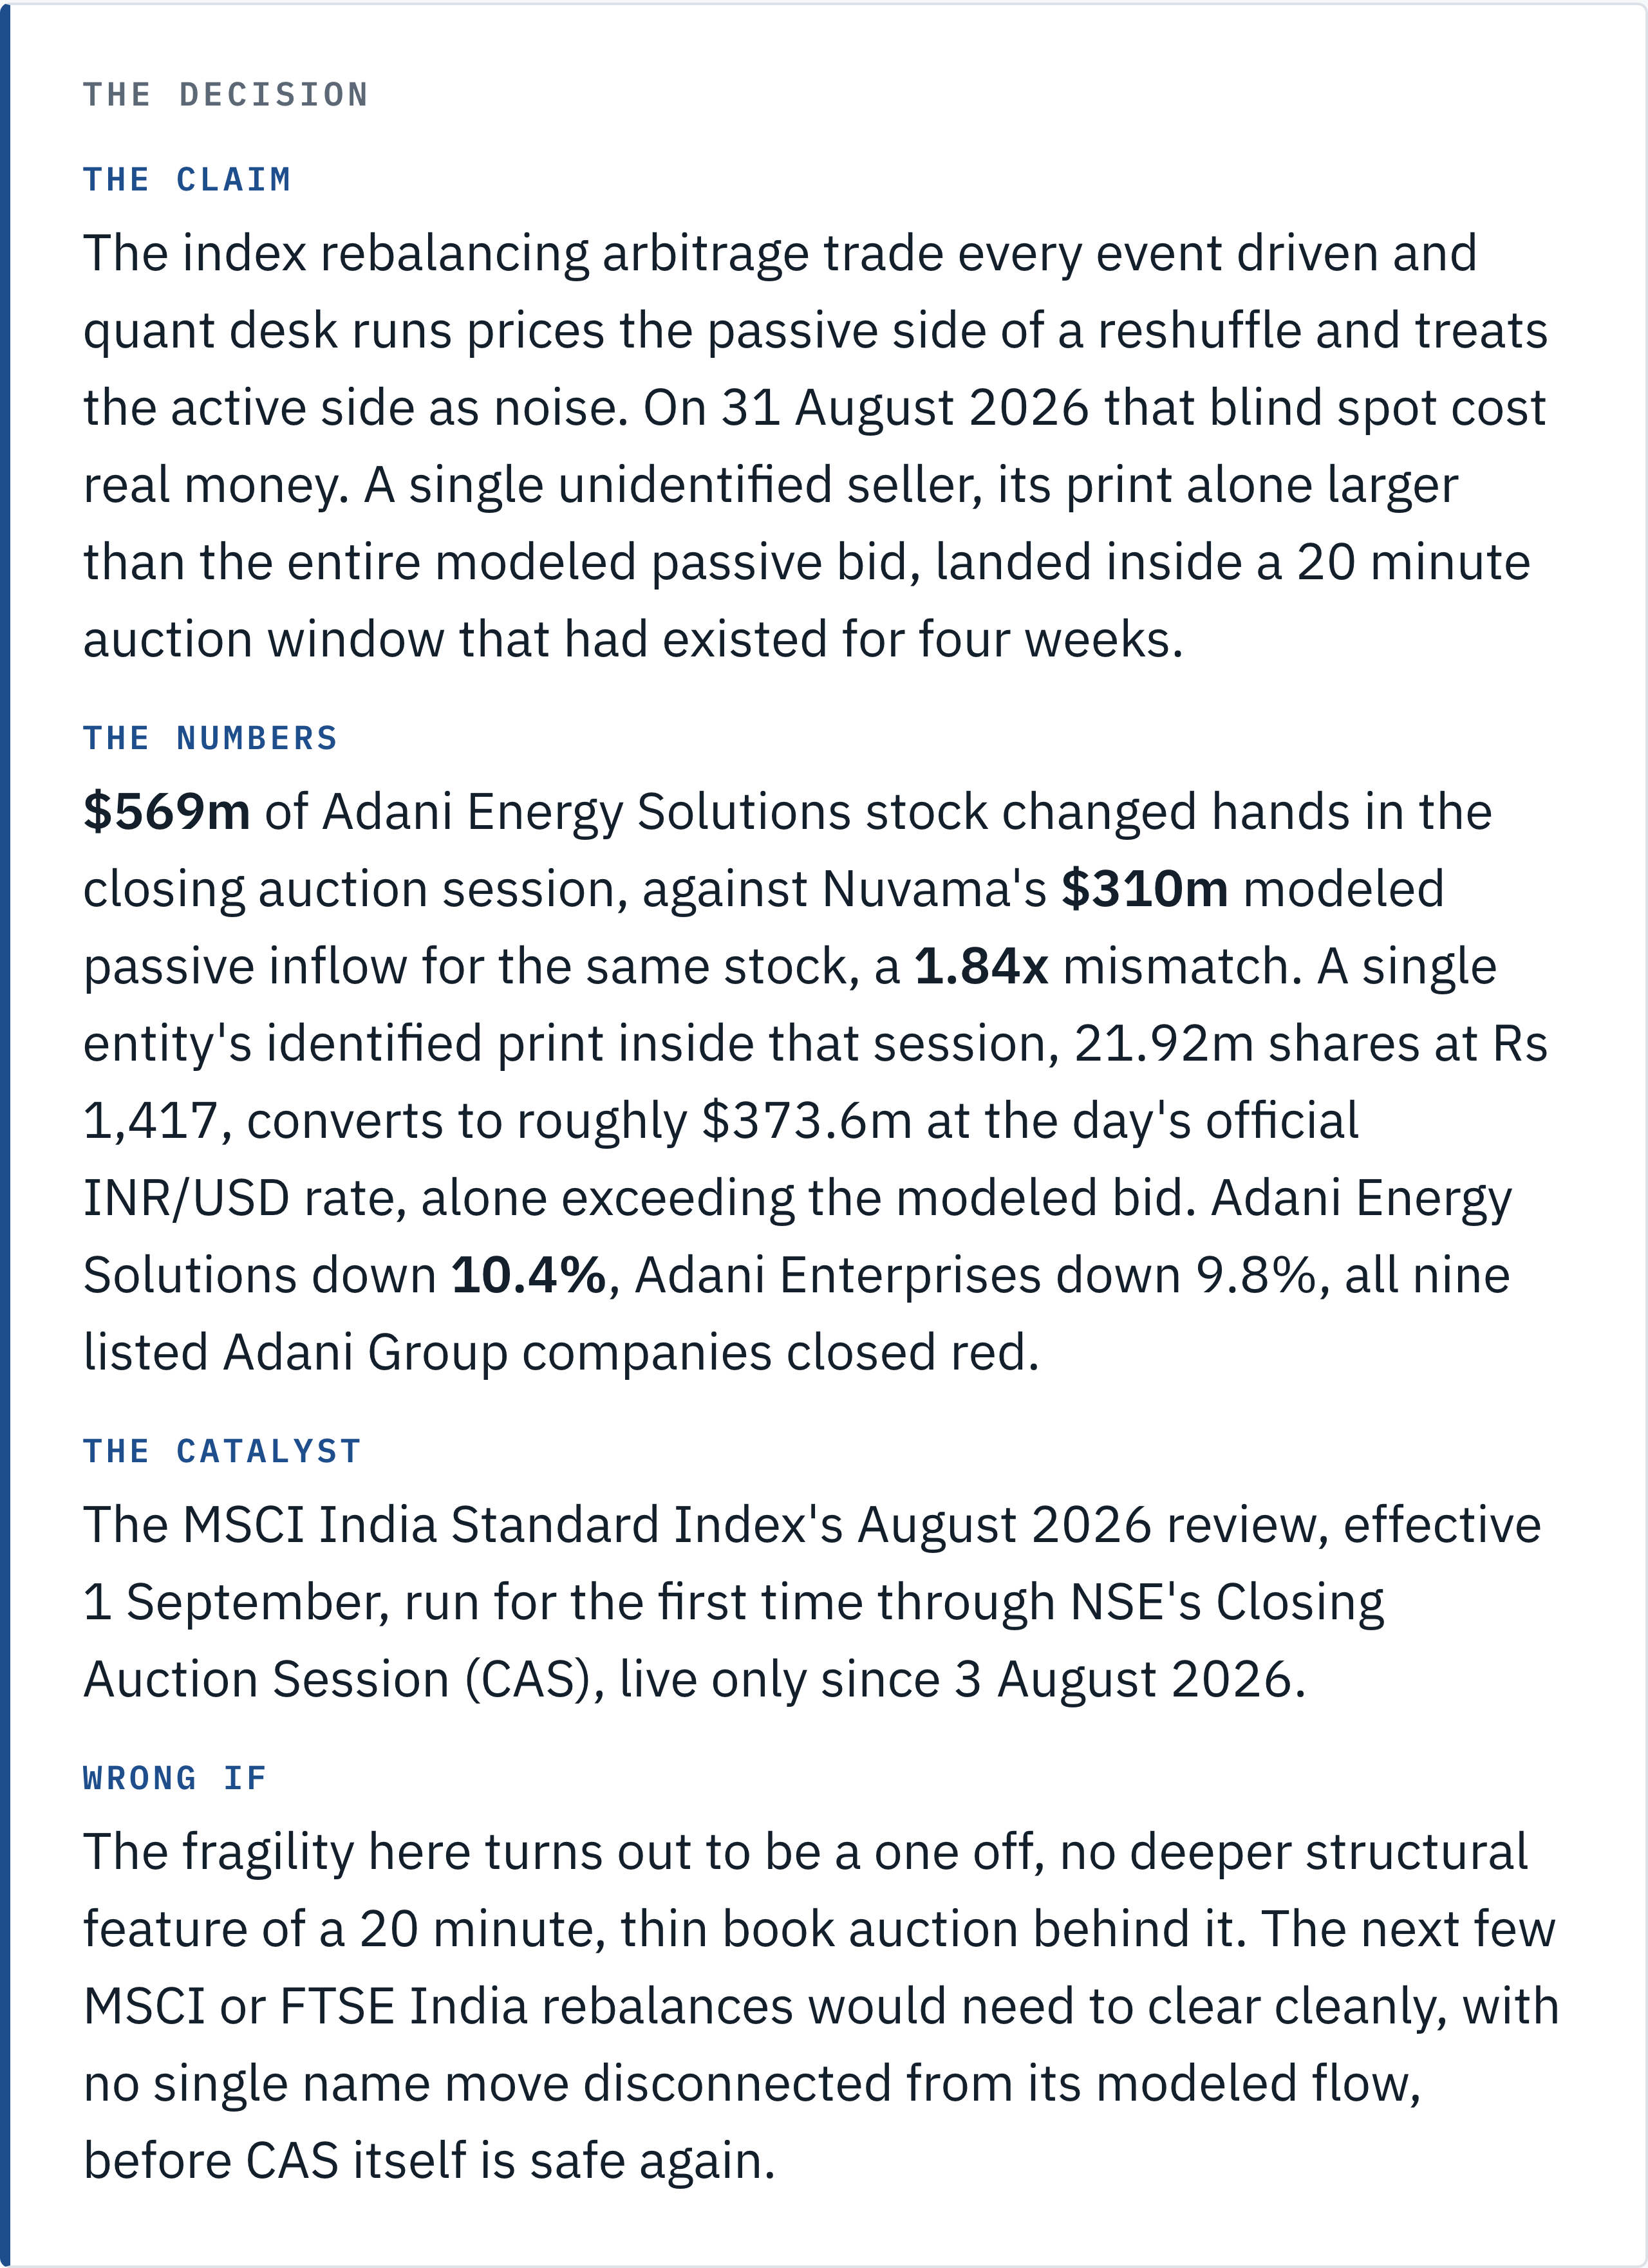
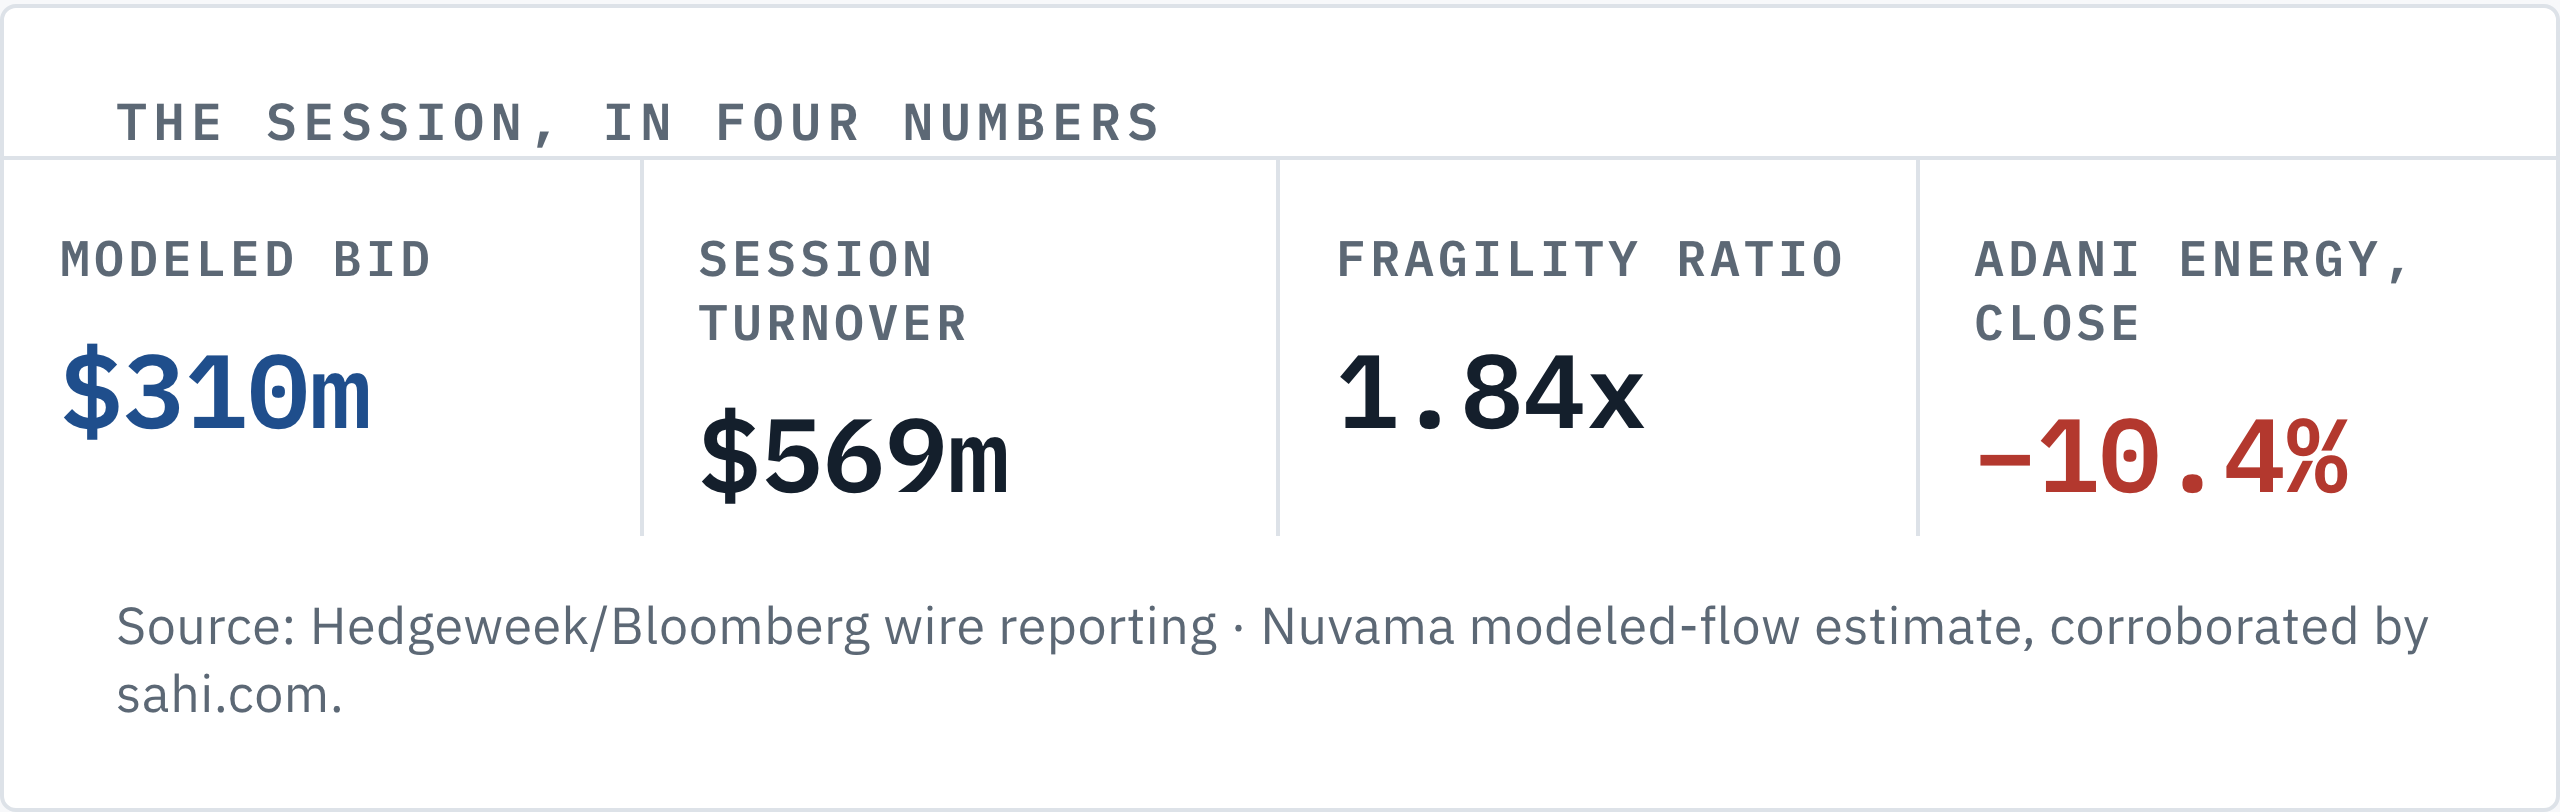
MSCI modeled a $310 million passive bid for Adani Energy Solutions. The 31 August closing auction needed $569 million to clear, and the stock fell 10.4% and stayed there.
Below the paid line:
GQG’s own quarterly and SAST filings, read side by side against each other. What they can and cannot prove about who actually sold in the auction print
Nuvama’s passive demand build reconstructed for all four MSCI adds, and what it implies about the size of money that was supposed to show up
the auction’s own capacity math, worked from the $4.1bn figure and BNP Paribas’s disclosed share of it
the fragility ratio worked two ways, session total against modeled bid and identified print against modeled bid, and whether either is now the going rate
why Adani Group’s own post-Hindenburg volatility record, running since January 2023, can’t settle whether CAS or the stock’s concentration explains the size of the move
I make that 1.84 times, on the number that actually reconciles. $569m changed hands in the session against a modeled bid of $310m. The session alone was nearly twice the size of the entire passive order the trade was built to absorb, before counting who specifically sold into it.
Below the paid line: GQG’s two filings, reconciled line by line, and the 1.84x fragility ratio for the next MSCI rebalance.
The consensus: Shah and Kejriwal both called this manageable
The professional view of index rebalancing arbitrage is not naive, and I want to state it in a form its own practitioners would sign. Event driven and quant funds have run this trade since MSCI, S&P and FTSE reviews became transparent, rules based events.
Antti Petajisto’s index premium research, covering 1990 to 2005, measured the mechanism directly. S&P 500 additions carried an average 8.8% price impact. Deletions averaged minus 15.1%. Both real, both measured. A fund that buys ahead of the effective date and sells into the passive bid is not gambling on direction. It is monetizing a flow it can see coming, from a counterparty with no discretion to walk away.
Tejas Shah of Equirus Securities put the calmer version to the wires days before the rebalance. The larger names entering the MSCI basket were not major index components, he said, so volatility at the headline level would not be very significant. Called it early. Anand James at Geojit Investments said almost the same thing after the fact, in fewer words: flows driven moves were always expected.
Both are describing a market that did what it was supposed to do. A predictable amount of buying showed up for a predictable reason, on a predictable day. Nothing unusual, on the surface. The Nifty Bank index closed about 0.9% higher after dipping into the auction. That is the orderly outcome the consensus predicts.
It is a coherent, evidence backed position, and most of the time it is correct. It just wasn’t the whole story for Adani Energy Solutions.
The variant view: a session nobody modeled for
The session needed $569m. The model only ever promised $310m. Here’s the observation that forces a different reading. Nuvama modeled $310m of passive demand landing in Adani Energy Solutions from trackers alone. $569m of the stock changed hands in the session that was supposed to absorb it. Nearly double. That’s the session level mismatch. It alone is 1.84 times the modeled bid.
Inside that session, Bloomberg’s reporting names a single entity that sold 21.92 million shares at Rs 1,417 in the closing print. At that day’s official Rs 83.15 to the dollar, published by the Federal Reserve, that print alone comes to roughly $373.6m. That’s already bigger than the whole modeled bid, before counting anyone else who sold. I want to be precise rather than round up: it isn’t quite the “nearly double” a loose read of the session total might suggest. Call it a fifth larger. The rest of the 1.84x gap came from elsewhere in the session’s turnover, not from this one print.
My read: the index rebalancing arbitrage trade has a structural blind spot, and CAS just made it visible. The trade prices one side of the ledger with real rigor. Nuvama’s $310m and $202m figures for Adani Energy Solutions and Adani Enterprises aren’t guesses. They’re built from MSCI’s published float adjusted weight changes, multiplied against the assets under management of every fund that tracks the index, and a second, independent estimate lands on the same two figures. Two sources, one number.
The other side of that window gets modeled as noise. Active sellers who might show up for reasons that have nothing to do with the index review. If they get modeled at all.
GQG Partners is the unnamed entity the market read into Bloomberg’s reporting, and it had every reason to sell some Adani Energy Solutions that week for reasons that had nothing to do with MSCI. It built the position starting 2 March 2023, the first major institutional buyer across the Adani group after the Hindenburg report, putting roughly $1.9bn, Rs 15,446 crore, to work as a public vote of confidence. A big bet, publicly made. It’s been trimming that position for over a year, and it isn’t just Adani Energy Solutions. Its own quarterly disclosures show it also cut Adani Enterprises, Adani Green Energy, Adani Ports and Adani Power the same quarter. That pattern is the tell. A multi name, multi quarter drawdown reads like ordinary portfolio management, on its own calendar, that happened to land in the one twenty minute window each quarter where its size matters most.
A less charitable read is available, and I want to name it rather than let the coincidence framing do all the work. A fund unwinding size that large doesn’t usually choose to clear it inside a brand new, thin, twenty minute auction if the goal is a clean print. It’s at least as plausible the seller timed the trade to the rebalancing on purpose, using the modeled passive bid as cover for size that would otherwise be hard to clear without moving the market itself. I can’t distinguish “coincided with the passive bid” from “was aimed at the passive bid” from public filings. That’s a real limit on the ordinary portfolio management reading, and I’m naming it rather than hiding behind it.
The mechanism: how twenty minutes turned a session into a 10.4% print
Five steps turn a compressed auction window into a broken print. Walk the chain from the auction’s design to the printed loss, because “the trade was crowded” is not an explanation on its own. Crowded trades survive uneventful days all the time.
Step one: CAS compresses a day’s information into twenty minutes. NSE’s Closing Auction Session launched 3 August 2026, running 3:15pm to 3:35pm on every trading day. Instead of a stock’s official close being whatever price continuous trading last produced, buy and sell orders accumulate for that twenty minute window and the exchange computes a single equilibrium price. On 31 August that window cleared $4.1bn to $4.2bn of MSCI linked turnover. That is 21 to 22% of NSE’s entire cash market volume for the day. A fifth of the day, in twenty minutes. A mechanism built to concentrate price discovery had, on its first real stress test, concentrated an entire quarter’s index review flow into minutes.
Step two: one bank cleared nearly half of it. That is a depth problem stated as a fact, though not a complete one. BNP Paribas alone executed about Rs 180bn, roughly $1.9bn, of the day’s $4.2bn CAS total. Nearly half the entire auction’s flow ran through one counterparty’s book. The reporting doesn’t say whether that was BNP risking its own balance sheet or routing a long list of institutional clients through its execution desk. Two very different stories. The two mean different things. Principal risk taking concentrated in one bank is a genuine depth story. Client flow routed through one broker’s plumbing is a different story wearing the same clothes. Either way, that much of the day’s flow moving through one counterparty’s book is itself worth naming.
Proprietary traders make up roughly a third of NSE’s normal turnover. Most stayed cautious about the new auction. The usual buyers, missing. Depth was not evenly distributed. It sat with one bank, and mostly absent from the desks that normally supply liquidity on an ordinary session.
Step three: a 3% price band turns a depth shortage into a hard stop. Not a slope. Roughly 60 stocks hit the auction’s 3% price limit that session. Sixty names, one afternoon. Eternal, Adani Enterprises and Reliance Industries were among the names swinging sharply. Once a stock’s clearing price would move more than 3% from its reference, the exchange does not let it move further inside that window. The imbalance has to resolve some other way, or carry into the next session.
The same August review removed Balkrishna Industries, SBI Cards and Astral from the index. Petajisto’s deletion data is why a rebalancing desk should care about outflows as much as inflows: minus 15.1% average impact, nearly double the addition side premium in his sample. A 20 minute auction concentrates exit flow the same way it concentrates entry flow. Same fragility, running the other direction, on the same clock.
