


This is a detailed research piece. If you find value in institutional-quality hedge fund analysis, support this work on Patreon.
The Bottom Line: Market-making in derivatives generates substantially higher revenue than directional derivatives trading, and the gap is widening. In 2024, the top two derivatives market-makers (Jane Street and Citadel Securities) generated $30.2B in combined trading revenue — roughly triple the absolute returns generated by comparable multi-strategy hedge funds.
Methodological Note: This analysis compares market-maker net trading revenue (proprietary capital deployment) against hedge fund gross investor returns (AUM-based performance). While these are different metrics, the comparison illuminates fundamental business model differences: market-makers monetize flow and spreads with minimal directional exposure, while hedge funds generate alpha through directional bets subject to capacity constraints and 2/20 fee structures.
The Revenue Disparity
Market-Makers (2024):
Jane Street: $20.5B net trading revenue (Bloomberg, Apr 2025)
Citadel Securities: $9.7B net trading revenue, up 55% from 2023’s $6.3B (Bloomberg, Mar 2025)
Directional Hedge Funds (2024):
Citadel (hedge fund): 15.1% return on $66B AUM = ~$10B gross returns (CNBC, Jan 2025)
Millennium: 15% return on $72.1B AUM = ~$10.8B gross returns (Hedgeweek, Jan 2025)
The key distinction: market-maker revenue is net trading revenue, while hedge fund figures represent gross returns before 2/20 fee structures reduce investor net returns by approximately 50%.
Why Market-Making Dominates
1. Volume Capture vs. Directional Bets
Jane Street handled >10% of U.S. equity market volume in 2024, averaging $2.4T in monthly global equity trading (Global Trading, Apr 2025). In ETFs alone, the firm captured 24% of primary market and 16% of secondary market activity. Options represented 8% of all OCC volumes — nearly 1 billion contracts.
Market-makers earn bid-ask spreads on massive flow with near-zero net directional exposure. Profit accrues on every trade regardless of market direction.
Hedge funds require correctly predicting price movements. Even with 8x leverage (typical for multi-manager platforms), alpha generation is constrained by position sizing, correlation risk, and capacity limits.
2. Structural Revenue Edges
Market-makers monetize multiple revenue streams beyond spread capture:
Payment for Order Flow (PFOF): Citadel Securities paid $388M in Q1 2025 alone to acquire retail flow, representing 45% YoY growth (Global Trading, Jun 2025). Industry-wide PFOF hit a record $1.19B in Q1 2025, with two-thirds directed toward options contracts.
Exchange Rebates: Liquidity provision generates rebates on posted orders across major venues.
Information Asymmetry: Sub-millisecond execution data provides microstructure edge unavailable to directional traders.
3. Capital Efficiency
Citadel Securities posted 58% EBITDA margins in Q1 2025 with $1.7B net income on $3.4B revenue (Hedgeweek, May 2025). Jane Street generated $6.93M revenue per employee in 2024 with 2,960 staff (year-end 2024 headcount, eFinancialCareers).
Contrast this with multi-strategy hedge funds that maintain large research teams, portfolio managers across 320+ pods (Millennium), and complex infrastructure to support directional strategies.
The P&L Mechanics
Market-Maker Revenue Drivers:
Spread Capture: Buying at bid, selling at ask across millions of derivatives contracts daily
Delta-Neutral Inventory Management: Hedging positions in real-time while collecting theta decay
Volatility Arbitrage: Profiting from implied vs. realized volatility discrepancies
Toxic Flow Filtering: Identifying and avoiding informed order flow (adverse selection)
Directional Trader Revenue Drivers:
Alpha Generation: Predicting price movements ahead of market
Relative Value: Capturing spread compression/widening between related instruments
Event-Driven: M&A arbitrage, earnings surprises, macro events
Volatility Trading: Long/short volatility positioning
The critical difference: market-making scales linearly with volume and volatility. Directional trading scales with conviction, which has hard capacity constraints — you cannot deploy infinite capital into finite opportunities without moving markets.
The 2024 Volatility Windfall
Market turbulence amplified the revenue gap. Jane Street’s Q3 2024 revenue more than doubled YoY to $5.8B (Bloomberg, Dec 2024). Citadel Securities’ Q1 2025 revenue of $3.4B marked a 45% YoY increase.
Why? Volatility creates both wider spreads and higher volumes — market-makers compound both effects. The 2024–2025 period saw sustained elevated volatility driven by policy uncertainty, geopolitical tensions, and retail trading surges.
Directional funds benefit from volatility through increased alpha opportunities, but they still require correct directional calls and remain exposed to correlation risk during regime shifts.
The Citadel Dual Model
Ken Griffin operates Citadel (hedge fund) and Citadel Securities (market-maker) as legally distinct entities — an industry outlier demonstrating the structural advantage of market-making.
Citadel Hedge Fund (2024):
Wellington Fund: 15.1% net return
Tactical Trading Fund: 22.3% return (CNBC, Jan 2025)
AUM: $66B
Gross returns: ~$10B
Citadel Securities (2024):
Trading revenue: $9.7B
Net income: $4.2B (more than doubled from 2023)
EBITDA: $5.2B (87% YoY growth)
Trading capital: $16B (vs. $66B AUM at hedge fund)
Citadel Securities generates comparable revenue to the hedge fund’s gross returns while deploying roughly 25% of the capital and avoiding client redemption risk, performance fee waterfalls, and management complexity.
The Options Explosion
The shift toward derivatives-heavy retail flow has supercharged market-maker revenues. PFOF payments for options have grown substantially faster than equity-linked payments since 2022 — option-linked PFOF more than tripled from Q1 2022 to Q1 2025, while equity PFOF grew less than 50% (Global Trading, Jun 2025).
Robinhood’s PFOF receipts hit $560M in Q1 2025, with 80% derived from options at an average of 0.65 cents per share — the highest rate among major brokers. This reflects retail concentration in short-dated, high-gamma contracts that generate outsized market-maker profits.
Jane Street explicitly noted in disclosures: “Options play a large role in our risk management…we use options to hedge firmwide tail risk and manage idiosyncratic exposures across trading strategies.”
Competitive Landscape
The market-making oligopoly has consolidated:
2024 Trading Revenue Rankings:
Jane Street: $20.5B
Citadel Securities: $9.7B
Optiver: €3.5B (~$3.8B USD) (Optiver)
Virtu Financial: $2.9B
Flow Traders: €468M (~$530M USD)
Jane Street and Citadel Securities combined control >50% of captured market-making revenue in the quantitative trading ecosystem. This concentration creates network effects — more flow begets better pricing data, which attracts more flow.
During Virtu’s earnings call, CEO Douglas Cifu characterized the competitive dynamic as “frenemies,” noting Citadel and Jane Street operate white-label RFQ products that partner banks repackage for clients (Global Trading, Apr 2025).
The Strategic Implication
Market-making in derivatives is not simply “more profitable” — it represents a fundamentally different business model:
Hedge Funds:
Fee revenue: 2% management + 20% performance
Capital requirement: High (must deploy LP capital)
Revenue ceiling: Constrained by capacity and alpha decay
Business risk: Client redemptions, performance-dependent income
Market-Makers:
Fee revenue: Bid-ask spread + PFOF + rebates
Capital requirement: Lower (proprietary capital, no LP obligations)
Revenue ceiling: Scales with market volume (theoretically unlimited)
Business risk: Regulatory (PFOF bans), technology arms race
The structural advantage is embedded in revenue predictability. Citadel Securities generated record revenue in 2024 (+55%), while the S&P 500 also surged 23% — but market-makers profit in both rising and falling markets, whereas directional strategies show asymmetric performance.
Key Takeaway
Derivatives market-making generates structurally superior revenue through volume-scaled bid-ask capture, payment for order flow, exchange rebates, and information advantages — all while maintaining near-zero net directional exposure.
Directional derivatives trading requires capital allocation, assumes correlation risk, and faces hard capacity constraints tied to alpha generation.
Jane Street’s $20.5B revenue on 2,960 employees ($6.93M per capita) versus Millennium’s $10.8B gross returns on $72.1B AUM ($150K per million AUM) quantifies the gap. The business model difference is not marginal — it’s foundational.
Sources
Note on Calculations: Revenue per employee figures calculated using reported year-end 2024 headcount. Jane Street: $20.5B ÷ 2,960 employees = $6.93M per capita. Currency conversions use approximate 2024 average EUR/USD rates (~1.08).
Primary Financial Data:
Bloomberg — Jane Street $20.5B Revenue (Apr 2025): https://www.bloomberg.com/news/articles/2025-04-23/jane-street-s-20-5-billion-trading-haul-tops-citigroup-bofa
Bloomberg — Citadel Securities $9.7B Revenue (Mar 2025): https://www.bloomberg.com/news/articles/2025-03-06/citadel-securities-9-7-billion-trading-revenue-passes-barclays
CNBC — Citadel Hedge Fund 15.1% Return (Jan 2025): https://www.cnbc.com/2025/01/02/ken-griffins-flagship-hedge-fund-at-citadel-climbs-15point1percent-in-2024.html
Reuters — Hedge Fund Returns 2024 (Jan 2025): https://www.reuters.com/markets/hedge-funds-deliver-double-digit-returns-2024-2025-01-02/
Hedgeweek — Millennium 15% 2024 Performance (Jan 2025): https://www.hedgeweek.com/millennium-posts-15-2024-gain-but-lags-sp-500/
Market Structure & Trading Data:
Global Trading — Jane Street Market Share Data (Apr 2025): https://www.globaltrading.net/jane-street-took-10-of-of-us-equity-market-in-2024/
Global Trading — Payment for Order Flow Record (Jun 2025): https://www.globaltrading.net/payment-for-us-retail-flow-reaches-record-high-led-by-citadel-securities-imc/
Bloomberg — Jane Street Q3 2024 Revenue (Dec 2024): https://www.bloomberg.com/news/articles/2024-12-02/jane-street-reaps-14-2-billion-in-first-nine-months-of-trading
Hedgeweek — Citadel Securities Q1 2025 Results (May 2025): https://www.hedgeweek.com/citadel-securities-smashes-q1-records-with-3-4bn-in-trading-revenue/
Hedgeweek — Citadel Securities 2024 Annual Results (Mar 2025): https://www.hedgeweek.com/griffins-citadel-securities-reports-record-9-7bn-trading-revenue/
Bloomberg — Citadel Securities & Jane Street H1 2024 (Sep 2024): https://www.bloomberg.com/news/articles/2024-09-03/citadel-securities-jane-street-on-track-for-record-revenue-haul
Bloomberg — Citadel Securities Q1 2025 Detailed (May 2025): https://www.bloomberg.com/news/articles/2025-05-27/citadel-securities-mints-3-4-billion-in-record-first-quarter
Optiver — 2024 Financial Results: https://optiver.com/optiver-reports-strong-financial-results-for-2024/
Alternative Sources (Same Data Points):
LiveMint — Citadel Securities 2024 Revenue: https://www.livemint.com/companies/news/citadel-securities-9-7-billion-trading-revenue-passes-barclays-11741289223586.html
eFinancialCareers — Jane Street Headcount Data: https://www.efinancialcareers.com/news/jane-street-s-rush-of-recruiter-hiring-suggests-headcount-will-follow-revenues
📊 Support this research: https://www.patreon.com/c/NavnoorBawa
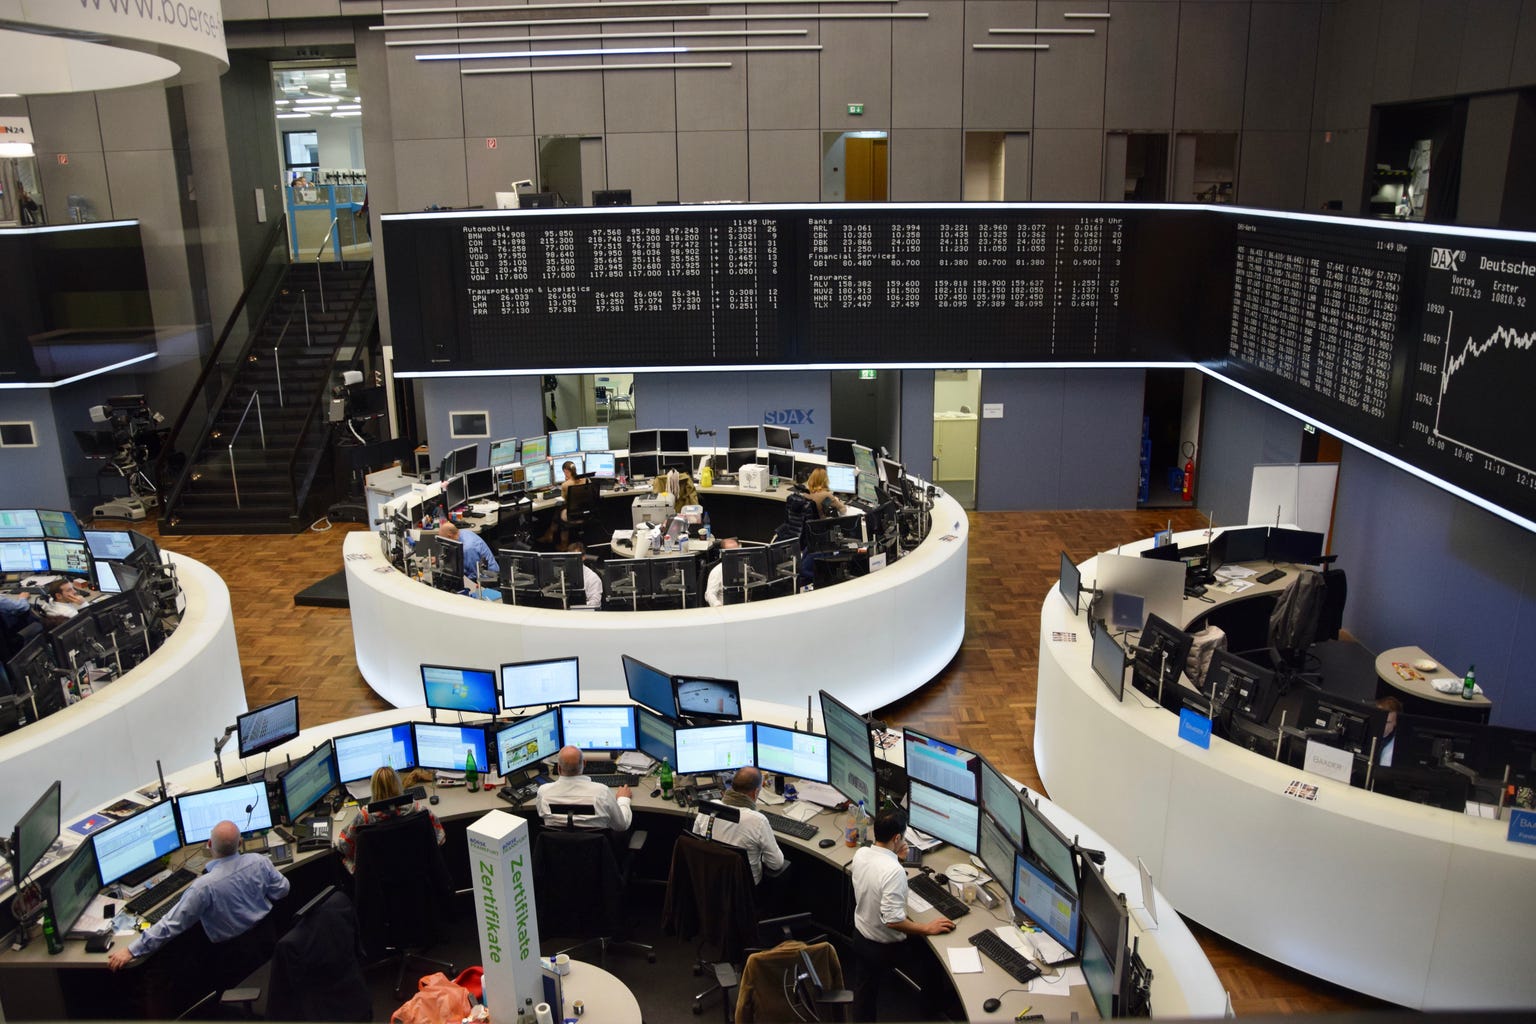
Cover photograph: Ank Kumar, CC BY-SA 4.0, via Wikimedia Commons.
Phenomenal breakdown of the structural asymmetry. The comparison betwen Jane Street's $6.93M revenue per employee and the capacity constraints multi-strat funds face really drives home how different these models are. What stood out is the options explosion detail, especially how Robinhood's 0.65 cents per share on 80% options-driven PFOF feeds directlyinto that high-gamma, short-dated flow that market makers print from. This isnt just higher margins, its fundamentally diffrent risk topology.