Man Group’s own framing of its first half of 2026 is a diversification story, and at the firm level the framing holds up on the numbers. Robyn Grew told shareholders that “the exceptional net inflows and record AUM we are reporting today are the direct result of deliberate, multi-year investments in the diversification of our business.” AUM hit an all-time high of $253.6 billion, up from $227.6 billion at the end of 2025 — driven by $19.8 billion of investment performance and $7.1 billion of net inflows, which together with a small negative FX/other adjustment reconcile the full move (227.6 + 7.1 + 19.8 − 0.9 = 253.6). Net inflows ran 3.4 percentage points ahead of the industry — Man Group’s own asset-weighted calculation against HFR/Morningstar/Citi data, which by its own footnote excludes several AUM categories (infrastructure managed accounts, real estate, US private credit, CLOs), not an independently audited industry statistic. Flows were spread across long-only credit ($4.8bn), long-only equity ($1.5bn), private markets ($0.7bn) and liquid alternatives ($0.1bn). Bloomberg’s coverage led with the record-AUM framing, and the market agreed: shares rose 5.7% to 317 pence on the results.
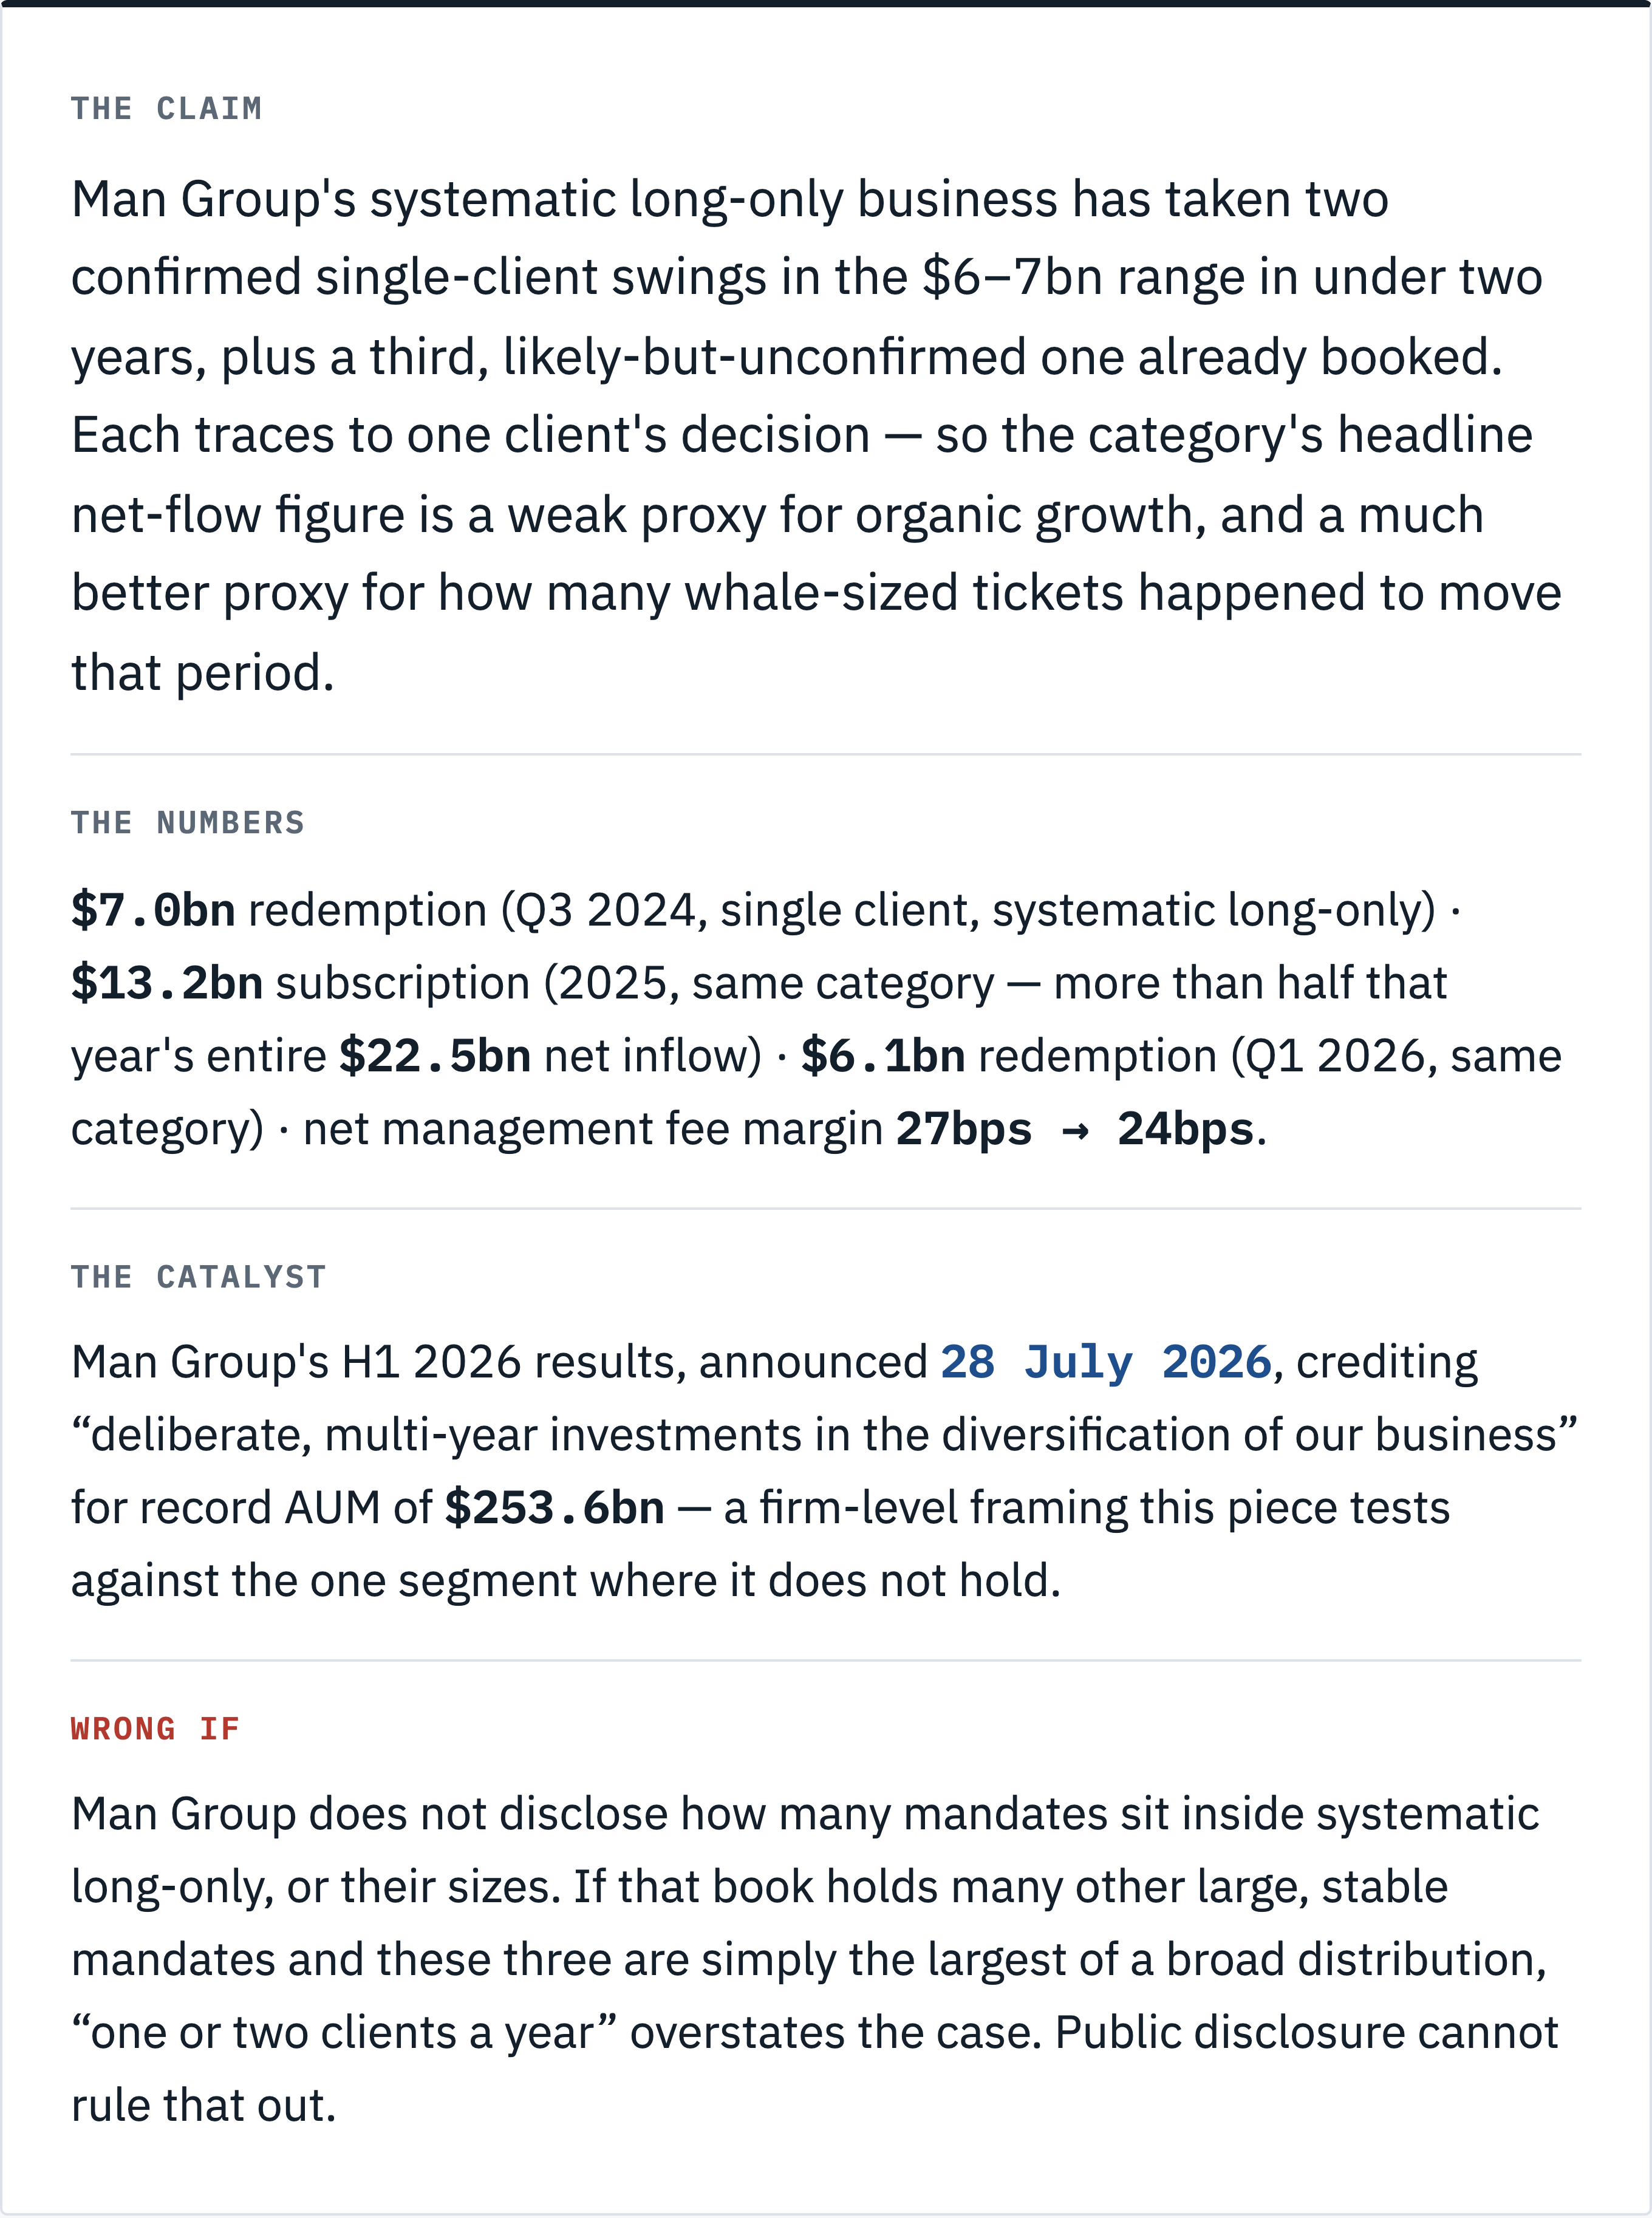
A sophisticated reader already knows large multi-strategy managers diversify across products; that fact alone isn’t the article. The specific, testable claim underneath it is narrower: one of those product lines — systematic long-only, the quantitative equity business run through Man Numeric — has a net-flow number that has been dominated by single institutional decisions for three consecutive reporting periods, in both directions, and that changes what the category’s headline growth or contraction figure actually tells an outside reader.

The three-period pattern, with the primary numbers
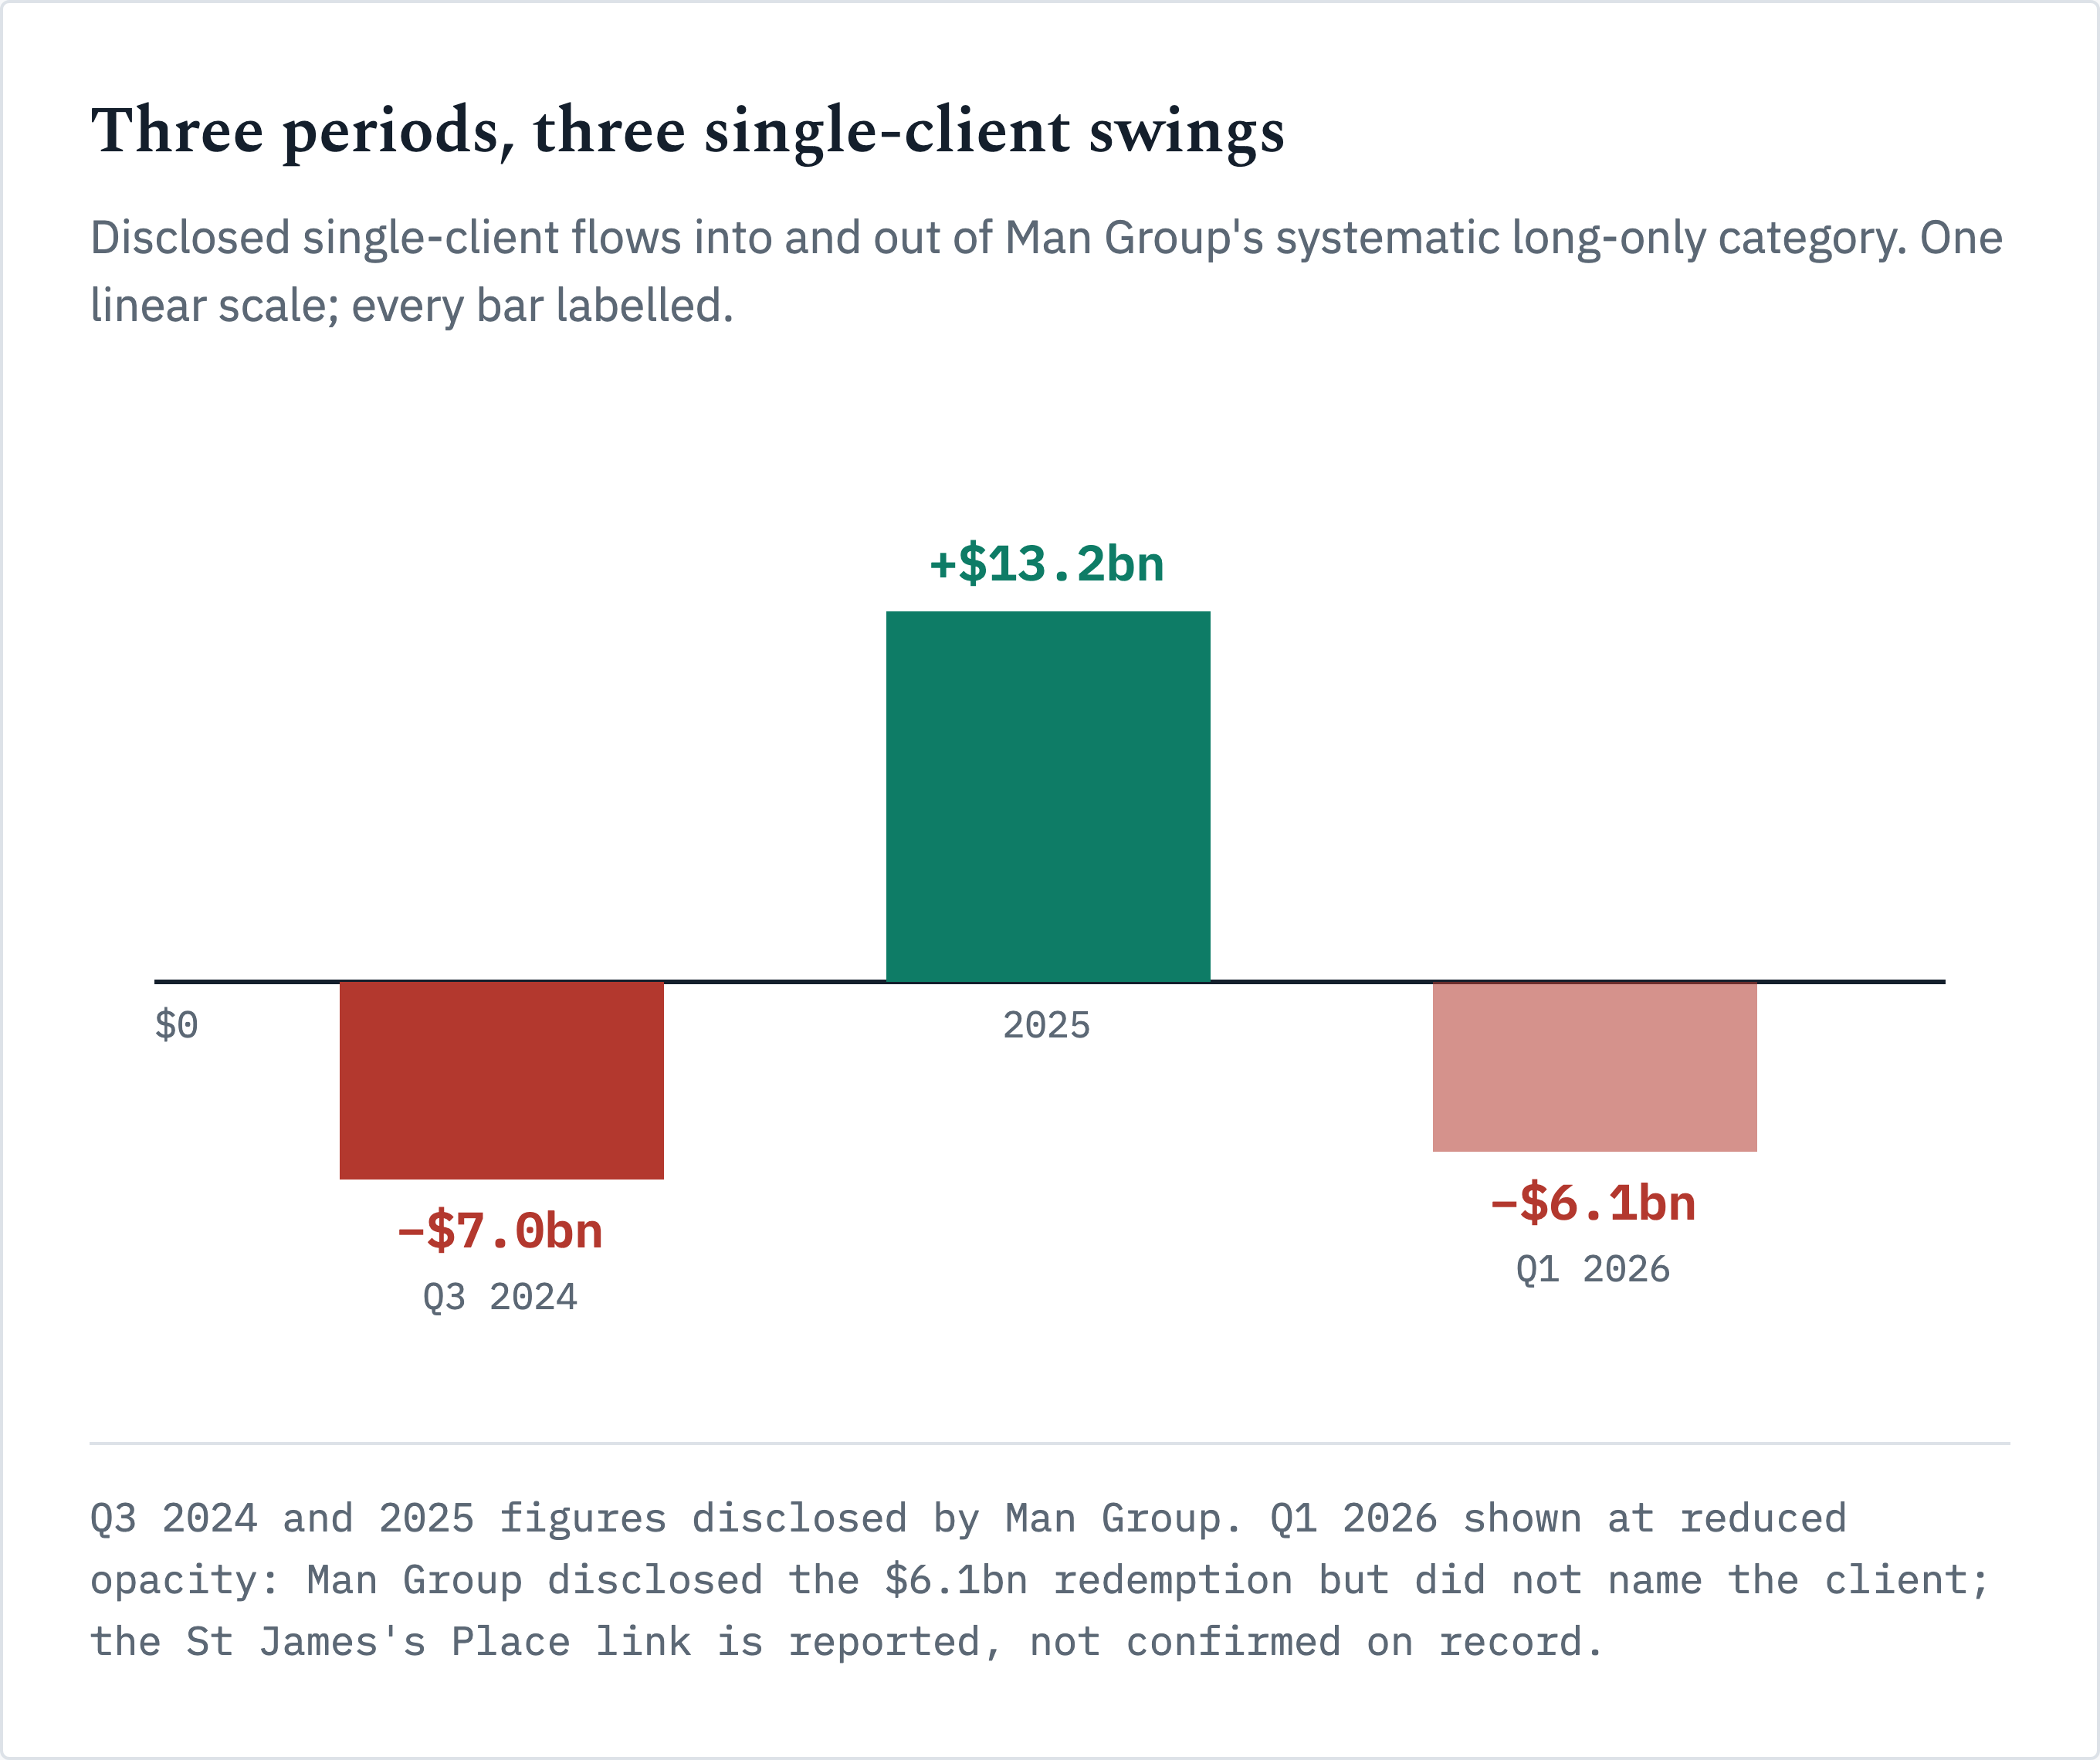
Q3 2024 (outflow): Man Group disclosed in its Q3 2024 trading statement that a single client’s full exit from systematic long-only — first flagged with the H1 2024 results, executed months later — had grown to $7.0 billion by the time it actually redeemed, “owing to positive investment performance” in the interim. Man Group’s FY2024 results name the reason directly: “a strategic decision to switch their entire equities allocation to a passively managed portfolio” — not a verdict on Man Numeric’s process. The same filing states the mandate carried a net management fee margin of just 21 basis points, “driven by” that low-fee structure, and that it therefore had minimal impact on the firm’s profits. Systematic long-only AUM fell from $41.2bn (30 June 2024) to $37.1bn (30 September 2024) that same quarter — a $4.1bn net decline against a $7.0bn single redemption, meaning other flows or performance within the book that quarter must have partly offset it; Man Group’s disclosures don’t break that out further, so the precise offset isn’t verifiable from public data. For the full year, the category posted net outflows of $4.9 billion overall — one client’s decision moved the entire period’s category number from what would otherwise have been a modest net position to a clearly negative one.
2025 (inflow): The mirror image. Man Group’s FY2025 results reported systematic long-only net inflows of $22.5 billion for the year — and more than half of that, $13.2 billion, was a single client subscription. The category’s own net management fee margin fell from 27bps to 24bps in the same period; Man Group attributes the move to “large inflows at a lower margin” generally, and given the $13.2bn ticket alone accounted for 59% of the year’s net inflow, it is a reasonable inference — not a company-stated attribution to that one client specifically — that this subscription did most of the work. Either way, this is priced, commoditized, institutional-scale capital, not a diversified base of smaller subscriptions building organically.
Q1 2026 (outflow again): A $6.1 billion single-client redemption from “one of its long-only investment strategies” appeared in Man Group’s Q1 2026 trading statement — Man Group’s own disclosure does not name the client, and confirmed it “declined to comment” further. Separately, and in the same quarter, St James’s Place announced it was overhauling its £13 billion Global Equity fund, replacing its three managers — Los Angeles Capital Management, Man Numeric, and State Street Global Advisors, installed under a 2022 restructuring of the fund — with a single new adviser, Acadian Asset Management, specifically to cut the fund’s carbon intensity. Multiple outlets have reported the two events as connected, and the rough magnitude fits (SJP’s exit is described as “more than £4 billion,” which converts to roughly $5.3-5.7bn at prevailing rates — in the neighborhood of Man Group’s $6.1bn but not an exact match) — but no source directly confirms the link with an on-record attribution from either company. Treated here as the likely but not certified explanation. If accurate, it is, like the other two, not a performance judgment on Man Numeric — an ESG-positioning decision made on SJP’s own flagship retail product, in which Man Numeric was only one of three named managers.
Three periods, three single-client-sized swings, at most one tentatively identified client (and that one unconfirmed), three stated or inferred reasons (a shift to passive, an unnamed subscription, a carbon-intensity-driven adviser consolidation). None had anything to do with whether Man Numeric’s factor models were working.