



This is a detailed research piece. If you find value in institutional-quality hedge fund analysis, support this work on Patreon.
CRITICAL CLARIFICATION
This article explains gamma scalping mechanics. Universa Investments’ 3,612% March 2020 return came from static tail protection, not gamma scalping. These are fundamentally different strategies with distinct P&L drivers. Conflating them is a common error in hedge fund analysis.
Key Definitions
Implied Volatility (IV): Forward-looking volatility embedded in option premiums
Realized Volatility (RV): Historical standard deviation of log returns
Gamma (Γ): Second derivative of option value with respect to underlying price
Theta (Θ): Time decay; daily cost of holding long options
Volatility Risk Premium (VRP): Persistent IV-RV spread averaging 4–5 percentage points (Eraker, NYU Stern)
PART 1: Gamma Scalping Mechanics
Profitability Condition
σ_realized > σ_implied + transaction costs + theta decay
March 2020: Markets priced pre-crisis vol at 15–20% annualized. Realized vol spiked past 80% (CBOE VIX data). This creates gamma scalping opportunity.
Trade Structure
Purchase ATM straddles/strangles on liquid indices:
Long gamma (Γ > 0): Delta changes enable profitable rehedging
Long vega (ν > 0): Direct IV exposure
Negative theta (Θ < 0): Time decay requiring offset
Position starts delta-neutral (Δ ≈ 0), requires continuous rebalancing. Dynamic hedging generates P&L.
P&L Equation
Gamma P&L = ½ × Γ × S² × (σ²_realized − σ²_implied) × Δt
Where:
Γ = gamma exposure
S = underlying price
σ_realized = actual volatility
σ_implied = paid premium volatility
Δt = time increment
Execution:
Underlying rises → sell at high to delta-hedge
Underlying falls → buy at low to delta-hedge
Net: Systematic “buy low, sell high”
Example: $100k ATM straddle, 30% IV, 7 DTE incurs ~$300–400/day theta. If underlying moves ±2% intraday (~45% annualized RV), gamma scalping captures ~$500–800/day through rehedges, offsetting theta.
Optimal Execution Windows
Time to expiry: 2–10 days for ATM options
Beyond 10 days: Gamma too low relative to theta
Inside 48 hours: Pin risk dominates
Failure modes:
IV rank >80th percentile: Theta costs insurmountable
Trending markets: One-directional moves limit rehedges
Transaction costs: High-frequency rebalancing erodes edge
VRP averages −4.5pp, creating structural headwind. Entry timing critical: buy gamma when IV rank <40th percentile.
Path Dependency
⚠️ Applies ONLY to gamma scalping with continuous rehedging. Does NOT apply to static tail protection strategies like Universa’s, where P&L depends only on terminal payoff, not path taken.
Same 20% realized vol, different paths:
Path A: +10% move, stays → 1 rehedge
Path B: +10%, −10%, +10%, −10% → 4 rehedges
Path B generates 4× P&L despite identical vol. ∫ Γ(S_t) dS depends on path, not endpoints. More zero-crossings near ATM = more gamma capture.
PART 2: Static Tail Protection (Universa’s Actual Strategy)
Critical Distinction
Universa does NOT gamma scalp. Their March 2020 returns came from static convexity arbitrage.
Market maker confirmation (senior derivatives trader):
“I sell it to them at $2 and buy it back one time at $45 (if it hits). I’ve also never known their flow to be dynamically hedged.”
This describes one transaction, not continuous rehedging.
What Universa Actually Does
✅ Buy deep OTM put spreads (5–10% OTM, 60–180 DTE)
✅ Zero dynamic hedging — static hold until expiry or tail event
✅ Accept 1–2% annual portfolio drag from theta
✅ Roll forward as positions approach expiry
❌ NO continuous rehedging
❌ NO ATM options (2–10 DTE)
❌ NO path-dependent P&L
March 2020 Mechanism
Not gamma scalping: Single jump event drove returns
Pre-crisis: Deep OTM puts at ~$2
Crash: S&P gaps down 12% over days
Puts spike to ~$45 (20–25× return)
One liquidation event, not accumulated rehedging profits
Markets systematically underprice tail risk. $2 option implied far lower crash probability than materialized. Strategy profits from convexity mispricing, not RV vs. IV spread.
Portfolio Impact
Allocation: 3.33% to tail hedge
March 2020 hedge return: +3,612% on invested capital
Portfolio contribution: ~+12.7%
S&P 500: −12.4%
Long-term (March 2008–March 2020):
11.5% CAGR vs. 7.9% unhedged S&P 500 (Institutional Investor report)
Cost: 1–2% annual drag, offset by 2008 and 2020 crisis gains.
Key insight: Maintained structural static exposure through years of negative carry for single 30–50× payoff.
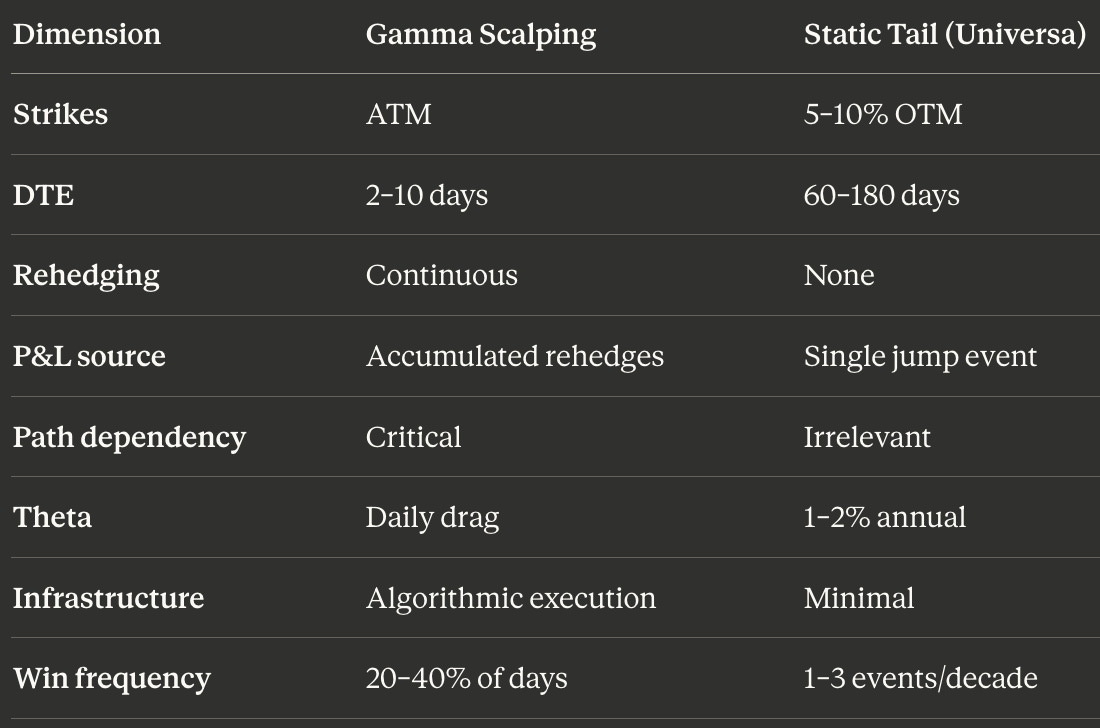
Strategy Comparison Matrix
Institutional Implementation
Gamma Scalping
Instruments: Variance swaps eliminate path dependency but add counterparty risk. SPX options: deep liquidity, elevated premiums.
Rehedging frequency: Daily captures vol premium while limiting transaction costs. Intraday requires algorithmic infrastructure.
Sizing: 2–5% AUM for active strategies.
Static Tail Protection
Strike selection: Focus on “fear corridor” where institutional panic amplifies moves.
Roll management: Roll at 30–60 DTE to maintain continuous exposure.
Sizing: 3–5% AUM, designed to offset 50–100% of equity drawdowns.
The Volatility Risk Premium Anomaly
Structural headwind for long vol:
VIX-implied vol: ~19% annualized
S&P realized vol: ~14–15% annualized
VRP: ~4–5pp systematic spread (Eraker 2007)
Exploitable inversions:
Crisis events: RV spikes above IV
Volatility clustering: Sustained elevated RV
Market complacency: IV compressed vs. historical norms
August 2024 validation: VIX 23→65 intraday as RV exceeded 30% annualized (BIS analysis)
Implementation Guidance
Choose Gamma Scalping When:
✅ Algorithmic execution infrastructure available
✅ Transaction costs <$0.05/contract
✅ Intraday monitoring capability
✅ Edge in vol forecasting (RV > IV prediction)
Choose Static Tail Protection When:
✅ Long-only equity allocation seeking crash insurance
✅ Tolerance for 1–2% annual drag
✅ “Set and forget” preference
✅ Multi-year investment horizon
Key Takeaways
Gamma scalping profits from continuous rebalancing when markets oscillate more than implied. Requires:
Entry at IV rank <40th percentile
2–3% allocation
Acceptance of 60–80% losing days
Infrastructure for frequent rehedging
Static tail protection (Universa) profits from rare catastrophic events through structural positioning. Requires:
Structural exposure to deep OTM puts
1–2% annual carry cost acceptance
Multi-year conviction
Discipline through extended bleed periods
Both strategies use long options. Execution and P&L mechanics are completely different. Conflating them leads to incorrect risk models, wrong position sizing, and failed implementations.
Verified Sources
Market Data:
CBOE VIX Historical Data — Official March 2020 volatility documentation
Bloomberg Universa Coverage — Verified March 2020 performance
BIS August 2024 VIX Analysis — Bank for International Settlements volatility spike analysis
Academic Research:
Eraker: The Volatility Premium (NYU Stern) — Empirical VRP documentation
Panoptic: Gamma Scalping Mechanics — Technical breakdown
Institutional Research:
Institutional Investor: Universa Performance — CAGR and allocation analysis
Charles Schwab: Options Gamma Guide — Professional execution frameworks
Meketa: Long Volatility Strategies — October 2024 institutional primer
Supporting Analysis:
Advisor Perspectives: Tail Risk Validation — Backtested validation
SSRN: Volatility Risk Premium Studies — Academic framework
Technical Note: Mathematical formulations verified against academic options pricing literature. Performance figures cross-referenced with primary sources (investor letters, regulatory filings, institutional research). Market data current as of January 2026.
📊 Support this research: https://www.patreon.com/c/NavnoorBawa
Cover photograph: Victorgrigas, CC BY 2.0, via Wikimedia Commons.