



In quantitative finance, February 29th is not a calendar curiosity. It is a tradable basis point discontinuity. When a year has 366 days, financial systems calibrated to 360 or 365 days misprice interest accrual, year-over-year comparisons, and volatility decay. Sophisticated arbitrage desks see what casual observers miss: a denominator error embedded in the plumbing of global markets.
This article dissects three distinct alpha sources created by that error: one in fixed income, one in equities, and one in options. Each is supported by ISDA definitions, corporate earnings disclosures, or derivatives pricing conventions. Each traces back to the same root cause: a denominator that does not know the year has 366 days.
1. Fixed Income: Day-Count Basis Arbitrage
The most structural alpha sits in the mismatch between day-count conventions used across fixed income instruments. This is not theoretical. It is a function of legal definitions codified by the International Swaps and Derivatives Association (ISDA) in Section 4.16 of the 2006 Definitions.
The Mechanism
Financial instruments accrue interest using specific day-count conventions, and those conventions disagree on how to handle a leap year. The critical distinction lies between two families:
Actual/Actual (ISDA), used by U.S. Treasuries and most rigorous derivatives, adjusts the denominator to 366 in a leap year. Each calendar day is worth precisely 1/366th of the annual coupon. The ISDA’s EMU and Market Conventions memo confirms that under this approach, the denominator is 366 for calculation periods falling within a leap year.
Actual/360 and 30/360, used by many corporate bonds, commercial loans, and legacy swap legs, keep the denominator fixed regardless of the calendar. The Actual/360 convention divides actual days elapsed by a denominator that never changes from 360, meaning the borrower pays interest on all 366 days against a 360-day base. As Wikipedia’s day-count convention entry documents, this effectively means the borrower is paying interest for 5 or 6 additional days a year.
The Trade
In a leap year, a floating leg paying Actual/360 accrues interest on the 366th day using a 360-day divisor. The counterparty on an Actual/Actual leg sees its daily accrual diluted to 1/366th. This asymmetry creates a predictable widening in the basis between instruments priced on different conventions.
Quantifying this: an academic paper by the Securities Litigation and Consulting Group (SLCG, 2012) found that on a $10 million notional interest rate swap, switching between day-count conventions produced upfront value differences of approximately 8 to 27 basis points, with one representative example yielding roughly 18 basis points (approximately $17,960). The authors concluded that a fairly priced interest rate swap using one convention is almost certainly mispriced using another convention. In a leap year, this structural wedge widens further because the 366th day amplifies the numerator mismatch.
Key insight: This is not a model assumption. It is a legal fact. ISDA Section 4.16 of the 2006 Definitions codifies at least six distinct day-count methods, each producing a different accrual on the same notional. The alpha is in knowing which instruments sit on which side of the denominator.
2. Equities: The 100-Basis-Point Revenue Trap
In equities, the denominator error is not in a day-count fraction but in the base period used for year-over-year revenue growth. When a leap year adds a 91st day to a fiscal quarter, sell-side analysts comparing that quarter against a normal 90-day base are working with an inflated numerator. And when the following year’s 90-day quarter is measured against that inflated base, the denominator of the growth calculation is artificially high. The result: a mechanical headwind that consensus models routinely fail to isolate.
The Long Trade: Leap Year Quarter
For high-volume retailers operating physical stores every day, one extra selling day adds approximately 100 basis points (roughly 1/91st of a quarter) to reported revenue. This incremental capacity flows straight into the top line.
Walmart confirmed exactly this in its Q1 FY25 earnings (quarter ended April 30, 2024). The official earnings release (PDF) and CNBC reported that Walmart’s 6% year-over-year revenue growth includes a benefit of roughly 1% from an additional selling day in the period. Talk Business & Politics corroborated this, noting a 1% gain from the additional selling day from Leap Year.
In the same period, Costco reported (investor relations, SEC filing) net sales of $18.21 billion for its four-week February reporting month (ended March 3, 2024), up 6.9% year-over-year. While Costco did not isolate the leap year contribution, the extra selling day mechanically added to what was already strong organic momentum.
The Short Trade: Lapping Year Headwind
The stronger play is the reverse: shorting retailers in Q1 of the year after a leap year. When a company reports a 90-day quarter that must compare against a 91-day base period, reported growth faces a mechanical headwind.
Walmart quantified this precisely. In its FY25 Q4 earnings call (February 20, 2025), the company guided for Q1 FY26 net sales growth of 3% to 4% but explicitly flagged a 100-basis-point headwind from the lapping leap year. For the full fiscal year, it guided a 20-basis-point headwind from the same effect. The accompanying earnings presentation further noted approximately 70 basis points of headwind to adjusted operating income growth from the lapping effect.
In May 2025, the lapping effect materialized exactly as predicted. The Walmart Q1 FY26 earnings release (PDF) and CNBC confirmed that Walmart’s Q1 FY26 revenue rose about 2.5% from $161.51 billion in the year-ago period, but had a 1% headwind from lapping leap day. Revenue missed consensus estimates for the first time since February 2020.
Key insight: This is a fully disclosed, company-confirmed effect. The trade is not about whether the calendar math is real. It is about whether sell-side consensus estimates properly adjust for it. When Walmart itself tells you the headwind is 100 basis points and the stock still misses, the market is telling you it underestimated a known variable.
3. Options: The Theta Decay Distortion
The third denominator error sits in the options market, specifically in how Black-Scholes models express time-to-expiry.
The Math
Option pricing models calculate Theta (time decay) as a function of T, the time remaining to expiration expressed as a fraction of a year. The standard Black-Scholes theta for a call option is:
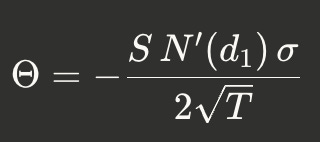
As Macroption’s Black-Scholes reference confirms, the standard practice is to calculate T as Days / 365. Some desks use 252 trading days instead. While ISDA-style contracts can explicitly specify Actual/Actual (which adjusts for leap years), many production pricing systems and vendor calculators default to a fixed 365, and practice varies by desk, instrument, and jurisdiction. Wikipedia’s Black-Scholes entry corroborates this, noting that theta is reported divided by 365 or 252.
The Distortion
In a leap year, a 1-year LEAP option actually has T = 366/366 = 1.0. But a system using the fixed 365 convention computes T = 366/365 = 1.00274, a mathematical impossibility for an instrument that expires in exactly one calendar year. This overstates the time remaining by (366–365)/365 = 0.274%, which in turn understates the daily theta decay rate by the same fraction.
For a single contract, 0.27% is noise. Across a book of thousands of options contracts, the systematic bias accumulates. Volatility arbitrage desks running delta-neutral positions face a subtle mismatch: variance swaps calculate realized variance using actual observation days with an annualization factor (typically A = 252 trading days), meaning their observation count naturally reflects the leap year calendar. If the hedging options leg uses a fixed 365-day denominator for T, the two legs of the trade are effectively operating on different calendars, creating a consistent bleed.
This edge is thinnest of the three strategies discussed here. It requires scale to monetize and is most relevant to market makers and large systematic vol desks rather than directional traders. But the principle is the same: when the denominator is wrong, the price is wrong.
Synthesis: The Edge Is in the Denominator
Leap year alpha is not about predicting direction. It is about correcting calendar math that financial infrastructure gets wrong by design.
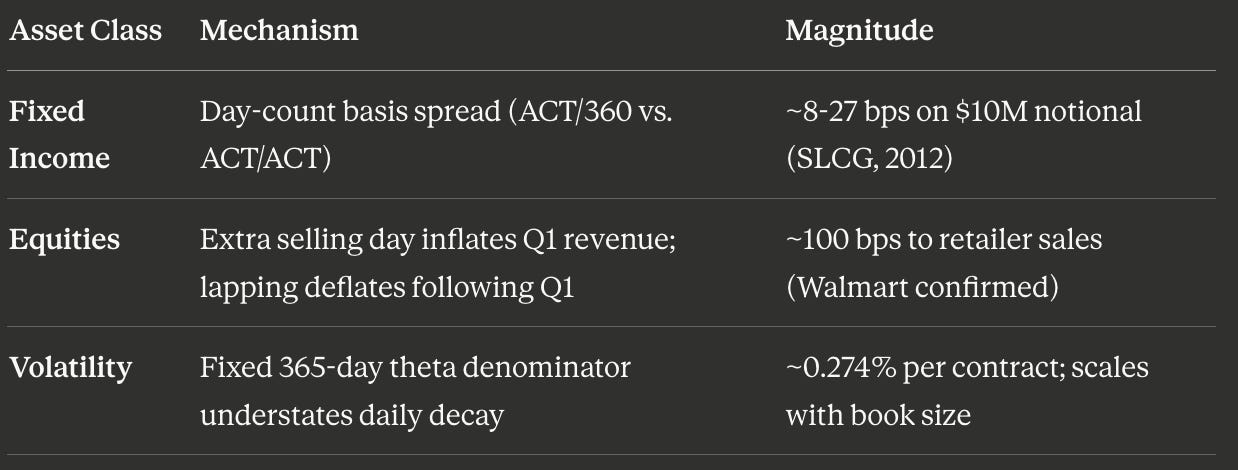
What makes this trade compelling is that each alpha source is independently verifiable. The fixed-income basis is embedded in ISDA legal definitions. The equity effect is explicitly confirmed in company earnings transcripts. The options distortion follows directly from how production pricing systems are built. None of these require a view on macro, sentiment, or direction. They require only that you read the denominator: 360 instead of 366 in rates, a 91-day base under a 90-day quarter in equities, 365 instead of 366 in options theta.
📊 Want Deeper Quantitative Analysis?
This research took extensive data collection, cross-referencing of primary sources, and independent verification across ISDA definitions, SEC filings, and derivatives pricing conventions. If you found value in this deep-dive, I publish exclusive quantitative research, trading strategies, and institutional-grade analysis on Patreon.
By joining, you’ll be supporting my work and motivating me to publish more content like this.
→ Join the Patreon community here
Disclaimer: This research is for educational purposes only and does not constitute investment advice. The strategies described reference historical structural inefficiencies that may or may not persist. Past performance does not guarantee future results.
About the Author: Navnoor Bawa is a quantitative researcher and content creator covering institutional trading strategies, derivatives pricing, and systematic alpha. Connect on LinkedIn or subscribe to The Mathematical Trader on YouTube for more quantitative finance content.
Cover photograph: Spiritia, CC BY-SA 4.0, via Wikimedia Commons.