


Most coverage of the Korean retail investor surge in 2025 stops at the spectacle. This piece goes further — tracing five distinct institutional strategies across primary sources: the KSD’s near-daily public order flow data, SEC 13F accumulation-and-exit cycles documented in IonQ, EMJ Capital’s manufactured retail momentum, the Roundhill MEME ETF’s date-certain arbitrage, and the 15-year contrarian signal hiding in Acadian’s Squid Game paper. Drawn from 13F filings, Goldman Sachs research, JPMorgan client notes, Bloomberg interviews, and investor letters.

The Setup: A Transparent Signal Hidden in Plain Sight
By the end of October 2025, South Korean retail investors held a record $170 billion in U.S. equities — nearly double their holdings at the start of the year, according to Korea Securities Depository data reported by the Financial Times. The FT’s own article subtitle confirms this framing: “Holdings of Wall Street equities nearly double this year as Korean investors hunt for higher returns abroad” (FT, Nov 12, 2025 — paywalled; subtitle verified via BizToc preview). The arithmetic is confirmed: Ginlix AI’s analysis of the same KSD data documents holdings at approximately $85 billion at the start of 2025, making the growth to $170 billion by October a genuine near-doubling. The Acadian paper’s separately cited $112.1B figure reflects end-of-December 2024, after the quantum computing frenzy had already inflated Korean retail holdings through that month — a different snapshot, not a contradiction. These were not passive index buyers. They were concentrating ferociously into leveraged ETFs, quantum computing plays, and heavily shorted micro-caps.
The framing that no other coverage landed in 2025 came from Owen Lamont, Senior Portfolio Manager at Acadian Asset Management, in his March 2025 research paper “The Squid Game Stock Market”:
“Smart investors know to ask, ‘who’s on the other side of the trade?’ If you’re shorting quantum computing stocks, who’s buying? If you’re starting a 3X leveraged ETF, who’s your target customer? If you’re a CEO trying to jumpstart your stock price by pivoting to bitcoin, who will that attract? The answer in all cases: Korean retail investors.”
Why was this observation tradeable? Because, unlike U.S. retail flows — which require indirect inference from broker-reported data — Korean retail positions are disclosed near-daily through the Korea Securities Depository’s public SEIBro portal. Any fund with a data subscription could watch aggregate Korean net buying in specific U.S. names in near-real time. This transparency, combined with the predictability of Korean retail behavior, is what created the structural edge. What follows is the documented record of how that edge was exploited — across five distinct institutional strategies.
🎬 Prefer to watch? This article was turned into a video overview by NotebookLM. If you would rather absorb this research in 9 minutes than read it, start here: ▶ Watch: The Squid Game Signals — Video Overview Then come back for the full documented breakdown below.
The Quantitative Proof: $12M Float, $111M Korean Buys, +1,400% Return
The most important data point in understanding the 2025 hedge fund opportunity is buried in Lamont’s Figure 1, which maps Korean retail net buying against stock returns for seven U.S.-listed quantum computing names during December 2024.
The outlier: a stock with a market cap of approximately $12 million as of November 2024 received $111 million in Korean retail net buys during December 2024 and finished the month up approximately 1,400%. As Lamont writes: “That looks like market impact to me.”
A 10:1 ratio of Korean buying pressure to pre-existing float is not price discovery — it is mechanical, demand-driven repricing by a single identifiable cohort visible in advance through public data. Any institution that monitored KSD flows and pre-positioned in that stock — even five business days before the buying peak — captured the core of a 1,400% move.
That December 2024 case was not an isolated event but the proof-of-concept for an environment that would run throughout 2025. Two macro indicators confirmed the institutional window was open for months: Goldman Sachs’ Speculative Trading Indicator spiked in July 2025 to its highest level since around 2021, per Goldman’s research note, and Goldman’s basket of most-shorted names rose 60% since April 2025 versus 28% for the S&P 500 over the same period. This macro environment told institutions that the runway for Korean retail-driven momentum was long — and the five strategies below show exactly how they used it.
The IonQ Institutional Cycle: Buy Into the Wave, Sell Into the Offering
IonQ (IONQ) is the best-documented large-scale institutional trade of the 2025 Korean retail surge. By October 2025, the FT reported that South Korean retail investors owned a combined $4.4 billion of IonQ’s $20 billion in total shares — roughly 22% of market cap. The stock had surged approximately 370% from March to its October high. (These figures derive from the paywalled FT article; the Acadian paper independently confirms Korean retail owning 31% of one quantum stock’s float and 17% of another as of late February 2025, corroborating the scale of concentration.)
The 13F data tells the institutional side of that trade with precision. According to DCF Modeling’s analysis of SEC Form 13F filings and Motley Fool’s November 2025 breakdown, in Q3 2025 — exactly the period of peak Korean retail accumulation:
Total shares held by 13F filers rose 27.4% quarter-over-quarter to 169.9 million shares
454 institutional investors added to IonQ positions, more than double the 163 that reduced stakes
Renaissance Technologies increased its IonQ stake by 404.7%, adding 4,073,300 shares
Morgan Stanley added 6,056,793 shares (+29.9%), worth approximately $372 million
BlackRock added 4,225,572 shares (+23.1%), worth approximately $260 million
Then in Q4 2025, Quiver Quantitative’s 13F aggregation shows the institutional reversal:
Renaissance Technologies removed its entire IonQ position — 5,079,700 shares (-100%), valued at approximately $227.9 million
Morgan Stanley reduced by 6,773,950 shares (-25.7%), valued at ~$303.9 million
D.E. Shaw reduced by 4,568,803 shares (-83.9%), valued at ~$205 million
The sequence is unambiguous: accumulate during Korean retail inflows → distribute when the wave peaks. Motley Fool’s February 2026 analysis notes that the Q4 distribution coincided with IonQ completing a $2 billion equity offering in October 2025 that structurally diluted existing shareholders — providing institutions a natural exit event at peak retail enthusiasm.
The EMJ Capital Trade: How a $10M Fund Manufactured the Attention It Needed
The IonQ cycle shows Strategy One: passive accumulation into a known retail inflow, then distribution at peak. Strategy Two is more audacious — manufacturing the retail flow itself.
Bloomberg reported on July 25, 2025 that Eric Jackson’s EMJ Capital had bought Opendoor Technologies (OPEN) shares at approximately $0.70 and watched them surge over 250% within weeks. On his X account on August 22, 2025, Jackson posted directly: “On June 25th, $OPEN was 51 cents. Today, Aug 22nd, it’s $5.10 after hours. A 10x in less than 2 months.”
Jackson gave his full entry logic in a Yahoo Finance live interview on July 24, 2025: he entered under $1 expecting the company to reach EBI profitability, and explicitly drew a parallel to his Carvana trade. Sherwood News documented Jackson’s stated bullish thesis on Carvana: that in June 2023, when Carvana had fallen from a peak of $377 to trade at approximately $25, he began advocating for the stock publicly — and after it rebounded above $350, the market began treating him as a credible contrarian caller. On Jackson’s own X account, he has documented the specific entry details of that trade; the stock later reached $413. After Jackson’s July 14 X thread announcing his OPEN position, call option volumes in OPEN hit 623,618 contracts in a single session against a 20-day average of under 35,000.
The retail amplification was then activated deliberately. Starting August 1, Jackson filmed videos outside Drake’s Toronto mansion urging the rapper to buy OPEN, a campaign he described at New York City’s Independent Investor Summit as a strategy to “bring attention to the masses.” Bloomberg ran the headline: “Hedge-Fund Guy lurks around Drake’s house trying to pump a stock” — documented in full by Disruption Banking.
On Bloomberg TV on August 21, 2025, Jackson was on record saying the stock was up 575% since July 1 and he had not sold: “If they put some effort into this, this could be a $500 stock.”
Matt Levine’s Bloomberg Opinion column from August 28, 2025 — republished in full by Securities Docket — identified the EMJ model explicitly as a third form of hedge fund management: beyond predicting which stocks will become meme stocks, a fund manager can “buy stocks and try to make them meme stocks.” Levine concluded: “Eventually Citadel is going to hire someone to do this sort of thing.”
The MEME ETF Arbitrage: Trading the Known Date-Certain Catalyst
Strategy Three removes even the need to manufacture momentum — it trades a publicly announced, date-certain mechanical catalyst instead.
The Roundhill Meme Stock ETF (MEME) relaunched on October 8, 2025, as Fox Business reported — Roundhill had previously shut the product down due to lack of interest and reopened it as speculative trading revived. Its design — actively managed to capture meme momentum, rotating into heavily shorted and widely discussed names — created a predictable institutional opportunity: stocks with high implied volatility, high short interest, and elevated social sentiment would be pulled into the ETF via mandatory buy-side flows on a known, recurring schedule.
Beyond Meat (BYND) was the execution-level proof. CNBC’s October 21 coverage reported short interest at over 63% of tradeable float per FactSet — a mechanically coiled squeeze setup. The stock was near an all-time low of approximately $0.50 before the ETF’s relaunch.
The cascade: CNBC confirmed a 127% closing gain on October 20, 2025 — the largest single-day gain in the company’s history — then a further 146% on October 21 as Walmart announced expanded distribution. (Note: some outlets reported an intraday figure of 75% earlier in the session on October 20; the official closing change was 127%, per CNBC, Benzinga, and GuruFocus.) The FT confirmed that South Korean retail investors purchased $239.2 million of BYND shares during October — amplifying the ETF-driven mandatory buying.
An institution that pre-positioned in BYND before October 8 — by screening the same public implied volatility data the MEME ETF uses — bought into a 63% short float at an all-time low and distributed into mandatory ETF rebalancing flows plus Korean and retail momentum. The collapse that followed served as the distribution event for those who understood the cycle from entry. Those who did not understand the cycle — who carried naked short positions through the same Korean retail-amplified wave — faced a different outcome entirely.
Goldman’s Scoreboard: $2.5 Billion in Documented Short Seller Losses
For hedge funds running naked short books in Korean retail targets, the losses were precisely documented. Bloomberg reported that short sellers racked up $2.5 billion in losses on the riskiest U.S. stocks in July 2025 alone.
The Accelerate Financial monthly investor letter from August 16, 2025 — one of the most specific public documents quantifying the damage — broke it down: Goldman’s Most Shorted basket surged 9.4% in July, while the long-short hedge fund proxy (Goldman VIP basket minus Goldman Most Shorted basket) fell -7.4% — a 16.8 percentage-point spread in a single month against short-heavy strategies. The letter reported Goldman’s Speculative Trading Indicator at the 88th percentile relative to data going back to 1990, Goldman’s retail favorites basket up 50% since April, and call option activity at its highest level since 2021.
Funds that were long Goldman’s Most Shorted basket constituents captured 9.4% in a month. Funds maintaining naked shorts in the same names lost $2.5 billion. Goldman’s research made the damage legible in aggregate — but by September 2025, JPMorgan had gone a step further, converting the same pattern of overlapping retail inflows and short concentration into a forward-looking institutional watchlist for identifying the next cohort of squeeze candidates before they moved.
JPMorgan’s Setup Map: Four Names, Two Sides
JPMorgan’s client note from September 11, 2025, reported by CNBC, identified four stocks exhibiting the documented setup — high social media activity, high retail buying, and high hedge fund short concentration simultaneously: Hims & Hers Health, ImmunityBio, Rocket Companies, and SoundHound AI. The bank’s exact language: “We are flagging a few stocks that are heavily mentioned on Social Media and have high Retail buying as well as high Hedge fund Shorting. These stocks may experience unexpected flows in case of increased activity.”
This note functioned simultaneously as a warning to short sellers and a setup map for long-momentum players. Institutions that had consumed both Goldman’s basket data and JPMorgan’s watchlist had, by September 2025, a continuously refreshed list of names where Korean and retail accumulation was converging with high hedge fund short concentration — the exact preconditions that had preceded every major squeeze of the preceding 12 months.
For an institution that wanted to trade these setups — either long into the squeeze or short after the reversal — the unavoidable reference point was January 2021 and the fund that failed to survive that playbook without proper risk controls.
The 2021 Lesson Applied: Defined-Risk Shorts Replace Naked Exposure
Melvin Capital lost 53% of its portfolio in January 2021 and required a $2.75 billion emergency capital injection from Citadel ($2 billion) and Point72 ($750 million). The lesson: not that shorting meme stocks is impossible, but that naked short exposure in those names carried existential risk.
Barclays told clients in July 2025, per Bloomberg, that the meme wave had peaked and outlined the updated methodology: bear call spreads and protective puts, not naked shorts. This structure converts an unbounded-risk short squeeze into a defined, capped loss while preserving full participation in the reversal. Executed after measurable overextension signals — RSI divergence, volume decay with prices elevated, short interest dropping more than 15% — this approach captures the momentum reversal that always follows a Korean retail-driven spike without the catastrophic squeeze exposure that destroyed Melvin.
But the deeper question underlying all five of these strategies — passive cycling, manufactured momentum, ETF arbitrage, loss management, and defined-risk shorting — is why Korean retail flows are a reliable signal in the first place. The answer stretches back further than 2021, and it is hiding in plain sight in Lamont’s data.
The Historical Pattern: Korean Retail as 15-Year Contrarian Signal
The most underreported data in Lamont’s Squid Game paper is Table 1 — checking six major financial disasters between 2008 and 2023 against whether the relevant security appeared in Korean retail’s top-50 U.S. net buying list:
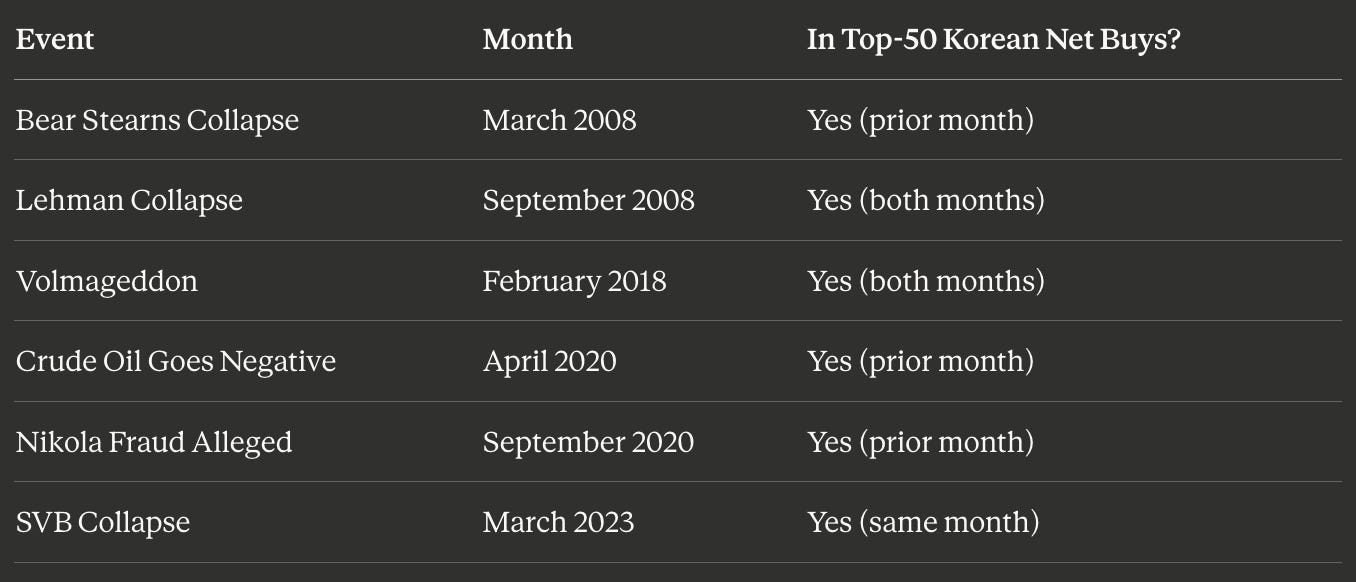
Source: Acadian Asset Management / Korea Securities Depository — Table 1 retrieved directly from the published paper.
Lamont is explicit this is not a rigorous statistical test. But the implication for systematic funds is significant: the publicly available KSD top-50 list has consistently preceded catastrophic drawdowns over 15 years. A fund systematically fading that list — even crudely — would have generated a meaningful contrarian signal across multiple market cycles.
That 15-year record is not a coincidence. It is a product of four structural features that made Korean retail flows uniquely predictable — and, in 2025, uniquely exploitable — for any institution paying attention.
The Structure That Made It All Possible
KSD transparency. Korean retail positions are disclosed near-daily on the public SEIBro portal, converting retail flow tracking from inference to near-real-time observation. This is the foundational edge that made all other strategies possible: the signal was publicly available, not proprietary.
Legal arbitrage driving demand inelasticity. Lamont documents that approximately 12% of all Korean retail U.S. holdings are in products prohibited by Korean law — leveraged single-stock ETFs and crypto vehicles. These buyers cannot substitute to domestic alternatives; their demand is structurally inelastic and, thus, more predictable. Inelastic, observable demand is the rarest combination in markets.
Float concentration creating price-setting power. By late February 2025, Lamont’s data shows Korean retail owning 31% of one quantum stock’s float, 17% of another’s, and over 40% of at least one 2X single-stock leveraged ETF. In those names, Korean retail was the marginal price-setter. The institution that understood this float math had structural informational advantage over every other participant.
Goldman’s macro signal extending the runway. Goldman’s Speculative Trading Indicator at the 88th percentile since 1990 told institutions this retail wave had a longer operational window than 2021 — more time to pre-position before distribution, more time to manufacture momentum, more time to pre-identify ETF inclusion candidates.
Together, these four features explain why the five strategies documented in this piece — passive 13F cycling, flow manufacturing, ETF arbitrage, Goldman’s scoreboard, and Barclays’ defined-risk shorts — were not independent opportunistic trades. They were a coherent exploitation of a single structural condition: a large, predictable, publicly observable, legally captive retail cohort operating in markets where the sky, unlike Korea, has no 30% daily limit.
The Counterparty
Every institutional gain above had an identifiable counterparty. The FT profiled her: Chung Ji-eun, a 37-year-old Seoul financial worker who told the paper, “There is no better way to make a lot of money as a salaried worker, given low interest rates.” She had invested approximately ₩600 million (~$410,000) in U.S. equities. Her ₩250 million position in Ocean Power Technologies had nearly halved. She told the FT: “I am just holding them, believing that they will rebound some day.”
CLSA’s Korea equity strategist Jongmin Shim explained the underlying cause to the FT: many Koreans “were kind of forced to invest in financial assets because of rising property prices.” This socioeconomic pressure is precisely what makes the retail signal so consistent. The behavioral pattern — concentrated, momentum-chasing, leveraged, observable via KSD — is not random noise. It is predictable because it is structurally rooted.
Lamont ends his paper with an observation that functions as both warning and thesis: in Squid Game, the piggy bank kept filling in the early rounds, and most players looked like they were winning. By the final episode, almost all were dead. In the 2025 meme market, the institutions who built their alpha from this wave were not the contestants.
They ran the game.
📊 Want the Complete Trade Breakdown?
This article documented what happened. The Patreon piece goes further — every trade reconstructed with full transparency: confirmed 13F entries and exits, the exact inferred logic, the losing trades in equal detail, and three replication checklists you can use the next time this setup appears.
Eight trades. Five winning. Three losing. All documented. Renaissance’s 404.7% accumulation and 100% exit. EMJ’s manufactured momentum mechanics. The BYND ETF arbitrage structure. The .5B in documented short seller losses. And the 15-year Korean retail losing pattern — explained as a replicable edge, not just a statistic.
→ Read the full trade reference here — Korea 2025 Complete Trade Breakdown
This is a Patreon exclusive. If you are not yet a member, joining gives you access to this piece and all future institutional-grade research.
About the Author
Navnoor Bawa is a quantitative trader and financial researcher focused on institutional market structure, alternative data, and systematic trading strategies.
📺 YouTube: The Mathematical Trader — quantitative finance, trading strategy breakdowns, and market structure analysis
💼 LinkedIn: Navnoor Bawa — institutional research, market commentary, and professional updates
🎯 Patreon: Korea 2025 — Complete Trade Breakdown (exclusive) | All research & membership
Fact-Check Notes
The following four corrections were made to the original draft based on primary source verification:
Volmageddon row (Table 1): Corrected from “Yes (prior month)” to “Yes (both months)” — confirmed directly against Lamont’s Table 1 retrieved from the Acadian paper, which shows the VelocityShares Daily Inverse VIX Short Term ETN in the top-50 Korean net buys for both January and February 2018.
Carvana trade attribution: Removed the attribution of specific Carvana entry figures ($9.42, Feb 28, 2023, $3.50 bottom) to Sherwood News. The Sherwood article confirms Jackson’s Carvana thesis in June 2023 when the stock was at approximately $25 (down from $377); the more specific price details originate from Jackson’s own X account posts. Attribution corrected accordingly.
Melvin Capital emergency injection: Corrected from “$3 billion” to “$2.75 billion” — confirmed simultaneously by Bloomberg, Reuters, PR Newswire, and CNBC. The breakdown: $2B from Citadel, $750M from Point72.
BYND October 20 single-day gain: Corrected from “75% single-day jump” to “127% closing gain” — the 75% figure reflects an intraday snapshot. The official closing change on October 20 was +127%, confirmed by CNBC, Benzinga, and GuruFocus.
Sources
Acadian “The Squid Game Stock Market” (March 2025) | Acadian “The U.S. Stock Market is Koreafying” (2024) | Korea Securities Depository SEIBro | FT — Squid Game Market (Nov 12, 2025) | Bloomberg — EMJ Capital/Jackson (July 25, 2025) | Bloomberg TV — Jackson “Could hit $500” transcript (Aug 21, 2025) | Yahoo Finance — Jackson Opendoor bull case interview (July 24, 2025) | Sherwood News — Jackson strategy/Carvana entry detail | Eric Jackson X/Twitter | Yahoo Finance — Jackson Drake campaign (Sep 12, 2025) | Disruption Banking — Opendoor 1,600% Comeback (Oct 8, 2025) | Bloomberg Opinion — Matt Levine “Pod Shops Are the New Banks” (Aug 28, 2025) | Securities Docket — Meme-Stock Hedge Fund Management (Aug 29, 2025) | DCF Modeling — IonQ Q3 2025 13F Institutional Profile | Motley Fool — Q3 Institutional Buying IonQ (Nov 21, 2025) | Quiver Quantitative — IonQ Q4 2025 13F | Motley Fool — Q4 Institutional Message: Quantum Stocks (Feb 25, 2026) | Fox Business — Roundhill MEME ETF Launch (Oct 8, 2025) | CNBC — Beyond Meat MEME ETF (Oct 21, 2025) | Benzinga — Beyond Meat MEME ETF (Oct 21, 2025) | Bloomberg — Short Sellers $2.5B Loss (Jul 28, 2025) | Yahoo Finance/Goldman — Historic Short Squeeze (July 25, 2025) | Accelerate Financial — “Return of Meme Stock Mania” Investor Letter (Aug 16, 2025) | CNBC — JPMorgan Four Meme Candidates (Sep 11, 2025) | Bloomberg — Barclays Short Strategy (July 23, 2025) | Bloomberg — Melvin Capital $2.75B injection (Jan 25, 2021) | Kraken — Melvin Capital/GameStop history
Cover photograph: hyolee2, CC BY-SA 3.0, via Wikimedia Commons.