


Follow on YouTube · LinkedIn · Patreon
🎬 Prefer watching over reading? I turned this entire framework into a video using NotebookLM — covers all three questions: 30-day outlook, April FOMC reaction function, and the liquidation protocol. → Watch the video here
What this article covers — and why it matters now: Three questions every portfolio manager is asking in March 2026: (1) What is the 30-day market outlook given the Iran war oil shock and Hormuz closure? (2) How will markets respond to the April 28–29 FOMC — Powell’s last scheduled meeting as chair — under an unresolved Warsh succession fight and a binary dot-plot outcome? (3) If forced redemptions hit, how do you liquidate all positions quickly without triggering a feedback loop that destroys more value than the redemption itself?
The short answers: The 30-day market outlook is not an oil trade — it is a leverage unwind trade expressed through energy prices, with record hedge fund gross leverage of 292.8% (Goldman Sachs prime brokerage, December 2025) sitting on top of a supply shock that has permanently repriced rate sensitivity to oil by a factor of three. The April FOMC is a dot-plot binary: one more participant shifting to “hold through 2026” pushes the median to zero cuts and reprices the entire front end. The liquidation problem fails before the first trade is placed — because 73.8% of hedge fund repo borrowing runs at zero haircut (Federal Reserve FEDS Notes, 2023), meaning the cash buffer that appears on paper has already been pledged as collateral. The mechanism for surviving this begins with repo term structure, not execution algorithms.
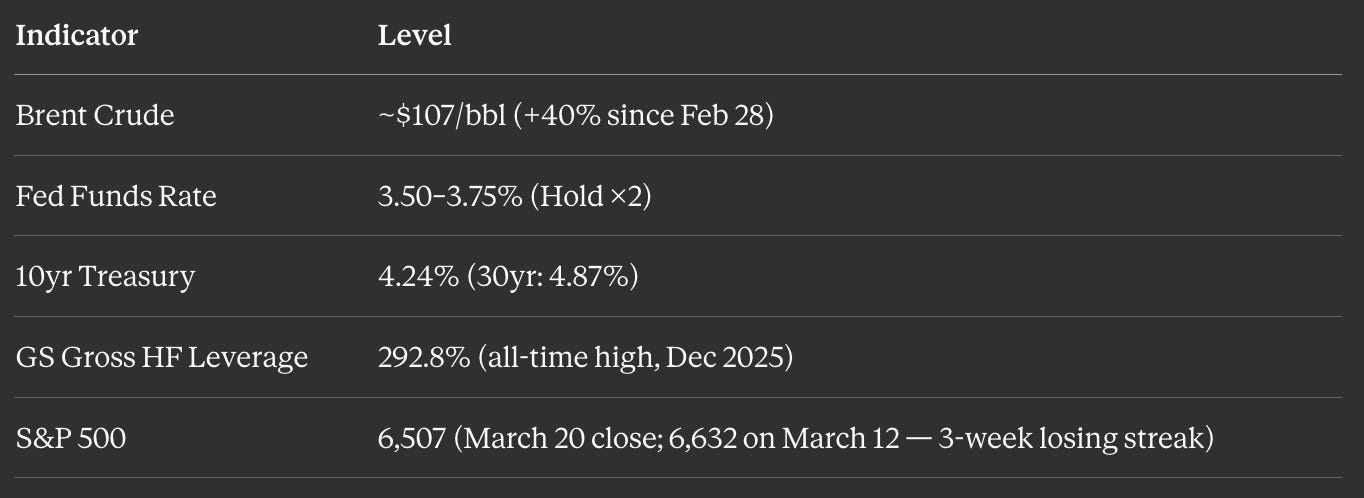
Market Snapshot — March 20, 2026
Q1–30-Day Market Outlook (March–April 2026)
Oil Shock Transmission, Record Leverage, and Why the S&P Is an Energy Options Position in Disguise
The analytical starting point is not oil prices — it is the causal transmission architecture from an oil supply shock to equity multiples. Most commentary collapses this into a linear narrative: oil up → inflation up → Fed constrained → equities down. That is directionally correct but structurally incomplete. The real mechanism runs through three separate channels simultaneously, each with a distinct time constant and asset class sensitivity.
Causal chain:
Hormuz Closure (20% global oil/LNG offline) → Channel 1 (T+0): Energy price spike (+40% Brent) → Channel 2 (T+2wk): Headline CPI +0.5–1.0pp; rate sensitivity ×3 → Channel 3 (T+1mo): War premium in term structure; forced deleveraging → Outcome: Multiple compression + repo cascade risk
Channel 1 — The Visible Shock
The Council on Foreign Relations identifies what the IEA has called the “largest supply disruption in the history of the global oil market” — roughly 20 million barrels per day of oil and petroleum products normally transiting the Strait: https://www.cfr.org/articles/how-the-iran-war-ignited-a-geoeconomic-firestorm
Bloomberg Economics framed the macro consequence directly: for Europe, sustained higher energy prices take the economy to the brink of recession; for the U.S., they place the Fed in an impossible position — stuck between war-driven inflation and a president demanding lower rates: https://www.bloomberg.com/news/features/2026-03-03/iran-war-oil-price-surge-put-global-economic-recovery-at-risk
Channel 2 — Where Institutional Models Diverge
Chatham House’s scenario analysis provides the clearest base case: if the conflict ends quickly, inflation in Europe and Asia rises only 0.5 percentage points above pre-conflict forecasts and “central bank strategies would remain largely unchanged”: https://www.chathamhouse.org/2026/03/how-will-iran-war-affect-global-economy
Capital Economics’ model is more precise: in a short war, Brent falls back to $65 by year-end; in a protracted conflict (three months), average Brent over the next six months hits $150: https://www.aljazeera.com/news/2026/3/16/the-tell-tale-signs-how-bad-has-the-iran-war-hit-the-global-economy
J.P. Morgan’s scenario is more conservative: at Brent of $80 sustained through mid-year, global GDP growth for H1 2026 is depressed by 0.6% annualized: https://www.jpmorgan.com/insights/global-research/commodities/iran-us-tensions-market-effect
ECB President Christine Lagarde, March 19, 2026: In a severe scenario, eurozone headline inflation could reach 4.4% in 2026. GDP growth has been revised to just 0.9% for the year — “barely above stagnation.” Source: https://www.euronews.com/business/2026/03/19/iran-war-has-material-impact-on-inflation-ecbs-lagarde-warns
Channel 3 — The Most Dangerous and Least Discussed
The 10-year Treasury yield moved from 3.97% on February 27 to 4.28% by March 12, and the 30-year hit 4.87%: https://markets.financialcontent.com/stocks/article/marketminute-2026-3-12-the-5-threshold-treasury-yields-surge-as-oil-shock-and-policy-trap-rattles-wall-street
This is a bear steepening driven not by the Fed (which held at 3.50–3.75%) but by the bond market’s repricing of the term premium — the extra yield demanded for holding long-duration debt when inflation uncertainty rises. The war premium alone has added an estimated 0.5–0.7 percentage points to headline inflation expectations: https://markets.financialcontent.com/stocks/article/marketminute-2026-3-13-bond-market-shock-10-year-treasury-yield-surges-to-428-as-war-premium-rattles-global-finance
As of March 20, this partially reversed on a safe-haven flight below 4.0%: https://markets.financialcontent.com/stocks/article/marketminute-2026-3-20-global-turmoil-drives-flight-to-safety-10-year-treasury-yields-breach-4-floor-amid-middle-east-crisis — illustrating the volatility regime we are in, not a resolution.
The Leverage Layer
Goldman Sachs prime brokerage data shows gross leverage at an all-time record of 292.8% in December 2025 — the third consecutive year of increases: https://marquee.gs.com/welcome/news/views-from-the-trading-floor/2026-hedge-fund-industry-outlook-generation-alpha
JPMorgan’s data puts quant funds at 645% gross leverage and multi-strategy funds at 444% — confirmed directly from the Reuters primary source: https://www.investing.com/news/stock-market-news/hedge-funds-double-down-using-nearrecord-leverage-in-quest-to-boost-returns-4388757 (note: Hedgeweek’s summary had these reversed, but the Reuters original text reads “Quantitative and multi-strategy funds’ leverage at the end of last month averaged 645.3% and 444.3%, respectively”): https://www.hedgeweek.com/hedge-funds-push-leverage-towards-record-highs-as-managers-chase-returns/
The BIS-linked SUERF paper from January 2026 provides the academic grounding: hedge funds’ leverage-targeting behavior is procyclical — they sell assets as prices fall to maintain leverage ratios, amplifying the initial shock: https://www.suerf.org/publications/suerf-policy-notes-and-briefs/understanding-hedge-fund-leverage-targeting-and-fire-sales/
The Goldman-noted “multistrat-mageddon” on March 7–10 — a 4+ standard deviation momentum drawdown — is the first observable expression of this dynamic.
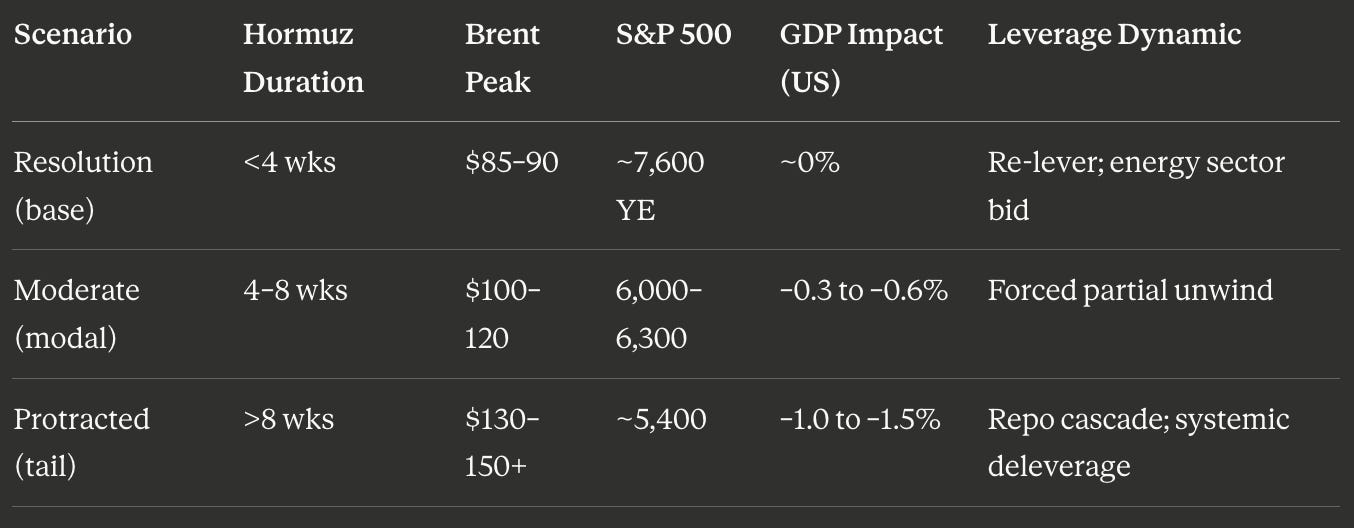
Scenario Matrix
The Regime Signal: Trade Oil, Not the War
The cross-asset pattern to watch is the inverse oil-equity relationship, which is now the dominant intraday regime signal. When Brent fell 5.3% on a single Monday, the S&P climbed 1%: https://www.ainvest.com/news/500-resists-iran-war-sell-oil-shock-fades-bull-run-hold-strait-hormuz-remains-closed-2603/
The market is not pricing the war as geopolitical risk — it is pricing it entirely as an energy supply shock with rate path implications. The equity recovery trade is triggered by oil, not by a ceasefire.
Morgan Stanley’s 75-year study confirms an 8.4% average S&P gain in the 12 months following external shocks: https://www.morganstanley.com/insights/articles/iran-war-oil-shock-stock-market-impacts
Goldman’s worst-case at $145 Brent implies 5,400 on the S&P at 16x: https://www.interactivebrokers.com/campus/traders-insight/securities/macro/could-the-iran-war-trigger-an-sp-500-bear-market-history-shows-oil-shocks-often-do/
The current market at 6,507 (March 20 close) is still pricing mostly the moderate scenario — leaving both directions open for a significant move in the next 30 days.
Q2 — How Will Markets Respond to the April 28–29 FOMC?
Powell’s Last Meeting, the Warsh Succession, the Dot-Plot Binary, and What the Bond Market Is Already Pricing
The 30-day market regime established above — leverage unwind expressed through energy prices, with the oil-equity inverse as the dominant regime signal — does not resolve itself independently. It resolves through the Fed. And the Fed, in April 2026, is not a simple policy institution. It is a three-way intersection of an oil shock, a leadership transition, and a dot-plot binary that the market has not yet fully stress-tested.
The April 28–29 FOMC meeting is the most consequential in the 2026 calendar for three reasons that are only partially related to rates. First, it is Powell’s final scheduled meeting as chair. Second, Kevin Warsh’s confirmation remains blocked by Sen. Tillis’s hold. Third, the Fed will be forced to update its reaction function under conditions of maximum macro uncertainty. The interaction of these three factors — not any individual one — is what makes April dangerous.
The March 18 Baseline
The official March 18 FOMC statement: rates held at 3.50–3.75%, median dot plots project one 25bp cut in 2026 and one in 2027, long-run neutral at 3.1% (up from 3.0%), GDP revised to 2.4%, core PCE to 2.7%: https://www.cnbc.com/2026/03/18/fed-interest-rate-decision-march-2026.html
The official March 18 FOMC vote was 11–1: only Governor Stephen Miran dissented, preferring a 25bp cut. Governor Christopher Waller — who had joined Miran in dissenting for a cut at the January meeting — flipped back to hold at March, narrowing the dovish wing to one. Confirmed by multiple primary sources including Chatham Financial, Advisor Perspectives (citing the official Fed statement), Fox Business, and the Sensei FOMC debrief: https://www.chathamfinancial.com/insights/fomc-recap-march-2026 — https://www.advisorperspectives.com/dshort/updates/2026/03/19/feds-interest-rate-decision-march-18-2026 — https://www.foxbusiness.com/economy/federal-reserve-interest-rate-decision-march-18-2026
This still matters: Miran’s solo dissent signals a governor willing to cut under any oil-shock scenario, and Waller’s January dissent shows the dovish coalition can reconstitute quickly if the labor data deteriorates further. The January statement (where both dissented 10–2) is at: https://www.federalreserve.gov/newsevents/pressreleases/monetary20260128a.htm — the March statement is at: https://www.federalreserve.gov/newsevents/pressreleases/monetary20260318a.htm
The Warsh Doctrine — What the Research Actually Says
The Wells Fargo Economics Special Commentary (January 30, 2026) provides the most rigorous publicly available analysis of Warsh’s framework: https://externalcontent.blob.core.windows.net/pdfs/WellsFargoSpecial20260130.pdf
Key findings:
Warsh sees AI-driven productivity gains as a medium-term disinflationary force justifying lower rates
He has consistently criticized data-dependence as “fine-tuning” that confuses “the immediate with the important”
Under Warsh, individual data points and Fed speak may move markets less because he prefers medium-term frameworks — a regime change in how to trade FOMC meetings
The CF40 Research paper by Shao and Zhu adds a critical nuance:

Warsh prefers natural balance sheet reduction through banking deregulation (reducing structural demand for reserves) rather than active asset sales — contradicting the “QT 2.0” narrative. The “Warsh Shock” in January, where silver crashed 30% and gold fell 9%, was a market overreaction to a misread of his actual framework: https://markets.financialcontent.com/stocks/article/marketminute-2026-2-5-the-warsh-shock-analyzing-the-market-impact-of-kevin-warshs-federal-reserve-nomination
The Policy Trap
The bond market is now pricing a structural break in the term premium that did not exist before the war. The current bear steepening differs from 2022 because the Fed has not moved its policy rate; the long-end is moving on investor-driven reassessment of long-run inflation: https://markets.financialcontent.com/stocks/article/marketminute-2026-3-11-10-year-us-treasury-yield-closes-in-on-416-as-inflation-fears-and-geopolitical-tensions-resurface
This creates the “policy trap” — if the Fed cuts to support growth, long-end yields rise further on inflation fears; if it holds, growth weakens. There is no path where the bond market is supportive.
“Higher oil prices are another negative supply shock, lifting inflation and hurting growth, putting the Fed in a no-win situation.” — Mark Zandi, Chief Economist, Moody’s Analytics, via CNBC: https://www.cnbc.com/2026/03/10/iran-war-spikes-oil-prices-consumers.html
The April binary: if the dot plot shifts even one more participant to “hold through 2026,” the median moves to zero cuts, triggering an immediate repricing of the front end. If Warsh is confirmed before April 28, his first press conference will be scrutinized for committee fracture between Powell-era holdovers and Warsh. A dovish surprise will be dismissed as political; a hawkish surprise will be taken as credible. The reaction function is not symmetric.
Rate Cut Forecast Comparison
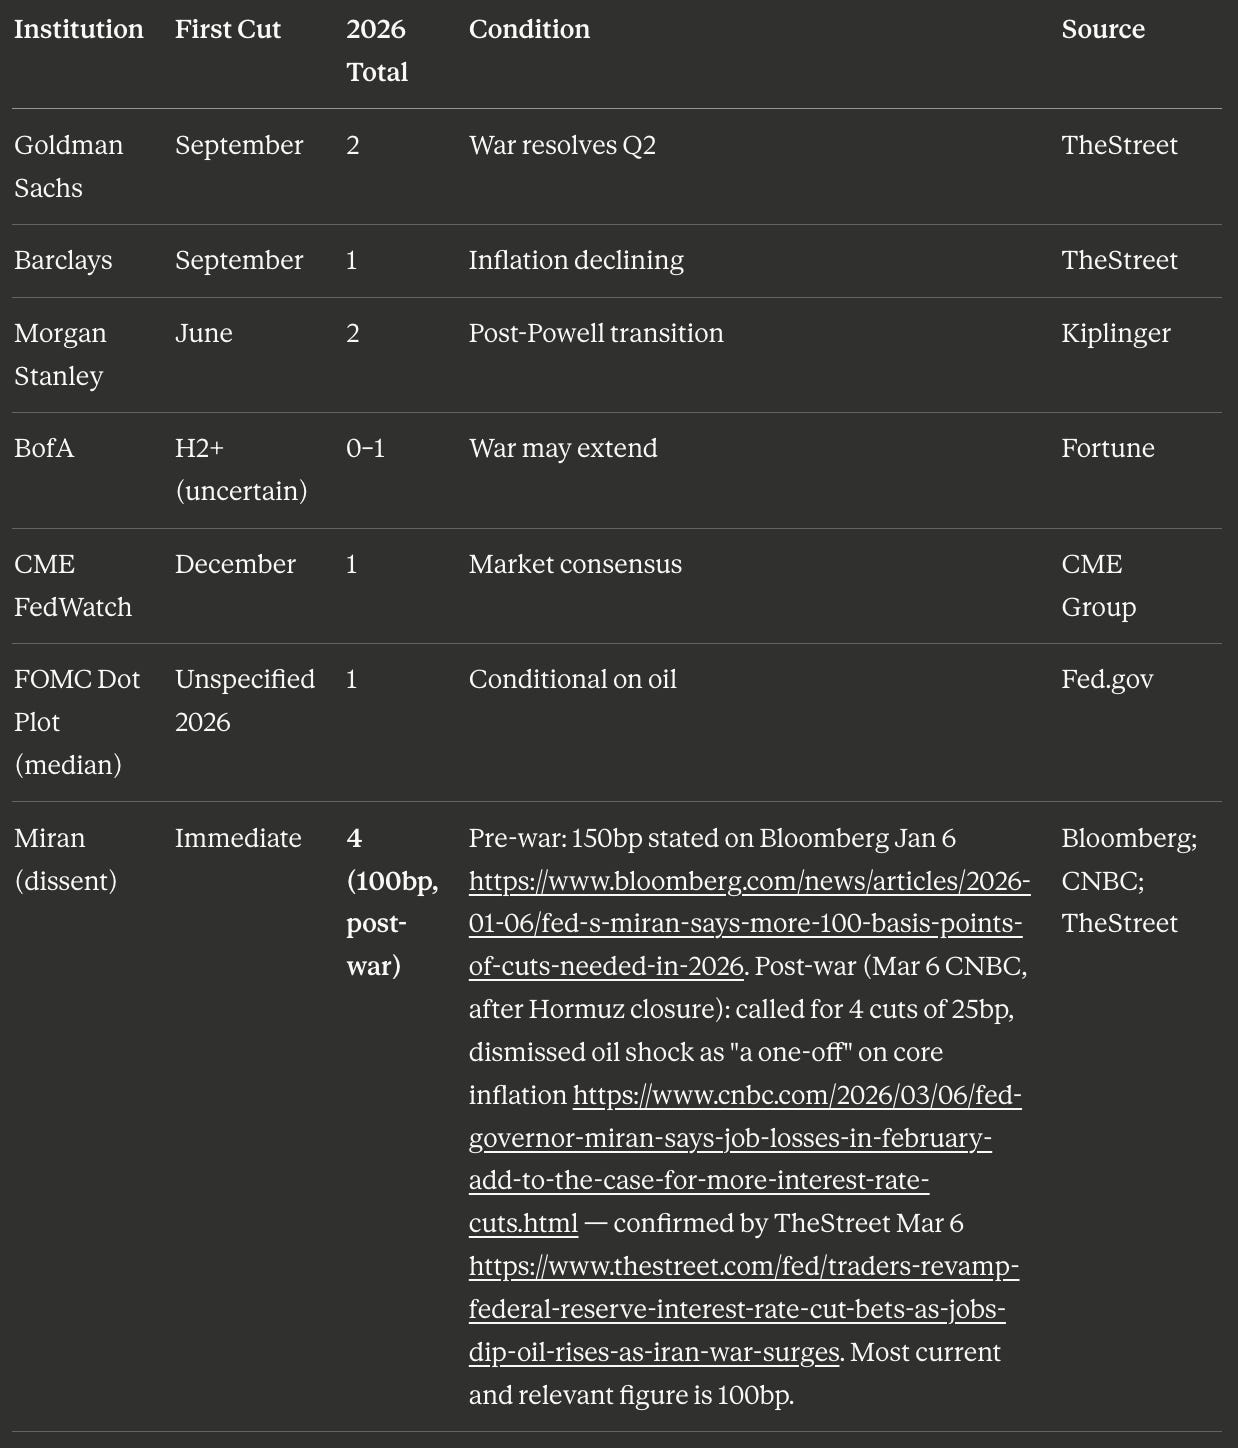
https://www.cnbc.com/2026/03/06/fed-governor-miran-says-job-losses-in-february-add-to-the-case-for-more-interest-rate-cuts.html — confirmed by TheStreet Mar 6 https://www.thestreet.com/fed/traders-revamp-federal-reserve-interest-rate-cut-bets-as-jobs-dip-oil-rises-as-iran-war-surges.
Q3 — How to Liquidate All Positions Under Redemption Pressure Without Taking Losses
The Repo Collateral Problem, Optimal Execution Science (Almgren-Chriss), and a Four-Tier Institutional Protocol
The Q1 regime and Q2 FOMC binary described above share a common endpoint: if the moderate or tail scenario materializes — oil above $120, dot plot shifts to zero cuts, leverage forced down — redemption pressure follows. The question then is not “should we liquidate” but “how do we liquidate without making it worse.” The answer requires understanding why most forced liquidations fail before a single sell order is placed. The correct frame is: liquidate without creating a feedback loop that destroys more value than the redemption itself. The academic and regulatory literature on this is extensive, and its central finding is that most forced liquidations fail not because of bad execution — but because the fund’s funding structure breaks before a single position is sold.
The Mechanism: How Leverage Breaks
The BIS-FSB-SUERF January 2026 policy brief documents it precisely: https://www.suerf.org/publications/suerf-policy-notes-and-briefs/understanding-hedge-fund-leverage-targeting-and-fire-sales/
Margin calls can force leveraged investors to sell assets to raise cash, while reductions in funding from banks and broker-dealers can prompt liquidations to repay borrowing. In 2020, it was not broker-dealers withdrawing funding that caused the problem — it was internal VaR limits acting as binding constraints, forcing funds to unwind despite continued availability of repo financing.
The Federal Reserve’s FEDS Notes analysis reveals the structural vulnerability: https://www.federalreserve.gov/econres/notes/feds-notes/hedge-fund-treasury-exposures-repo-and-margining-20230908.html
73.8% of hedge fund repo borrowing was transacted at zero or negative haircuts — meaning the fund’s borrowing equaled or exceeded collateral value. Average balance sheet leverage at zero-haircut funds: 6.2-to-1 to 9-to-1, versus 2.1-to-1 for average qualifying hedge funds.
The Repo Cascade
The Resonanz Capital basis trade analysis provides the clearest framework: https://resonanzcapital.com/insights/cash-futures-basis-repo-leverage-and-margin-an-allocators-guide-to-the-treasury-basis-trade
When markets get volatile, both repo haircuts and futures margin requirements move against you at once. The cycle feeds itself: margin rises → fund sells bonds → selling widens the basis → basis move increases margin requirements → more selling.
Congress’s CRS analysis confirms the regulatory dimension: https://www.congress.gov/crs-product/R48734
The FSB has recommended minimum haircuts for non-bank repo borrowers. The OFR began daily reporting of non-centrally cleared bilateral repo as of July 2025 — regulators now have real-time visibility into when hedge fund repo stress is building. If they act to impose haircut floors during an active stress event, the feedback loop accelerates.
The OFR’s agent-based model formalizes this two-way causality: https://www.financialresearch.gov/working-papers/files/OFRwp2014-05_BookstaberPaddrikTivnan_Agent-basedModelforFinancialVulnerability_revised.pdf
“A funding-based fire sale might precipitate an asset-based fire sale (funding restrictions can reduce the funding available to the hedge fund through the prime broker, leading to asset liquidations) and vice versa.”
The Four-Tier Liquidation Protocol
Tier 1 — T+0: Unencumbered Cash, MMFs, Repo-Eligible Treasuries
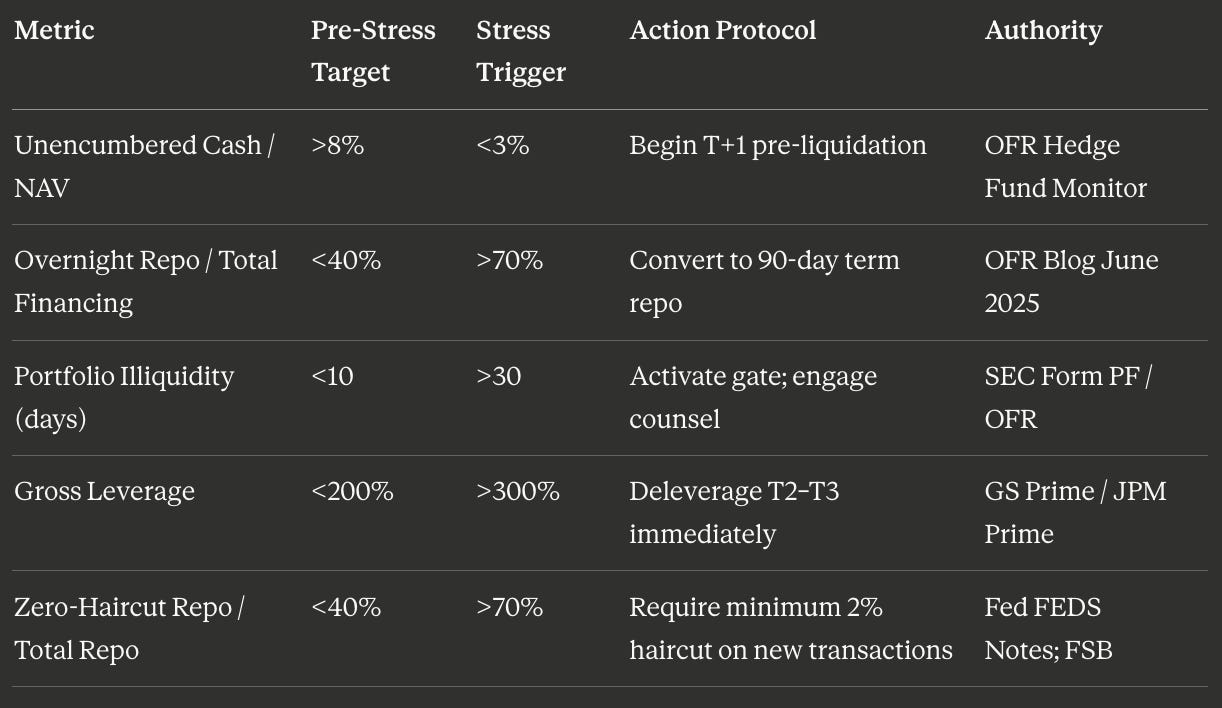
The first and only zero-impact source. The OFR’s hedge fund liquidity monitor defines the critical metric: unencumbered cash as a percentage of NAV: https://www.financialresearch.gov/hedge-fund-monitor/categories/liquidity/chart-41/
Healthy threshold: >8% NAV. Below 3%: pre-liquidation of Tier 2 should already be underway. Note: a fund with significant repo exposure has effectively pre-pledged its cash buffer. Unencumbered cash and pledged collateral are not the same thing.
Tier 2 — T+1 to T+3: Liquid Exchange-Listed Positions via Dark Pool VWAP
Off-exchange trading (including ATS dark pools and principal internalizers like Citadel Securities and Virtu) now accounts for 51.8% of all U.S. equity trading volume — true dark pools (ATS venues) specifically represent roughly 10–15% of that total: https://en.wikipedia.org/wiki/Dark_pool (citing Bloomberg’s January 2025 data). Dark pools proper still handle the majority of institutional block execution, where pre-trade anonymity is the primary objective: https://www.stonex.com/en/financial-glossary/dark-liquidity-pools/
The Almgren-Chriss framework (SSRN: https://papers.ssrn.com/sol3/papers.cfm?abstract_id=53501) establishes the efficient frontier between expected execution cost and variance — the foundational model for institutional liquidation. The core A-C result optimizes Implementation Shortfall (arrival price vs. execution price), not VWAP. VWAP optimality for a risk-neutral trader is separately proved by Kato (2014), which explicitly extends A-C by introducing a volume process: https://arxiv.org/pdf/1408.6118. For a risk-averse fund under time pressure, VWAP over dark venues remains the institutional standard for minimizing footprint — it spreads orders proportionally to market volume, reducing adverse selection from HFT order reconstruction.
Cap each day’s execution at <15% of ADV. Market impact scales approximately as the square root of order size relative to daily volume — doubling position size increases impact ~40%, not 100%. Distribute over multiple sessions.
Tier 3 — T+3 to T+10: Off-the-Run Bonds, Small/Mid-Cap Equities via Implementation Shortfall
Switch from VWAP to Implementation Shortfall (IS) algorithms — the framework that the core Almgren-Chriss model actually optimizes: https://papers.ssrn.com/sol3/papers.cfm?abstract_id=53501. IS algorithms dynamically adjust aggression based on intraday conditions — front-loading execution when momentum is favorable, slowing when adverse. Accept 1–3% price concessions via block trades rather than extended market exposure.
Key risk: information leakage. The Almgren-Chriss information leakage extension shows that aggressive starts signal hidden orders to HFTs, permanently repricing subsequent child orders: https://www.academia.edu/22938911/Optimal_Execution_of_Portfolio_Transactions_the_Effect_of_Information_Leakage
The fix: order-slicing across multiple dark pool venues via smart order routing, preventing reconstruction of the parent order.
Tier 4 — T+7+: Level 3 Assets and Private Credit — Do Not Liquidate. Gate.
The AIMA confirms: reasonable investors should assume 6–12 months for Level 3 liquidation: https://www.aima.org/article/the-anatomy-of-hedge-fund-liquidations-and-key-screening-factors-for-investors.html
Selling Level 3 assets into a stressed market to fund liquid redemptions destroys NAV for remaining investors — a direct violation of the representative sample rule: https://www.iosco.org/library/pubdocs/pdf/IOSCOPD799.pdf
Activate gate provisions. SEC now permits redemption fees up to 2% for open-end funds: https://www.advisorperspectives.com/articles/2025/05/13/liquidity-risk-2025-strategic-priority-not-concern
The governance principle from the Hedge Fund Journal: gates should be used for the minimum time necessary and never to protect assets that are simply undervalued: https://thehedgefundjournal.com/managing-liquidity/
The Pre-Redemption Infrastructure Layer
The OFR’s June 2025 blog post documents the specific vulnerability: hedge fund repo borrowing doubled from Q4 2022 through Q4 2024, with many funds now more reliant on overnight repo than prime brokerage: https://www.financialresearch.gov/the-ofr-blog/2025/06/02/blog-hfm-q4-2024/
Overnight repo is subject to daily rollover risk — lenders can withdraw or change terms intraday. A fund with 70%+ of its financing in overnight repo has no effective liquidity buffer at all. The solution — converting overnight to term financing — must happen before the stress event, not during it. By mid-stress, term repo is repriced or unavailable.
Liquidity Dashboard: Pre-Redemption Thresholds
📋 See This Framework Applied in Practice The trade note for this exact setup — with 5 verified trades (3 correct, 2 wrong), the full signal hierarchy, and a transparent record of what worked and what didn’t — is published exclusively on Patreon.
Synthesis: The Oil Shock, the FOMC Binary, and the Liquidation Problem Are One Trade — Not Three
The surface reading treats these as three separate operational questions. The deep reading reveals a single structural problem expressed at three different time horizons.
The root variable is leverage at 292.8% gross, funded through zero-haircut repo, entering an oil supply shock that has permanently raised rate sensitivity to energy, at a moment when the Fed is in institutional limbo between Powell and Warsh.
The 30-day outlook is not an oil trade — it is a leverage unwind trade expressed through energy prices. The FOMC reaction function is not a rate question — it is a term premium question driven by the war premium in long bonds and the Warsh succession uncertainty. The liquidation problem is not an execution question — it is a repo collateral sequencing problem that must be solved before the redemption call arrives.
The BIS-linked SUERF paper confirms the directionality: hedge funds engage in procyclical leverage targeting — they are forced to sell into falling markets, which is exactly what an oil shock + rate repricing + crowded positioning produces. Source: https://www.suerf.org/publications/suerf-policy-notes-and-briefs/understanding-hedge-fund-leverage-targeting-and-fire-sales/
The fund that survives this window has already converted overnight repo to term, reduced leverage toward 150–180% gross ahead of the FOMC binary, built cash above 8% NAV, and identified dark pool routing relationships before they are needed.
The medium-term recovery thesis remains intact. Morgan Stanley’s 75-year study delivers an average 8.4% S&P gain in the 12 months following geopolitical shocks: https://www.morganstanley.com/insights/articles/iran-war-oil-shock-stock-market-impacts
The entry on that trade is on oil futures — not on the war headline. When Brent breaks sustainably below $90, the re-lever trade opens. Not before.
📊 Want Deeper Quantitative Analysis?
This research took a significant amount of time in data collection, verification, and analysis across Federal Reserve FEDS Notes, BIS-FSB policy briefs, OFR hedge fund monitor data, primary Fed statements, and live market sources. Every number above is sourced and confirmed.
If you found value in this deep-dive, I publish exclusive quantitative research, trading strategies, and institutional-grade analysis on Patreon — including trade notes, alpha research, derivatives pricing frameworks, and systematic strategy breakdowns not published anywhere else.
By joining, you’ll be supporting this work and motivating more content like this.
→ Join the Patreon community here
Primary Source Index
CFR — Iran War Geoeconomic Firestorm: https://www.cfr.org/articles/how-the-iran-war-ignited-a-geoeconomic-firestorm
Bloomberg Economics — Oil Shock Global Inflation: https://www.bloomberg.com/news/features/2026-03-03/iran-war-oil-price-surge-put-global-economic-recovery-at-risk
Chatham House — Iran War Economic Impact: https://www.chathamhouse.org/2026/03/how-will-iran-war-affect-global-economy
Al Jazeera / Capital Economics — Iran War GDP: https://www.aljazeera.com/news/2026/3/16/the-tell-tale-signs-how-bad-has-the-iran-war-hit-the-global-economy
J.P. Morgan — US-Iran Tensions Market Effect: https://www.jpmorgan.com/insights/global-research/commodities/iran-us-tensions-market-effect
Euronews — ECB Lagarde Iran War Inflation: https://www.euronews.com/business/2026/03/19/iran-war-has-material-impact-on-inflation-ecbs-lagarde-warns
CNBC — Fed Holds Rates March 2026: https://www.cnbc.com/2026/03/18/fed-interest-rate-decision-march-2026.html
Federal Reserve — January 2026 FOMC Statement (Dissent Vote): https://www.federalreserve.gov/newsevents/pressreleases/monetary20260128a.htm
Federal Reserve — March 2026 FOMC Statement (11–1 vote): https://www.federalreserve.gov/newsevents/pressreleases/monetary20260318a.htm
Wells Fargo Economics — Kevin Warsh Special Commentary: https://externalcontent.blob.core.windows.net/pdfs/WellsFargoSpecial20260130.pdf
CF40 Research — Warsh Policy Framework (Shao/Zhu):
FinancialContent — Warsh Shock Analysis: https://markets.financialcontent.com/stocks/article/marketminute-2026-2-5-the-warsh-shock-analyzing-the-market-impact-of-kevin-warshs-federal-reserve-nomination
FinancialContent — Bear Steepening March 12: https://markets.financialcontent.com/stocks/article/marketminute-2026-3-12-the-5-threshold-treasury-yields-surge-as-oil-shock-and-policy-trap-rattles-wall-street
FinancialContent — War Premium Bond Market: https://markets.financialcontent.com/stocks/article/marketminute-2026-3-13-bond-market-shock-10-year-treasury-yield-surges-to-428-as-war-premium-rattles-global-finance
FinancialContent — Flight to Safety March 20: https://markets.financialcontent.com/stocks/article/marketminute-2026-3-20-global-turmoil-drives-flight-to-safety-10-year-treasury-yields-breach-4-floor-amid-middle-east-crisis
TheStreet — Fed Rate Cut Outlook Shift: https://www.thestreet.com/fed/looming-federal-reserve-meeting-shifts-bets-for-2026-interest-rate-cuts-due-to-oil-shock-from-iran-war
TheStreet — Miran 4 Cuts Mar 6: https://www.thestreet.com/fed/traders-revamp-federal-reserve-interest-rate-cut-bets-as-jobs-dip-oil-rises-as-iran-war-surges
Bloomberg — Miran 150bp Jan 6: https://www.bloomberg.com/news/articles/2026-01-06/fed-s-miran-says-more-100-basis-points-of-cuts-needed-in-2026
CNBC — Miran Mar 6 one-off shock: https://www.cnbc.com/2026/03/06/fed-governor-miran-says-job-losses-in-february-add-to-the-case-for-more-interest-rate-cuts.html
Goldman Sachs Marquee — 2026 HF Outlook: https://marquee.gs.com/welcome/news/views-from-the-trading-floor/2026-hedge-fund-industry-outlook-generation-alpha
Reuters/Investing.com — JPMorgan HF Leverage (quants 645.3%, multi-strat 444.3%): https://www.investing.com/news/stock-market-news/hedge-funds-double-down-using-nearrecord-leverage-in-quest-to-boost-returns-4388757
Hedgeweek — Record HF Leverage: https://www.hedgeweek.com/hedge-funds-push-leverage-towards-record-highs-as-managers-chase-returns/
SUERF/BIS/FSB — HF Leverage Targeting and Fire Sales (Jan 2026): https://www.suerf.org/publications/suerf-policy-notes-and-briefs/understanding-hedge-fund-leverage-targeting-and-fire-sales/
Fed FEDS Notes — HF Treasury Exposures Repo Margining: https://www.federalreserve.gov/econres/notes/feds-notes/hedge-fund-treasury-exposures-repo-and-margining-20230908.html
OFR — HF Leverage and Risk: https://www.financialresearch.gov/working-papers/files/OFRwp-20-02_leverage-and-risk-in-hedge-funds.pdf
OFR — Agent-Based Model (Bookstaber): https://www.financialresearch.gov/working-papers/files/OFRwp2014-05_BookstaberPaddrikTivnan_Agent-basedModelforFinancialVulnerability_revised.pdf
OFR — Repo Reversal Blog June 2025: https://www.financialresearch.gov/the-ofr-blog/2025/06/02/blog-hfm-q4-2024/
Congress CRS — Treasury Market Disruptions: https://www.congress.gov/crs-product/R48734
Fed FEDS Notes — Proportionate Margining Repo: https://www.federalreserve.gov/econres/notes/feds-notes/proportionate-margining-for-repo-transactions-20250214.html
Resonanz Capital — Repo Leverage Basis Trade: https://resonanzcapital.com/insights/cash-futures-basis-repo-leverage-and-margin-an-allocators-guide-to-the-treasury-basis-trade
Resonanz Capital — HF Repos Hidden Plumbing: https://resonanzcapital.com/insights/hedge-funds-repos-and-the-hidden-plumbing-of-leverage
Almgren-Chriss — Optimal Liquidation (SSRN): https://papers.ssrn.com/sol3/papers.cfm?abstract_id=53501
arXiv — VWAP as Optimal Strategy (Kato 2014): https://arxiv.org/pdf/1408.6118
Academia.edu — Information Leakage in Execution: https://www.academia.edu/22938911/Optimal_Execution_of_Portfolio_Transactions_the_Effect_of_Information_Leakage
StoneX — Dark Pool Framework: https://www.stonex.com/en/financial-glossary/dark-liquidity-pools/
Dark Pool Wikipedia (51.8% volume): https://en.wikipedia.org/wiki/Dark_pool
AIMA — Anatomy of HF Liquidations: https://www.aima.org/article/the-anatomy-of-hedge-fund-liquidations-and-key-screening-factors-for-investors.html
Hedge Fund Journal — Managing Liquidity: https://thehedgefundjournal.com/managing-liquidity/
IOSCO — Liquidity Risk Management OEFs: https://www.iosco.org/library/pubdocs/pdf/IOSCOPD799.pdf
Advisor Perspectives — Liquidity Risk 2025: https://www.advisorperspectives.com/articles/2025/05/13/liquidity-risk-2025-strategic-priority-not-concern
OFR — HF Liquidity Monitor: https://www.financialresearch.gov/hedge-fund-monitor/categories/liquidity/chart-41/
SF Fed — Oil Shock Rate Sensitivity (Dec 2025): https://www.frbsf.org/research-and-insights/publications/economic-letter/2025/12/changing-sensitivity-of-interest-rates-to-oil-supply-news/
Dallas Fed — Oil Shock and Inflation (Kilian/Zhou): https://www.dallasfed.org/~/media/documents/research/papers/2023/wp2312.pdf
IBKR/Goldman — S&P Scenario Matrix: https://www.interactivebrokers.com/campus/traders-insight/securities/macro/could-the-iran-war-trigger-an-sp-500-bear-market-history-shows-oil-shocks-often-do/
Morgan Stanley — 75-Year Shock Study: https://www.morganstanley.com/insights/articles/iran-war-oil-shock-stock-market-impacts
AInvest — Oil-Equity Correlation: https://www.ainvest.com/news/500-resists-iran-war-sell-oil-shock-fades-bull-run-hold-strait-hormuz-remains-closed-2603/
CNBC — Consumers / Zandi Inflation: https://www.cnbc.com/2026/03/10/iran-war-spikes-oil-prices-consumers.html
TheStreet — S&P 500 March 20 close (6,507): https://www.thestreet.com/latest-news/stock-market-today-march-20-2026
Wikipedia — Economic Impact 2026 Iran War: https://en.wikipedia.org/wiki/Economic_impact_of_the_2026_Iran_war
For informational and educational purposes only. Not investment advice. All data sourced from publicly available sources as of March 22, 2026. — Navnoor Bawa
Cover photograph: PH2 Elliot, U.S. Navy, public domain, via Wikimedia Commons.