


How did Andurand make 20% in two weeks while Caxton lost $1.3 billion? Why did bonds sell off instead of rallying? Who placed $500 million in oil futures 15 minutes before Trump’s five-day strike pause — and what does a Columbia Law study of 93,000 prediction markets, with a 69.9% win rate running 60 standard deviations above random chance, tell us about who knew first? This is the most fully sourced reconstruction of every major Iran war trade: pre-war CFTC positioning, the three-driver bond yield selloff, six documented winning structures, ten named losers with specific dollar losses, and the complete Polymarket insider trading evidence — from “Magamyman” to Israeli criminal indictments.
Fixed Income · Global Macro · Hedge Funds · Geopolitics · Insider Trading · Prediction Markets Published March 30, 2026 · 22 min read · Every claim sourced and linked
By Navnoor Bawa · LinkedIn · YouTube — The Mathematical Trader
Prefer watching over reading? A full video overview of this piece is available here: ▶ Watch on YouTube

The consensus trade for a military conflict is well-rehearsed: buy bonds, watch yields fall, collect the safe-haven premium. Within 48 hours of the February 28 US-Israeli strikes on Iran, the 10-year Treasury yield was rising, not falling. The bond market had delivered its verdict: this shock was inflationary, not deflationary, and the playbook needed to be torn up. What followed was four weeks of simultaneous bond and equity selling that exposed exactly what every major fund had been positioned for — and punished anyone who had gotten it wrong.
This article is built from CFTC filings, regulatory letters, court records, an academic study of 93,000 prediction markets, named fund manager statements, and contemporaneous news reporting. Every specific claim is cited inline. The goal is a map precise enough to be useful for positioning decisions, not commentary.
The piece moves in seven sections: Part I establishes who was pre-positioned and how large the crude long was before the first strike. Part II explains why bonds sold off rather than rallied — three structural forces, not one. Part III documents six specific winning trade structures with the mechanics of each. Part IV examines Bridgewater’s near-miss. Part V names every major loser with specific dollar figures and the exact positioning error. Part VI covers what the evidence — exchange data, on-chain analytics, and a peer-reviewed academic study — says about informed trading in the days before and after key events. Part VII draws the structural lesson that now has two data points behind it.
Part I — The Setup: What the Pre-War CFTC Data Shows
The most important fact about the funds that made the most money is that they were already positioned before the war. The CFTC Commitment of Traders report — published March 3 and covering positions through approximately February 25 — showed that large speculators in WTI crude oil had built a net-long position of 172,000 contracts, a 33-week high. Gross longs stood at 352,000 contracts — a 34-week high and roughly double the size of gross shorts. This positioning predated the conflict by days. The smart money was not reacting to news — it had already placed the bet.
As StoneX analyst Matt Simpson wrote in the report: the 12% upside gap in WTI at Monday’s open “suggests geopolitical risk tied to Iran was not fully priced in” — meaning that even with the largest speculative long in eight months already on the books, the market had not yet reflected the full supply shock. There was room to run, and the funds already long had the best of all worlds: they had entered before the spike, and the spike had further to go.
Pre-War WTI Crude Oil Speculative Positioning — CFTC, week ending ~Feb 25, 2026
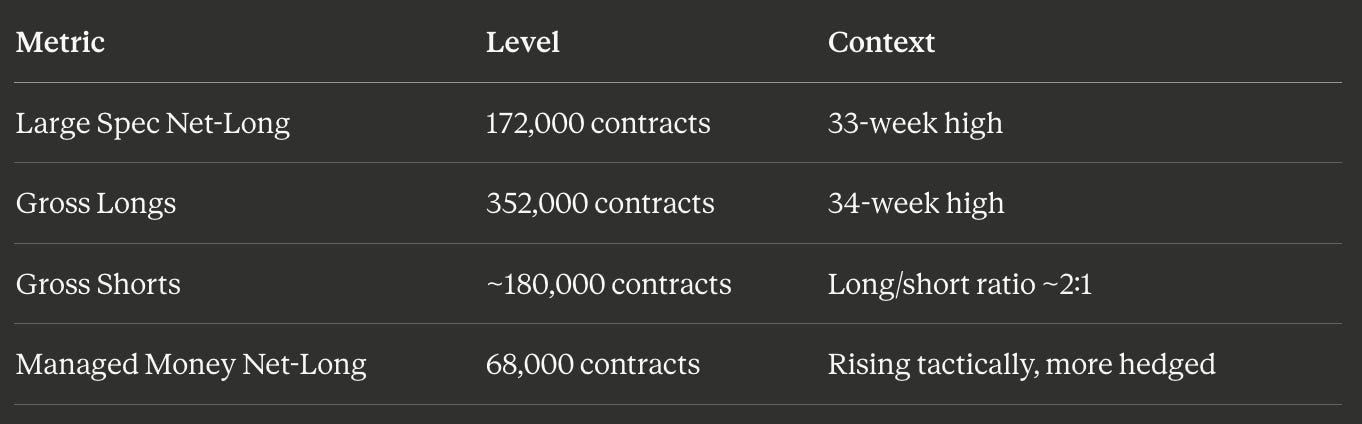
Source: CFTC via StoneX / Matt Simpson, March 3, 2026
Part II — Why Bonds Sold Off: Three Forces, Not One
Most coverage has treated the bond selloff as a simple inflation story. The actual mechanism had three simultaneous drivers — each independently significant, all operating at once.
Driver 1: Inflation Expectations
The IEA characterized the Strait of Hormuz closure as the “greatest global energy and food security challenge in history,” with tanker traffic reduced by nearly 70%. J.P. Morgan’s head of Global Commodities Strategy, Natasha Kaneva, projected regional production shut-ins approaching 7 mbd by March 15 and 12 mbd by March 22 if the Strait remained closed. The resulting oil price surge from $72 to near $120 per barrel fed directly into CPI expectations. BCA Research’s Chief Fixed Income Strategist Robert Timper told Euronews that “the aggressive bear flattening of yield curves reflects a hawkish monetary policy repricing in response to inflation fears stemming from the Iran war,” adding that “the front-end is more sensitive to changes in monetary policy and has therefore risen more than the long-end in response to investors’ anticipation of more hawkish central bank policy.” By March 18, the Fed had held rates steady but raised its 2026 inflation forecast to 2.7%, effectively removing all 2026 rate cuts from market pricing.
Driver 2: The Term Premium
Axios reported that only approximately one-fifth of the rise in the 10-year Treasury yield came from inflation expectations alone. The remainder was driven by the term premium — the extra compensation investors demand for duration risk. Three factors compounded simultaneously: fiscal expansion (the Trump administration sought $200 billion in emergency war funding, materially widening an already-large deficit), technical forced selling (leveraged funds raising cash and meeting margin calls), and fundamental uncertainty about the Fed’s policy path in an environment where inflation and recession risk were simultaneously elevated.
Driver 3: Petrodollar Recycling Collapse
This is the structural driver most market commentary has ignored. Normally, oil price surges generate enormous revenue windfalls for Gulf producers, recycled into global bond markets — buying Treasuries and European sovereign debt, providing a countervailing bid that historically cushioned bond selloffs during oil shocks. JPMorgan strategists, cited by CNBC, explained that with Strait of Hormuz shipping disrupted, those recycling flows were curtailed — removing the structural buyer that had historically absorbed duration supply during prior energy shocks. The selling pressure had no countervailing flow. This structural absence made the bond selloff more severe than historical oil shock analysis would have predicted.
Yield Surge: Feb 28 → Peak, March 2026–2Y Moved Faster Than 10Y in Every Market
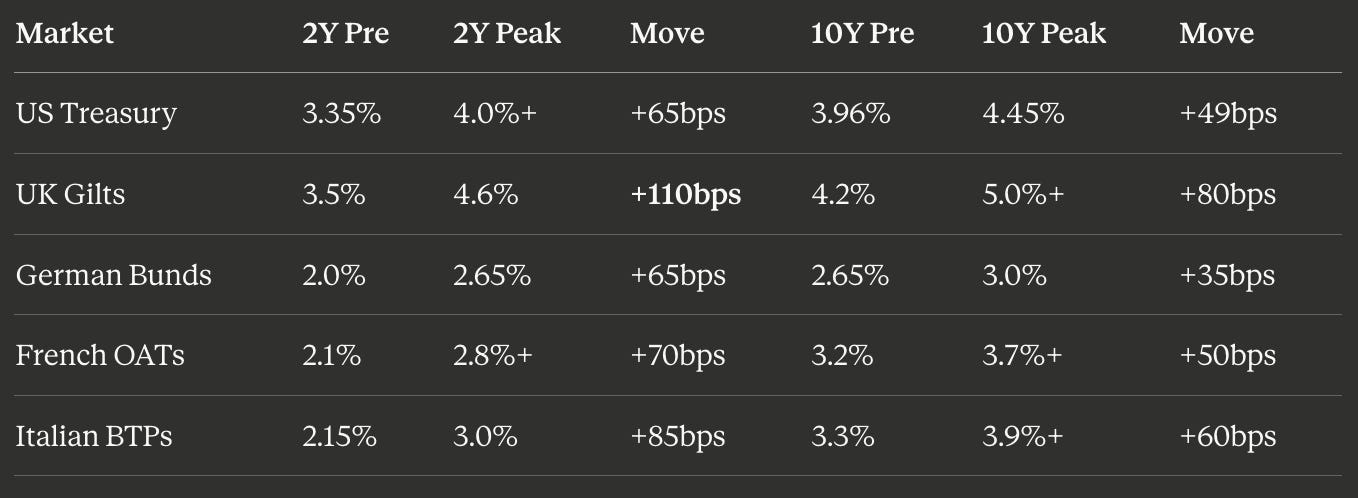
Sources: Euronews · CNBC · Axios
Part III — The Winning Trades: Evidence, Mechanics, Edge
Trade 1: Long Crude Oil — Pre-Positioned, Maximum Leverage, No Risk Cap
The most publicly documented winner was Pierre Andurand. Bloomberg reported that Andurand’s Commodities Discretionary Enhanced fund surged approximately 20% in the first half of March alone on bullish oil bets, bringing its year-to-date advance through March 13 to 19%. The structural edge is not directional luck — it is the fund’s design. Andurand operates with no fixed risk limit, a deliberate architecture that allows him to size positions in proportion to conviction. In an environment where Brent moves $10–15 per barrel per day, capped-mandate funds are structurally disadvantaged relative to uncapped ones. Andurand’s documented trading repertoire extends beyond spot futures to calendar spreads, crack spreads, and geographic spreads — all of which experienced extreme widening during the Strait disruption, generating multi-dimensional gains from a single macro thesis.
Doug King’s RCMA Capital — Merchant Commodity Fund — returned 9.5% in the five days through March 6, bringing 2026 year-to-date gains to approximately 20%. King’s background is physical commodities trading, an expertise that provides granular supply-logistics intelligence unavailable to paper-market macro funds. When the Strait closes and 200 tankers are stranded, a fund with deep physical commodity expertise reads the supply disruption differently — more precisely, earlier — than a macro fund modeling it through CPI forecasts. Steve Barclay’s Saber Capital gained 6.7% in the same one-week period, bringing 2026 returns to 12% on a $350 million book of separately managed accounts.
HedgeCo reported that discretionary macro funds were emerging as the top-performing hedge fund strategy of 2026, with firms that had deep expertise in supply-demand dynamics “able to position aggressively ahead of and during the recent oil rally.” The critical qualifier is “ahead of.” The CFTC data confirmed this: the net-long was a 33-week high before the first bomb fell.
SLGI Asset Management CIO Chhad Aul told BNN Bloomberg: “Positions in crude oil have been by far the best hedge. It’s something we’ve tactically held through long positions. Even as this conflict reaches some sort of resolution, we expect some risk premium to remain in oil prices.”
Trade 2: Short UK Gilts — The Highest-Beta Developed-Market Bond
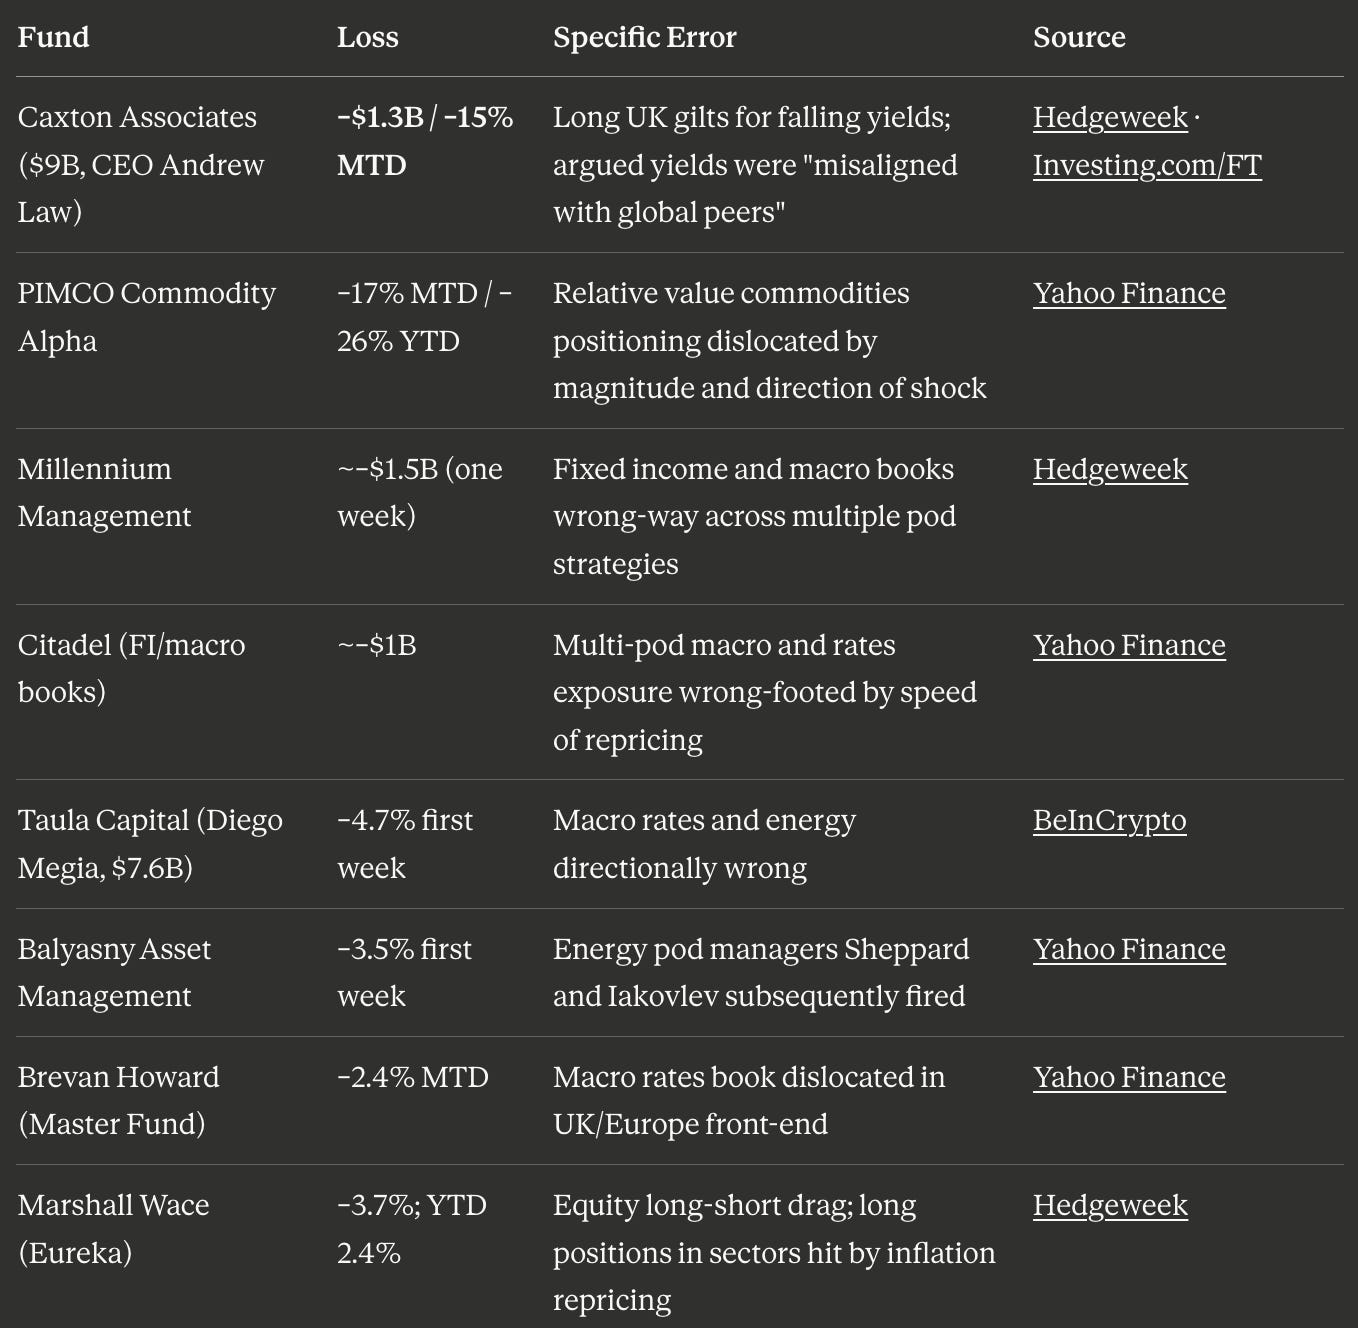
The winning side of this trade was short UK gilts. The proof comes not from a fund that disclosed its profits — none did — but from the documented scale of the funds that were on the wrong side. No loss in this episode was larger or more precisely attributable to a single wrong-way call than Caxton Associates’ long gilt position. Hedgeweek’s detailed reporting on Caxton Associates’ losses confirmed that the firm’s $9 billion macro fund, led by CEO Andrew Law, entered the year constructive on UK government bonds, arguing yields were misaligned with global peers and likely to fall. This single directional conviction — long UK gilts for falling yields — was the primary source of Caxton’s $1.3 billion drawdown. Investing.com, citing the Financial Times, confirmed the fund’s $9 billion Macro strategy declined 7% in the opening week alone, bringing total losses to $1.3 billion — approximately 15% of AUM month-to-date.
The structural logic of why UK gilts were the highest-beta short was articulated precisely by Timper: “Rate hikes in the UK are more likely than elsewhere because inflation has been more elevated than elsewhere, and the risk of inflation expectations unanchoring is therefore higher.” UK inflation was the highest in the G7 entering the war. UK rates were the highest in the G7. The fiscal position was already strained. AJ Bell’s investment director Russ Mould highlighted that the 10-year gilt was near 5% for only the third time since 2008, while the 2-year comfortably exceeded the Bank of England base rate. The 2-year gilt surged 110 basis points — more than any other developed-market bond — in under three weeks.
Trade 3: Long Swaption Straddles — The Most Technically Validated Structure
Nomura’s Global Head of Quantitative Strategies Tony Morris published analysis confirming that long EUR and USD swaption straddles — using longer expiries and tenors such as 10y10y — outperformed both the global equities index and the global bonds index from February 27 through March 23. The pattern was nearly identical to the Russia-Ukraine inflation shock of February 2022. Three structural profit mechanisms operated simultaneously:
Long gamma (realized volatility capture). As the UK 2-year gilt surged 110 basis points in three weeks, swaption straddle holders captured gains from realized rate volatility. Unlike bonds — which lose money when rates rise — and unlike simple bond shorts — which generate directional returns but lose to carry and rollover — swaptions embed significant positive convexity, meaning their gains from realized volatility outpace their cost of holding.
Long vega (implied volatility). In crisis conditions, the implied volatility of interest rates rises sharply as investors bid up protection. Swaption straddles are directly long this effect; bonds have zero direct implied volatility exposure. Steven Loeys, Head of Macro QIS Structuring at Nomura, noted that longer-expiry swaption straddles carry significantly less negative carry than comparable straddles in bond futures or equities, which are only liquid at shorter expiries — making the strategy efficient in exactly the kind of low-to-high volatility regime the Iran war created.
Two-way directionality. A bond short profits only if rates rise — and is punished severely on any ceasefire headline. A swaption straddle profits from volatility in either direction, and benefits from the volatility of the reversal as well. When Trump’s March 23 Truth Social post caused a brief bond rally, swaption straddle holders were not stopped out; they were collecting from the volatility of the swing itself.
“Most portfolios are materially short interest rate volatility, which is problematic during a market downturn, but long positions in swaptions can help.” — Tony Morris, Global Head of Quantitative Strategies, Nomura
Nomura’s data shows long swaption straddle portfolios have delivered positive returns during every major credit drawdown since 2008 — the GFC (2008–9), the Eurozone crisis (2011), the oilpatch crisis (2015–16), COVID (2020), Russia-Ukraine inflation shock (2022), and now the Iran war (2026). This is the clearest multi-cycle validation of any single fixed-income hedging structure in the post-GFC era.
Trade 4: Energy-to-Grains as an Inflation Proxy
By mid-March 2026, managed money had shifted to a four-year high net-long position in grains at over 635,000 contracts. The mechanism is the biofuel floor: at $120 Brent, corn cannot fall below a certain price without becoming irresistibly cheap feedstock for Sustainable Aviation Fuel and renewable diesel production. The 2026 SAF mandate created a structural linkage between energy and agricultural prices that did not exist in prior oil shocks. Gulf countries account for roughly 45% of global sulfur supply — a critical fertilizer input — with the Strait disruption projected to spike fertilizer costs across the global agricultural complex. Long grain positions were therefore supported by two simultaneous thesis legs: oil-price-driven biofuel demand and fertilizer supply constraint — both caused by the same shock, both moving in the same direction.
Trade 5: D.E. Shaw Oculus — Systematic Volatility Regime Capture
D.E. Shaw’s Oculus fund gained 2.2% in the first week of March, bringing its year-to-date return to 5.1%, against an industry average loss of more than 2%. The Oculus fund has not had a losing year since 2004. Detailed analysis of Oculus’s trading approach describes “systematic capture of volatility regime shifts” — quant models specifically calibrated to recognize transitions from low-volatility to high-volatility environments and to reposition accordingly. The Iran war was a near-perfect regime transition: VIX and rate volatility spiked simultaneously, correlations broke down, and risk premia repriced violently across multiple asset classes in a compressed timeframe. The hybrid systematic-discretionary model — quant models providing objective regime classification, discretionary overlay enabling rapid repositioning — gave Oculus a specific advantage over both pure-quant funds (which update regime estimates slowly) and pure-discretionary funds (which can be held back by confirmation bias or conviction anchoring).
Trade 6: Jain Global — Options Tail Architecture as Structural Defence
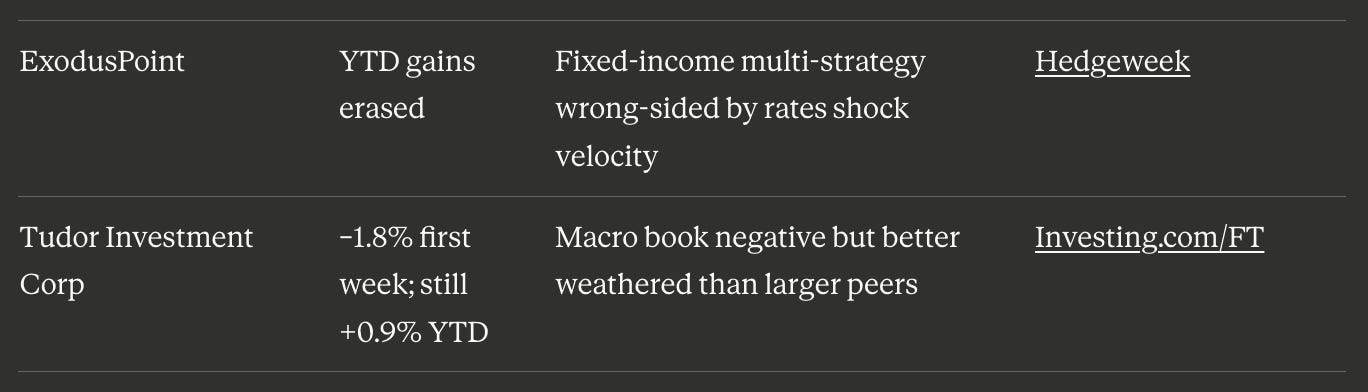
Jain Global posted approximately +0.1% during the same week that Balyasny was down 3.5% and ExodusPoint had erased its year-to-date gains. The fund had underperformed peers in January and February — suggesting the flat result was structural, not tactical positioning for the conflict. The fund’s 13F filing as of September 2025 reveals options-based tail hedging across US equities, EM, China, credit, and financials — specifically including SPDR Gold Trust (GLD) at approximately $5.15 billion total exposure (roughly 24% of the 13F portfolio), structured as a straddle-like construction with both long calls and long puts rather than a directional gold bet. This options architecture — effectively a macro volatility hedge — provided protection during the simultaneous bond-equity drawdown precisely because it was structurally long volatility regardless of direction. The fund’s “centre book,” which algorithmically replicates the most successful strategies across its 50+ trading teams, created a meta-layer of diversification that prevented catastrophic concentration in any single wrong-way call.
Part IV — Bridgewater: Why Pure Alpha Lost Less Than 1%
Between the winners and the loser scoreboard sits one fund that belongs to neither category cleanly: Bridgewater’s Pure Alpha, which lost almost nothing. Understanding why it survived without winning tells you as much about structural portfolio design as any of the six winning trades above.
Bridgewater’s Pure Alpha fund lost less than 1% through mid-March, against an industry average of more than 2% negative. Two documented factors explain the outlier.
First, a public macro warning implying pre-existing caution. In January 2026, co-CIO Greg Jensen publicly stated that 2026 would be a “dangerous year for interest rates.” This was not a prediction of war — it was a correct identification of the macro vulnerability that the war then violently activated, and public evidence that Bridgewater entered the conflict already holding lower net bond duration risk than the consensus.
Second, structural diversification at scale. Pure Alpha typically holds 30–40 simultaneous uncorrelated positions across bonds, currencies, equities, and commodities globally. The UK gilt short that was lethal for Caxton was, in Pure Alpha’s architecture, one of 30–40 roughly equal risk factors. When one factor moves catastrophically, the remaining 29–39 absorb the shock. The fund had also posted a 33% gain in 2025 — entering the conflict with strong capital cushion and deliberately reduced AUM that preserved flexibility and avoided crowded trades.
Part V — The Loser Scoreboard: Named, Sourced, Specific
HFR President Ken Heinz summed up the mood across the industry: “If I were to sum up the sentiment across the hedge fund world it’s ‘right now, we’re all oil traders.’” HFR data cited by CNBC placed the average hedge fund return at approximately –2.2% for the period, the worst monthly performance since Liberation Day. What follows is every major named loss in the public record — fund, dollar figure, and the specific positioning error that caused it, each sourced to primary reporting.
Part VI — The TACO Trade: Every Primary Document, Sourced in Full
The term “TACO trade” — shorthand for Trump Announcement Crude Oil, coined on financial social media after the pattern became visible — refers to the category of trades that profited specifically from apparent advance knowledge of presidential announcements affecting oil prices. The Iran war introduced a third category of market winner that sits at the intersection of geopolitical intelligence, information asymmetry, and alleged criminal conduct. Unlike the six winning structures in Part III, which required correct macro analysis, the trades documented here required only one thing: knowing what was coming before it was announced.
The Documented Timeline: Monday, March 23, 2026
6:49–6:50 a.m. ET: The Financial Times reported approximately 6,200 Brent and WTI crude oil contracts changed hands in a single one-minute window — approximately 15 minutes before Trump’s Truth Social post. The trades were directionally precise: short oil, long equity futures. Reuters separately reported, using LSEG exchange data, that 5,100 lots of Brent and WTI contracts worth well over $500 million changed hands in that same one-minute window — an approximately 2,000-lot spike in Brent futures volume dwarfing anything else logged that morning. The FT and Reuters figures differ modestly due to methodology; both point to the same anomalous cluster of directional selling.
~6:50–7:00 a.m. ET: Data flagged by Unusual Whales indicated traders bought approximately $1.5 billion in S&P 500 futures and sold about $192 million in oil (WTI CL) futures in the minutes before the announcement, with orders described as four to six times larger than anything else moving through the market at that hour, in an otherwise quiet premarket session with no scheduled economic data or Fed speakers. Senator Murphy, who amplified the Unusual Whales data, noted the $1.5 billion figure represents notional futures exposure — the face value of the contracts — rather than cash actually deployed.
~7:05 a.m. ET: Trump posted on Truth Social claiming “productive conversations” with Tehran and announcing a five-day pause on planned strikes against Iranian power plants and energy infrastructure. Equity futures jumped more than 2.5%. Brent crude settled down 10.92% to $99.94 per barrel — its first close below $100 since March 11 — while WTI settled down 10.28% to $88.13; at the intraday peak of the move, Brent had plunged as much as 13–15% before partially recovering. CNBC confirmed Brent fell close to 11% from a Friday high above $112, posting its biggest single-day drop since March 10. Over 13,000 lots of Brent and WTI futures — equivalent to 13 million barrels — changed hands in the 60 seconds immediately after the post, dwarfing the pre-announcement spike.
The Political Response
Senator Chris Murphy (D-Conn.) publicly called the move “mindblowing corruption” on March 25. Murphy and Representative Greg Casar had already introduced the Banning Event Trading on Sensitive Operations and Federal Functions (BETS OFF) Act on March 17 — legislation that would outlaw wagers on government actions, terrorism, war, assassination, and events where the bettor controls or has advance knowledge of the outcome.
Nobel Prize-winning economist Paul Krugman wrote on Substack on March 24 that the trading spike was otherwise “baffling,” and that there was “an obvious explanation: Somebody close to Trump knew what he was about to do, and exploited that inside information to make huge, instant profits.” He used a harder word than “insider trading” for the conduct: “We have another word for situations in which people with access to confidential information regarding national security — such as plans to bomb or not to bomb another country — exploit that information for profit. That word is treason.” He raised a harder question still, whether the prospect of profit may itself be shaping policy: “Are decisions about war and peace in part serving the cause of market manipulation rather than the national interest?”
The Academic Record
Joshua Mitts (David J. Greenwald Professor of Law, Columbia University) and Moran Ofir (Professor of Law and Finance, University of Haifa) published the first systematic statistical study of informed trading on Polymarket, analyzing over 93,000 distinct markets and nearly 50,000 unique wallet addresses from February 2024 through February 2026. Their composite score measured cross-sectional bet size, within-trader bet size, profitability, pre-event timing, and directional concentration. The study identified 210,718 suspicious wallet-market pairs, in which flagged traders achieved a 69.9% win rate — a result that exceeds the null distribution of random chance by more than 60 standard deviations under a permutation test. The total amount won by suspicious accounts across the study period was $143 million.
The Named Cases
“Magamyman”: NPR reported that a Polymarket account trading under “Magamyman” placed its first trade on the “US strikes Iran by February 28?” contract 71 minutes before the news broke, when markets implied only a 17% probability. The account’s profits totaled approximately $553,000. Five other newly created wallets placed nearly identical trades in the same narrow window, collectively earning approximately $1.2 million.
The Iran serial trader: CNN reported that Bubblemaps analytics identified a single trader who had made nearly $1 million from dozens of well-timed Polymarket bets correctly predicting US and Israeli military actions against Iran, with an overall win rate of 83% and a 93% win rate on trades over $10,000 — across wagers placed hours before Israeli strikes in October 2024, US airstrikes in June 2025, and the February 28, 2026 joint strike. Georgia State finance professor Todd Phillips, a former CFTC advisory board member, told CNN: “Having win rates in the 80% to 90% range is just too good to be true. I look at this, and I think something fishy is going on.”
The ceasefire accounts: Eight new Polymarket accounts created around March 21 collectively bet approximately $70,000 on a US-Iran ceasefire before March 31, positioning themselves to make nearly $820,000 if a deal materialized.
The 38-account cluster: On-chain analyst “Andrew 10 GWEI” documented 38 accounts believed to belong to one person, which collectively netted more than $2 million by correctly betting on the February 28 strikes, with the accounts beginning to load cryptocurrency on February 22 and placing bets between 11:00 and 12:00 GMT on February 27–24 hours before the strikes.
The Regulatory and Criminal Response
CFTC Chairman Michael Selig told the Washington Reporter: “There’s this false media narrative that CFTC-regulated markets are the Wild West and have no regulation and that’s blatantly false.” But NBC News reported no American has yet faced federal charges for Iran war-related insider trading, and CFTC staffing shortages are limiting enforcement capacity. Former CFTC whistleblower office head Chris Ehrman told NBC: without deterrent enforcement, self-regulation amounts to “whipping them with a wet noodle.”
📊 Want Deeper Quantitative Analysis?
This research involved significant data collection, source verification, and cross-referencing across CFTC filings, court records, exchange data, academic studies, and primary reporting. If you found value in this deep-dive, I publish exclusive quantitative research, trading strategies, and institutional-grade analysis on Patreon.
The next piece is already live for members:
→ Read the latest exclusive: Macro Strategy Deep-Dive
By joining, you’ll be supporting my work and motivating me to publish more content like this.
→ Join the Patreon community here
Part VII — The Structural Lesson
The Iran war has now produced the second major data point — after 2022’s Russia-Ukraine inflation shock — establishing a structural break in the bond-equity correlation. Nomura states this explicitly: “For decades, investors have embraced the asset allocation doctrine that bonds and equities belong together, believing one should work when the other failed. But the Iran war undermines that assumption, as did the inflation shock of 2022, since both bonds and equities experienced drawdowns at the same time.”
Allianz chief economic adviser Mohamed El-Erian stated on CNBC: “The bond market has said, ‘I’m more worried about inflation, than I am about growth, than I am about flight to quality.’” Bloomberg’s end-of-March assessment: “Market declines sparked by the Iran war are morphing into a full-blown rout across Wall Street.” The S&P 500 had fallen for five consecutive weeks — its longest losing streak since 2022. The OECD now forecasts US inflation at 4.2% for 2026, 1.2 percentage points above pre-war projections.
The three structures most validated by this episode:
Long volatility (swaption straddles): outperformed both equities and bonds across two consecutive inflationary geopolitical shocks.
Real asset exposure (energy and commodity longs): the asset that gains most when the causal driver of the inflation appreciates is the direct energy exposure itself, not the downstream rate hedge.
Systematic diversification at scale: the funds with the largest losses had high-conviction directional bets in exactly the wrong direction. Pure Alpha and Oculus held large numbers of uncorrelated positions, none dominant.
The mechanism was not random. It was structural. And now it has happened twice in four years.
Full Source List
Euronews — Bond yields surge as Iran war stirs inflation fears (Quirino Mealha, March 26, 2026)
Nomura Connects — Iran War Shows How Swaptions Work, and Bonds Fail, as a Hedge
StoneX — COT Report, WTI Crude Oil Positioning (Matt Simpson, March 3, 2026)
CFTC — Commitments of Traders Financial Futures (positions as of March 17, 2026)
Jingletree / Business Insider — Informed traders netted $143M in anomalous Polymarket profit
IBTimes UK — Senator Murphy alleges insider trading after $1.5B futures bet
Paul Krugman Substack — “Treason in the Futures Markets” (March 24, 2026)
CNN Business — Oil prices drop 10.92% after Trump postpones Iran strikes (March 23, 2026)
CNBC — Brent crude fell close to 11% after Trump’s Truth Social pause post (March 23, 2026)
Axios — Mysterious trading patterns follow Trump into war (March 25, 2026)
NBC News — Insider trading concerns: Can anyone police the bets?
CNN — Trader made nearly $1M on Polymarket with remarkably accurate Iran bets
Al Jazeera — Large Polymarket, Wall Street bets on Trump’s war news under scrutiny
WSWS — Lucrative oil futures and predictive market bets on Iran war expose insider trading scheme
NPR — ‘Magamyman’ made $553,000 on death of Iran’s supreme leader (Bobby Allyn, March 1, 2026)
Investing.com / FT — Caxton loses $600M as Middle East war triggers hedge fund volatility
Bloomberg — Andurand fund surged 20% by mid-March on oil bets
Bloomberg — Funds run by Doug King, Ozer gain on commodities turmoil
Bloomberg — Wall Street selloff deepens; Iran war hits stocks, bonds, Bitcoin
CNBC — Treasury yields rise as ceasefire uncertainty persists
Axios — Borrowing costs surge amid Iran war (March 27, 2026)
Substack (Navnoor Bawa) — How D.E. Shaw Generated $11.1B: The Oculus Strategy
Substack (Navnoor Bawa) — Bobby Jain’s New Hedge Fund: Complete 13F Breakdown
FinancialContent — Energy-Grain Parity: How $120 Oil Is Reshaping Global Agriculture
BNN Bloomberg — Market Outlook, SLGI CIO Chhad Aul interview
Hedge Fund Journal — Pierre Andurand: Trading Methodology and Fund Architecture
Investing.com — CTAs build equity shorts as Treasury selling persists (BofA)
Young & Calculated Substack — Caxton’s $1.3bn Drawdown, Millennium’s Credit Build
Written by Navnoor Bawa — Quantitative Researcher · LinkedIn · YouTube · Patreon · Latest Exclusive
Cover photograph: MC2 Bryan Blair, public domain, via Wikimedia Commons.
Cover photograph: MC2 Bryan Blair, public domain, via Wikimedia Commons.