


How institutional traders captured billions from negative prices, quality spreads, and floating storage during unprecedented market volatility. Documented with annual reports, court filings, and verified trader interviews.
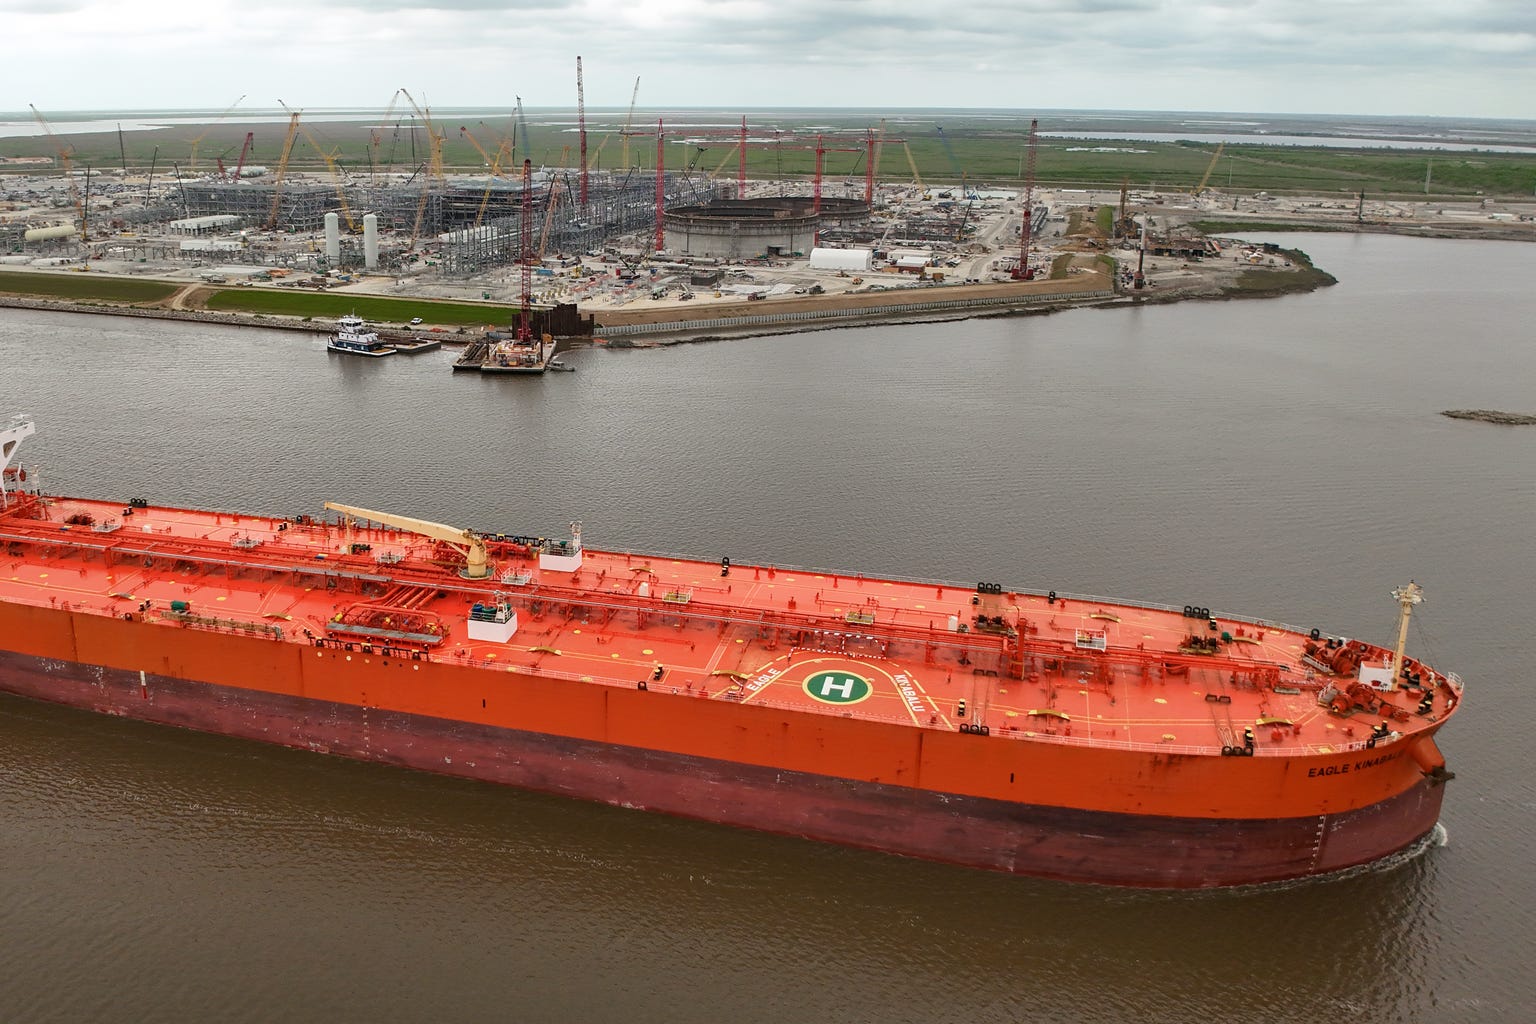
Between 2020 and 2022, crude oil markets experienced the most violent price dislocations in history. WTI futures crashed to -$37.63/barrel in April 2020. Storage capacity became more valuable than the oil itself. Quality spreads between light-sweet and heavy-sour crudes widened significantly during volatility. Floating storage rates exploded over 500% in weeks.
Trading houses, hedge funds, and individual traders extracted extraordinary profits by exploiting these market mechanics. Vitol alone made $15.1 billion in 2022 — matching its combined earnings from the previous six years. Here’s the documented evidence of who made money, how much they made, and exactly how they did it.
Trading House Profits: 2020–2022 Performance
Vitol (2022): $15.1 billion net profit, confirmed by Wikipedia citing Financial Times reporting and verified by Reuters/Market Screener. Offshore Technology reported this matched Vitol’s combined earnings for the previous six years. OilPrice.com confirmed the figure represented a 3x increase from 2021’s $4 billion.
Trafigura: FY2020 net profit of $1.6 billion, rising to $3.075 billion in FY2021, documented in official 2021 annual report and verified by Wikipedia. The company stated: “The oil markets faced unprecedented conditions, including negative oil prices in April 2020. Trafigura’s expertise in physical trading and logistics allowed it to capitalize on these dislocations.”
Goldman Sachs: The commodities trading desk made $1 billion in H1 2020 — the best start to a year in over a decade. The FICC division posted net revenues of $21.2 billion in 2020, the highest in a decade per Goldman Sachs investor relations.
Three Profit Mechanisms: How the Money Was Made
1. Negative Price Arbitrage
When WTI futures crashed to -$37.63/barrel on April 20, 2020, traders who sold futures at positive prices and bought them back at negative prices captured the entire spread plus the negative value. Storage capacity constraints drove the price below zero — sellers literally paid buyers to take oil off their hands.
2. Contango Storage Plays
The futures curve entered deep contango (near-term prices below future prices). Traders bought physical crude at $20/barrel, stored it in tankers at sea, and simultaneously sold futures at $40+ for delivery months later. VLCC charter rates exploded from $40,000/day to $250,000/day as documented by gCaptain, with global floating storage peaking at 215 million barrels in June 2020.
3. Quality Spread Widening
API gravity and sulfur content determine crude value. World Bank ESMAP research demonstrates that each 1% increase in sulfur content lowers crude price by $0.056 per dollar of Brent benchmark — approximately $3.92/barrel when Brent trades at $70. During 2020–2022 volatility, quality differentials between light-sweet benchmarks (like WTI) and heavy-sour grades (like WCS, Maya) widened from typical $5–10/barrel to $15–25/barrel in specific markets, creating systematic arbitrage opportunities for traders with refining capacity and storage access.
Case Study: Vega Capital London — $660 Million in Hours
On April 20, 2020, when WTI crashed to -$37.63/barrel, nine traders affiliated with Vega Capital London Ltd. made $660 million in a few hours. Bloomberg Businessweek’s exclusive investigation documented the trade:
Named Traders and Individual Profits:
Aristos Demetriou, Elliott Pickering, Connor Younger: $100+ million each
Christopher Roase: ~$90 million
Paul “Cuddles” Commins: ~$30 million
Strategy: Sold futures contracts intensely throughout the day, then bought them back when prices went negative. The group dominated the final 30 minutes of trading, accounting for roughly 30% of total WTI market volume — remarkable in a market normally dominated by BP, Glencore, and JPMorgan.
A federal lawsuit filed against the traders alleges their trades showed 96.2% to 99.7% correlation, moving “in the same direction at the very same time.” The case revealed WhatsApp messages including “I wanna’ see negative WTI prices” and post-trade warnings to “Please don’t tell anyone what happened today, lads.” A trial is ongoing.
Pierre Andurand: Predicting the Impossible
Multiple publications verified that Andurand Capital founder Pierre Andurand predicted negative oil prices in February 2020, months before the crash. On the morning of April 20, 2020, he tweeted: “There is no limit to the downside to prices when inventories and pipelines are full. Negative prices are possible.”
That day, WTI crashed to an intraday low of -$40.32 before settling at -$37.63. OilPrice.com reported Andurand’s fund returned 154% in 2020, with most gains concentrated in March (+63.5%) and April. The fund also gained 87% in 2021.
Andy Hall: Three Decades of Oil Trading Innovation
Wikipedia describes Andrew Hall as “the most successful oil trader of his generation.” His career demonstrates how understanding market structure creates systematic edge:
1990 — Inventing Floating Storage: Hall pioneered using tankers as floating storage during contango markets, documented by MarketSWiki. Buy discounted crude, store at sea, lock in higher future prices through derivatives.
2003–2008 — The $147 Trade: Purchased long-term oil contracts at $25–30/barrel. Held through oil’s climb to $147 in July 2008, earning a $100 million bonus at Citigroup’s Phibro unit.
2008–2017 — Astenbeck Capital: Raised more than $3 billion in AUM, reported by Insider Monkey. The fund delivered consistent returns before closing in 2017, announced by Bloomberg.
Regulatory Evidence: Enforcement Actions
Market manipulation cases provide court-documented evidence of specific trading strategies:
Trafigura Trading LLC (CFTC, June 2024)
Settlement: $55 million
The CFTC found Trafigura manipulated the U.S. Gulf Coast high-sulfur fuel oil benchmark in February 2017 and misappropriated material nonpublic information related to gasoline trading. Legal Dive reported this was the first time the CFTC charged a company for using NDAs to impede whistleblower communications.
Optiver Holding BV (CFTC, 2012)
Settlement: $14 million
Manipulating oil markets through “banging the close” tactics, reported by Fox Business and documented by the CFTC.
SemGroup/Thomas Kivisto (SEC, 2011)
Settlement: $225,000 civil penalty + $1.1 million forfeiture
SemGroup collapsed in July 2008 with $2.7 billion in crude oil trading losses. Charges involved misleading investors in regulatory filings, documented by the SEC.
Why These Opportunities Persist
Oil market structure creates recurring profit opportunities despite regulatory oversight:
Physical Constraints
Refinery configurations are fixed capital investments — upgrading to process heavier, sourer crudes costs $1–3 billion and takes 3–5 years. World Bank ESMAP research demonstrates that each extra degree of API gravity raises relative crude price by $0.007 per dollar of Brent, while each 1% of sulfur lowers price by $0.056 per dollar of Brent. At $70 Brent, this translates to approximately $0.49/barrel per API degree and $3.92/barrel per 1% sulfur. These differentials widen during volatility, creating systematic arbitrage.
Storage Limitations
Cushing, Oklahoma storage capacity is finite. When production exceeds consumption, storage fills rapidly, creating extreme price moves. The 2020 crash demonstrated what happens when storage approaches 100% capacity — prices can go negative because physical constraints dominate financial incentives.
Regional Imbalances
Transportation costs and infrastructure constraints prevent instant arbitrage. Academic research documents the historical “Asia premium” phenomenon — during the 1990s and early 2000s, Asian markets paid $1.00-$1.50/barrel premiums over European/U.S. markets due to supply-demand imbalances and limited supplier diversity. By 2010, this pattern had begun reversing as Asian buying power increased.
Information Asymmetry
Physical traders maintain edge through real-time cargo movements, refinery maintenance schedules, and industry relationships — knowledge that can’t be replicated through market data alone.
The 2020–2022 period wasn’t an anomaly — it was an extreme manifestation of oil market structure. Quality differentials, storage constraints, and regional imbalances create recurring opportunities. Traders with capital, market access, and understanding of these mechanics continue to extract profits during volatility.
Follow my quantitative trading analysis on YouTube: The Mathematical Trader
Connect on LinkedIn | Follow on Twitter: @navnoorquant
All profit figures verified against annual reports, regulatory filings, and primary source journalism. Interview quotes attributed to named sources. January 2026.
Cover photograph: Quintin Soloviev, CC0, via Wikimedia Commons.
Great article!