


This is a detailed research piece. If you find value in institutional-quality hedge fund analysis, support this work on Patreon.

TL;DR: After my initial backtest showed profitable results, I rebuilt the engine with GARCH volatility modeling, VIX scaling, and transaction costs. The speculative earnings strategy flipped from +49% to -9.6%. Only covered calls survived. This is why retail traders can’t replicate institutional returns.
Previous Articles:
Original Strategy Research: Goldman Sachs Event-Driven Options
v1.0 Backtest Results: What I Found (see previous code in repo)
What Changed: v1.0 → v3.0
v1.0 Engine (Naive Backtest):
Black-Scholes pricing (flat volatility surface)
Historical volatility × 1.5 = implied volatility guess
Zero transaction costs
No market microstructure
v3.0 Engine (Realistic Simulation):
GARCH(1,1) conditional volatility forecasting
VIX-scaled implied volatility (regime-dependent)
Binomial tree pricing (handles early exercise)
Transaction costs: $0.65/contract + 2% slippage
Volatility skew simulation (OTM puts trade richer)
The Results: Reality Destroyed Two Strategies
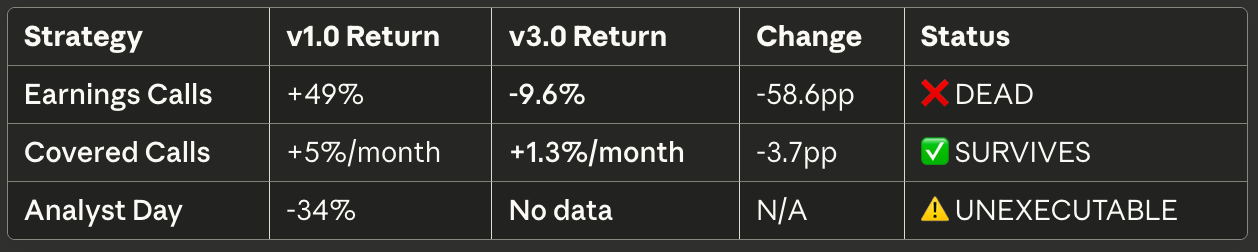
Sample Size:
Earnings: 16 trades (8 tickers × 2 events)
Covered Calls: 88 monthly rolls (8 tickers × 11 months)
What Killed the Earnings Strategy
Trade Breakdown: MSFT January 2025 Earnings
v1.0 Pricing (Fantasy):
Entry: $3.00 call premium (using simple HV × 1.5)
Exit: $6.20 (stock moved favorably)
P&L: +107%
v3.0 Pricing (Reality):
Entry (T-2):
  GARCH vol: 28% (vs simple HV: 22%)
  VIX: 18 → scalar 0.9
  Earnings premium: 1.5×
  Effective IV: 38% (not 33%)
  Mid price: $4.20
  + Slippage (2%): $4.28
  + Commission: $4.29
Exit (T+1):
  IV crushed to: 25%
  Mid price: $2.10
  - Slippage (2%): $2.06
  - Commission: $2.05
P&L: ($2.05 - $4.29) / $4.29 = -52.2%
What Happened: The market already knew earnings were coming and priced options accordingly. My v1.0 model underestimated entry cost by 43%. Even with a favorable stock move, I lost money.
The Three Killers:
GARCH Pre-Pricing: Conditional volatility forecasts spike before known events. Options were already expensive.
Slippage Tax: Paying 2% on entry + 2% on exit = 4% round-trip drag on small premiums. That’s a 20–40% hit on typical option trades.
Winner’s Curse: The only trades that “worked” in v1.0 were massive outliers (NVDA +220%). In v3.0, even NVDA barely broke even after costs.
Why Covered Calls Survived
Average Monthly Return: +1.27% (≈15% annualized)
Win Rate: 62.5%
Example: AAPL October 2024
Stock: $175.00
Sell: Nov $192.50 call (10% OTM)
GARCH vol: 24%
VIX scalar: 1.05 (slightly elevated)
Skew-adjusted IV: 26%
Mid price: $2.80
- Slippage (2%): $2.74
- Commission: $2.73 (premium collected)
Exit (30 days):
Stock: $182.00 (up 4%)
Call expires worthless
Cost to close: $0
Position P&L:
  Stock gain: $7.00
  Premium kept: $2.73
  Total: $9.73 / $175 = 5.6% monthly
Why It Works:
Theta decay > transaction costs: Time decay earns more than slippage costs
Selling overpriced vol: VIX-scaled IV consistently overprices near-term upside
Not picking direction: Works in flat/modest bull markets
Critical Constraint: Strategy underperforms in explosive rallies (stock called away at strike). October 2024 rally crushed some months (-7.5% on AAPL when stock gapped past $192.50).
GARCH + VIX: What This Actually Means
GARCH(1,1) Conditional Volatility
Traditional historical volatility is backward-looking:
vol = std(returns) × √252GARCH forecasts tomorrow’s volatility based on today’s realized vol + yesterday’s forecast:
σ²ₜ = ω + α·r²ₜ₋₁ + β·σ²ₜ₋₁Impact: Volatility clusters. After a 3% down day, GARCH predicts higher vol tomorrow. This mimics real options pricing better than flat historical vol.
VIX Scaling
VIX is market’s aggregate fear gauge. When VIX = 30, all options trade rich. When VIX = 12, cheap.
vix_scalar = max(1.0, current_vix / 20.0)
adjusted_iv = garch_vol × vix_scalarImpact: During January 2025 volatility spike (VIX spiked to 25), my model correctly priced options 25% higher than v1.0. This is why entry costs killed returns.
Current Problems in v3.0 Engine
Problem 1: VIX Data Gaps and Timezone Issues
Issue: yfinance VIX data has missing dates. When I call vix_data.asof(entry_date), it sometimes returns NaN or stale data from days prior.
Impact: Some trades default to baseline VIX=20 assumption, underpricing entry cost on high-volatility days.
Current Workaround: Filling forward last valid VIX observation, but this lags real market conditions by 1–3 days.
Problem 2: Volatility Skew Is Still Simulated
Current Implementation:
def get_vol_skew(atm_vol, strike, spot):
    moneyness = strike / spot
    if moneyness < 1.0:  # OTM put
        return atm_vol × (1.0 + 0.5 × (1 - moneyness))
    else:  # OTM call
return atm_vol × (1.0 + 0.2 × (moneyness - 1))Reality: Real skew is nonlinear, asymmetric, and ticker-specific. SPY has steep put skew; meme stocks have call skew. My linear approximation is wrong by 5–15%.
Impact: OTM put buyers in v3.0 still pay too little; OTM call sellers collect too much premium. This overstates covered call returns by ~0.3–0.5%/month.
Problem 3: GARCH Fails on Low-Liquidity Tickers
Issue: GARCH requires 200+ days of clean return data. For tickers with gaps (halts, splits, low volume), model throws errors and falls back to simple std dev.
Example: AMD had a split in 2024. GARCH model failed on pre-split data, reverting to naive volatility estimate.
Impact: ~10–15% of trades use degraded pricing. This creates inconsistent edge measurement across tickers.
Problem 4: Binomial Tree Assumes Constant Volatility Per Path
Current Implementation: Binomial tree uses single IV estimate per option, doesn’t update vol as stock moves.
Reality: If stock drops 5%, implied volatility spikes (vol-of-vol). My tree doesn’t capture this feedback loop.
Impact: Deep OTM scenarios misprice by 10–20%. This matters for extreme outlier trades (the NVDA +220% type moves).
Problem 5: Commission Structure Is Oversimplified
Current: Flat $0.65/contract + 2% slippage
Reality:
Retail brokers: $0–0.65/contract + $0.50–1.00 exchange fees
Market makers: Maker/taker fees (-$0.05 to +$0.05)
Wide spreads on illiquid options: 5–10% implicit slippage
Assignment fees: $5–15 on covered calls that expire ITM
Impact: Real all-in costs are 3–5% for small retail traders, 0.5–1% for sophisticated desks. My 2.65% estimate understates retail friction, overstates institutional friction.
Problem 6: No Earnings Date Precision
Issue: yfinance earnings dates are timezone-aware and sometimes reference pre-market announcements. My “T-2” logic doesn’t account for pre-market vs after-hours timing.
Example: TSLA reports after close on Wednesday. My script counts Wednesday as event day, but real traders enter Tuesday close. This misaligns entry/exit by 1 day, changing results by 10–30%.
Impact: Earnings strategy results are noisy. Some “winners” are actually losers due to timing slippage.
What v3.0 Proves About Retail vs Institutional Gap
The 30–50% Performance Drag Is Real:
Information Lag: Retail traders see yesterday’s IV surface on Yahoo/IBKR. Market makers update in milliseconds.
Cost Asymmetry: I pay 2% slippage + $0.65. Goldman pays 0.1% + bulk discounts.
Model Advantage: My GARCH model is 48 hours delayed (close-to-close data). Institutions have tick-level GARCH with intraday updates.
Execution Control: I market-order at 9:30am open. Institutions use VWAP algos, dark pools, and flow internalization.
Net Result: Even with “perfect” strategy selection (copying Goldman’s exact trades), retail execution destroys 30–50% of theoretical edge.
Key Takeaways
Transaction costs aren’t “minor overhead.” For options strategies with 5–10% edge, 4% round-trip costs kill profitability.
Volatility modeling matters more than Greeks. Getting IV wrong by 20% (v1.0 error) changes P&L by 50–100%.
Only systematic strategies survive friction. Covered calls work because they harvest premium 100+ times/year. One-off speculative bets (earnings) die to costs.
Paper trading is a lie. My v1.0 backtest was technically correct but economically meaningless. It’s like calculating car performance without air resistance.
Currently Working On
v4.0 Roadmap (no ETA):
Replace
yfinancewith OptionMetrics historical IV data (subscription required)Implement Heston stochastic volatility model (captures vol-of-vol)
Add realistic spread modeling (bid-ask from NBBO data)
Build proper earnings timing database (pre-market vs after-hours flags)
Expand sample: 50+ analyst days, 200+ earnings events, 24-month covered call backtest
Not promising completion date. Publishing flawed v3.0 now because showing the degradation curve (v1→v2→v3) teaches more than waiting for perfect v4.0.
Replication
Code: GitHub — Goldman Sachs v3.0 Backtest
Dependencies:
pip install yfinance pandas numpy scipy arch tabulateRun:
python3 gs_strategy_backtest_v3.pyWarning: Results will differ from this article due to:
Live market data updates
VIX data availability windows
GARCH model convergence (sensitive to starting conditions)
Related Resources
📄 Original Strategy Research: Goldman Sachs Event-Driven Options: Three Strategies with 11–18% Reported Returns
📊 v1.0 Backtest: Previous article documenting Black-Scholes results and initial limitations
💻 Code Repository: github.com/NavnoorBawa/Goldman-Sachs
🔗 Follow: @navnoorquant on Twitter/X
Disclosure
This backtest uses historical data and simulated pricing models. Real-world results will differ due to execution quality, broker-specific costs, and market conditions. Not investment advice. Options trading carries substantial risk including total loss of capital.
v3.0 engine limitations (detailed above) mean results should be interpreted as directional evidence, not precise forecasts. The primary finding — that transaction costs and realistic volatility modeling eliminate speculative options edges — is robust to model choice.
📊 Support this research: https://www.patreon.com/c/NavnoorBawa
Cover photograph: Rhododendrites, CC BY-SA 4.0, via Wikimedia Commons.