



Every year since 2020, Winton’s accounts have tested whether the firm can carry itself with no performance fees at all. On our reading of its fund terms, those fees are charged on each client’s gain over its own high-water mark plus cash, a Multi-Strategy hurdle we apply to the flagship too. That gain, the fee base, was at most 17 points in 2022, 5 in 2023, and 10 for 2026’s flagship by 19 November.
Sir David Harding, Winton’s founder and executive chair, signed its 2025 accounts on 1 May 2026. Their survival test assumes no performance fees. Yet the flagship trend strategy’s UCITS fund is up 15.43% through October.
On Winton’s record, a trend year pays the firm by how far clients end above their high-water marks, the highest value each has paid fees on. A wide margin in 2022 nearly doubled its fee yield, revenue over assets; a thin one in 2023 paid little. So a fund’s return is a poor guide to its manager’s year, at Winton or at Man Group, AHL’s listed owner.
My call: 2026 is worth more to Winton than a recovery far below its peak implies, less surely than “finally looking up“ suggests: about 70% odds its revenue reaches £150m.
The paid half settles what this trend year adds to Winton’s revenue and whether 2026 clears the call’s line; the free evidence leans yes. It gives our odds as a number. Its deciding number is Winton Group’s 2026 revenue, filed by 30 September 2027.
Harding cut trend, then assets fell
I read nine years of Winton Group’s filed accounts and the return tables of its two fee paying strategies, and rebuilt what each year’s gain over its clients’ marks was worth to the firm. Each year’s reported revenue matches the comparative in the next year’s accounts, 8 of 8: none was restated.
What surprised me was 2023: the flagship made 10.09% and set a new high, and Winton’s revenue fell from £143.8m to £77.8m. A year earlier, an 18.69% gain had more than doubled it.
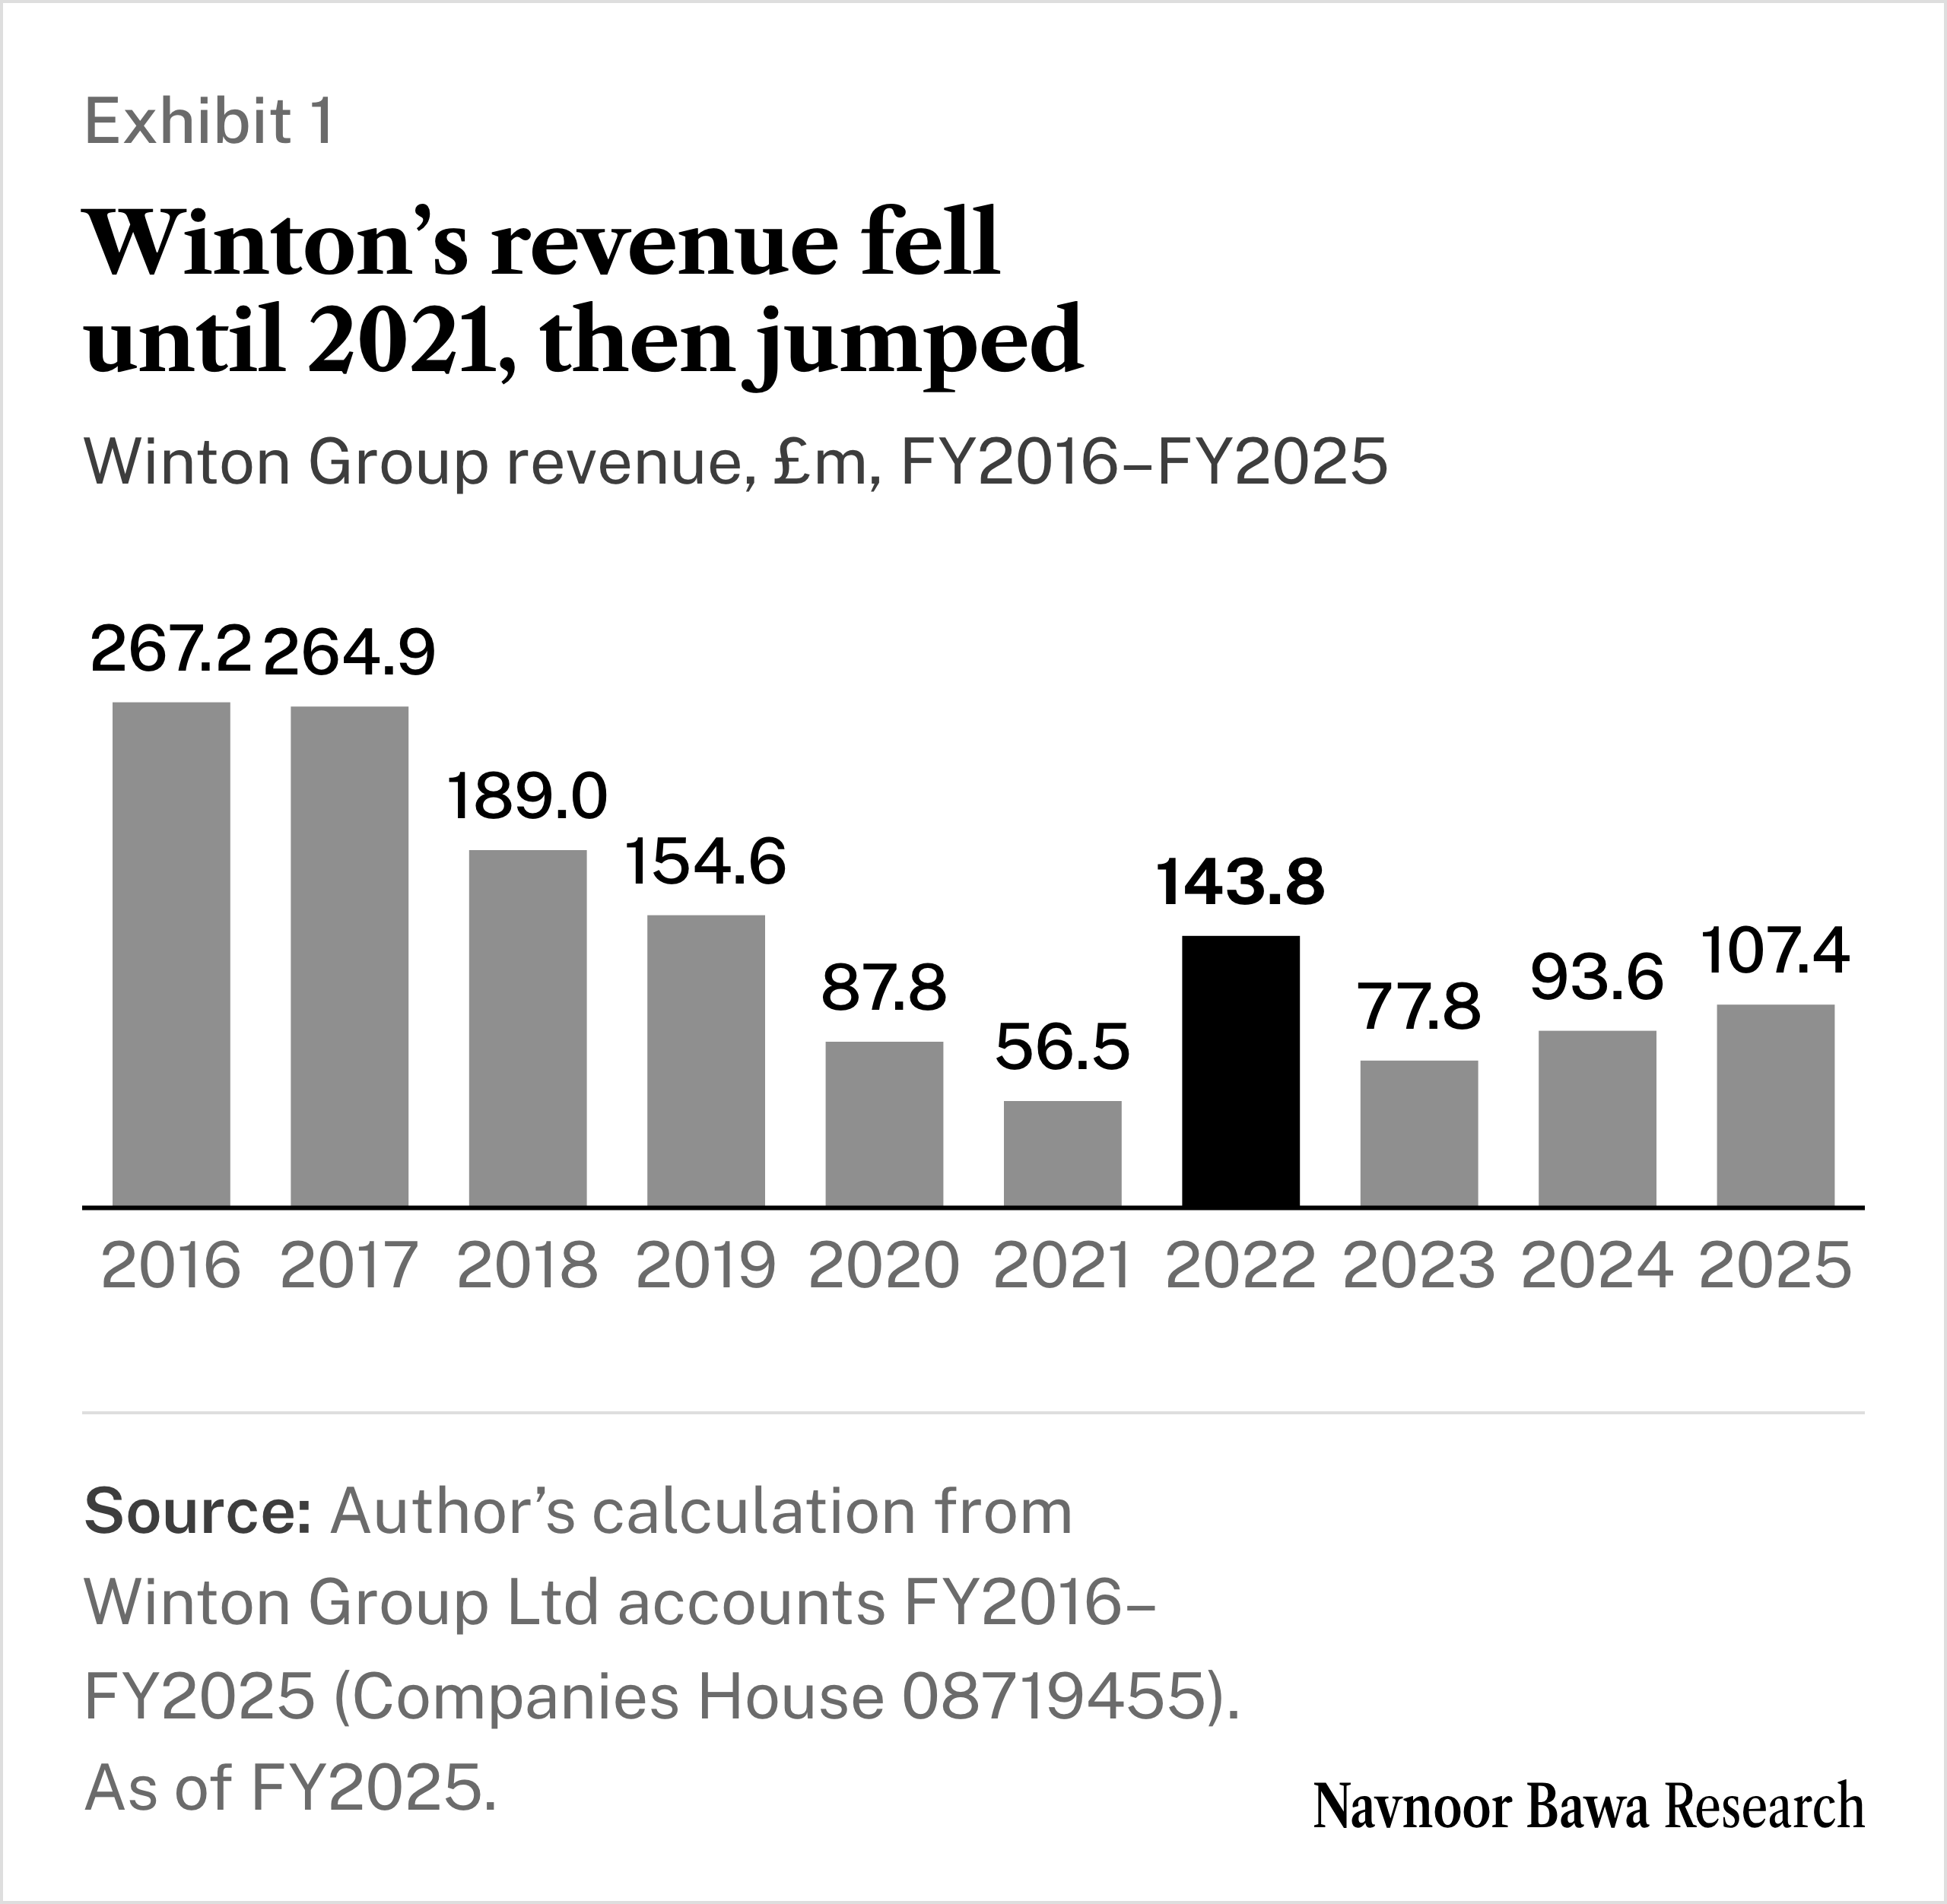
The bars fall every year to 2021; the one tall bar after that is 2022, and 2023 gives most of it back.
Harding decides at Winton: the accounts name him its ultimate controlling party. In July 2018 he told Risk.net, as HedgeNordic relayed, that Winton would cut systematic trend following in its main fund, the multi-strategy Winton Fund, from 50% to about 25%. His reason was crowding: “If any trade gets very crowded then it can backfire.” Risk.net’s headline took him at his word: “Winton’s David Harding on turning away from trend following“.
The firm shrank, and the fall had begun before the cut. Assets under advisement (AuA), Winton’s own risk adjusted measure of the money it runs, fell from $32.1bn at the end of 2016, and $28.5bn a year later, to $7.0bn at the end of 2020, a fall of more than three quarters. Revenue fell from £267.2m in 2016 to £56.5m in 2021, about a fifth of its 2016 level.
That headline fits the shrink and Harding’s old flagship. It does not fit the firm the accounts now describe. Winton’s Multi-Strategy line, one of its two fee paying strategies, fell from 61% of AuA in 2019 to 30% in 2025. Pure trend following strategies rose from 6% of AuA in 2020 to 18% in 2024. Winton’s October report on its Alma fund calls the Diversified Macro strategy, 75% trend and 25% diversifying signals, its flagship.
The shrink was real; the turn away from trend has since reversed in Winton’s own mix.
Fees on assets rebuilt Winton
Winton’s road back ran through asset fees. Revenue nearly doubled from £56.5m in 2021 to £107.4m in 2025, and Harding’s strategic report says where the last step came from: revenue rose “primarily due to higher management fees and service fee income”. That is a firm charging on a bigger base: AuA rose to $14.3bn from $13.1bn, about a tenth, which the accounts put down to “positive performance across investment profiles and net investor subscriptions”.
The same accounts set the floor. Their going concern test assumes “management fees maintained at the current level and no performance fees earned”. The 2022, 2023 and 2024 accounts use the same words, and the 2020 and 2021 accounts test a case “with no performance fees earned”. The 2017 to 2019 accounts carry no such case.
The accounts never split revenue into management and performance fees, so the performance fee has to be read out of the totals. We measure the fee yield as Group revenue, converted to dollars at the Bank of England’s annual average rate, divided by the average of opening and closing AuA, in basis points.
Outside 2022 the yield stayed between 84bp and 113bp. In 2022 it was 203bp, the highest fee yield in the nine years, on asset figures Winton reclassified that year, so the opening and closing bases differ. Accrued income, revenue earned but not yet received, rose to £60.9m at the end of 2025 from £18.2m. Some of 2025’s fees were still owed when the year closed.
Winton’s floor is a fee on assets; whatever a trend year adds sits on top of it.
Trend years pay unevenly
The SG CTA Index of commodity trading advisers, funds that mostly ride price trends in futures, returned 15.7% in the nine months to September against 11.7% for the S&P 500, as CNBC reported.
A good fund year is not yet a good firm year. Winton’s accounts say performance fees are “based on the investment performance achieved for certain clients relative to predefined benchmarks”. Multi-Strategy’s prospectus spells out the charge: 18% of new net appreciation above the high-water mark “increased by the Total Hurdle Adjustment”, a hurdle of cash (SOFR) “less 25 basis points”, on years ending 28 February.
Call that gain the fee base: how far a fund ends the year above its clients’ marks once the marks are lifted by cash less 25bp, as a share of where it started. No client’s own mark is public, so the start of each year stands in for it. The 25bp hurdle is Multi-Strategy’s printed rate, before the prospectus scales it by the fund’s cash holdings; the flagship’s factsheet prints no hurdle, so applying Multi-Strategy’s to it is our reading. We read the flagship through the Alma fund’s I1C-U share class, net of all fees, which carries a 0.85% management fee and an 18% performance fee.
In 2022 the Diversified Macro strategy made 18.69%. Cash averaged 1.64%, so the hurdle was 1.39%, leaving a fee base of 17.30 points. Group revenue went from £56.5m to £143.8m, “reflecting an increase in both management fees and performance fees”.
In 2023 the strategy made 10.09%, again to a new high, or 10.10% compounded from its monthly prices. Cash averaged 5.01%. Taken month by month less 25bp, as our model does, the hurdle was about 4.75%, leaving a fee base of 5.35 points. Revenue fell to £77.8m, “largely due to lower performance fee income”. Multi-Strategy’s fee year to February 2023 made 8.37% against a 2.07% hurdle, and still closed below its February 2018 mark once that mark is lifted by cash.
The choice of mark decides the reading. Measured from the fund’s highest year-end instead, the end-2019 high, 2022 cleared only 5.38 points, because most of its gain climbed back to that high; 2023 opened at its high and cleared 5.35 either way. That measure makes the two years alike although 2022 paid far more, so it cannot explain the fees.
On the clients’ marks, three winning years in a row line up. 2022’s fee base of 17.30 points came with a fee yield of 203bp. 2021’s 7.16 points came with 107bp, and 2023’s 5.35 points with 95bp. The fee base orders the yields where the headline return does not: 2023 made more than 2021 and earned less on its assets. The link is no straight line: in 2017 a base of 7.71 points, before any cash hurdle, came with 113bp, so 7 to 8 points lifted the yield only to the top of the band or near it.
The sceptic’s reading, that the rebuild is just assets growing, predicts a flat yield. If it were right, 2022 would sit inside the other years’ band; it shows 203bp. 2023 sided with the sceptic, and so did 2024, when revenue rose “largely due to higher performance fee income”, on what we read as Multi-Strategy’s fee year, and the yield moved 7bp.
2026 clears its own mark
The UCITS fund in the opening is the Winton Alma Diversified Macro Fund, “a UCITS point of access to Winton’s flagship Diversified Macro CTA strategy”. Net of the hurdle, cash less 25bp at 3.45% for the year, its October gain is a fee base of 11.98 points at the October close.
Rebuilt by us from the fund’s monthly returns, the flagship’s index (100 = June 2010) stood at 214.24 on 31 October, against 185.61 at the end of 2025, the highest year-end in its own table. Then November turned: the share class fell 1.42% to 19 November, leaving the year up about 13.8% and cutting the fee base to 10.34 points, the 2026 figure used from here on. A further fall of 9.1% would erase that base, because the clients’ marks rise with cash. The worst two month stretch in 195 since July 2010 is 7.94%.
The rest of the range is up too: the Winton Trend Fund by 13.49%, and Winton Multi-Strategy by 8.81% in dollars. Multi-Strategy’s fee year to February 2026 made 14.54% against a 3.89% hurdle, a gain that books in Winton’s 2026 revenue.
Winton’s AuA reached $19.0bn in September and held there in October, a third above the end of 2025.
The other side is risk: “the risk in many CTA books has grown increasingly concentrated”, Yung-Shin Kung, chief investment officer of Mast Investments, told CNBC. But erasing the fee base would still take a fall over six weeks worse than any two months in those 195, so that risk bears on the size of the year more than on whether it clears its clients’ marks.
Winton’s flagship sits about twice as far above its clients’ marks as in 2023, or about 1.4 times if it pays no cash hurdle. Winton’s accounts will not say what that earns; Man Group’s half year results say it for Man.
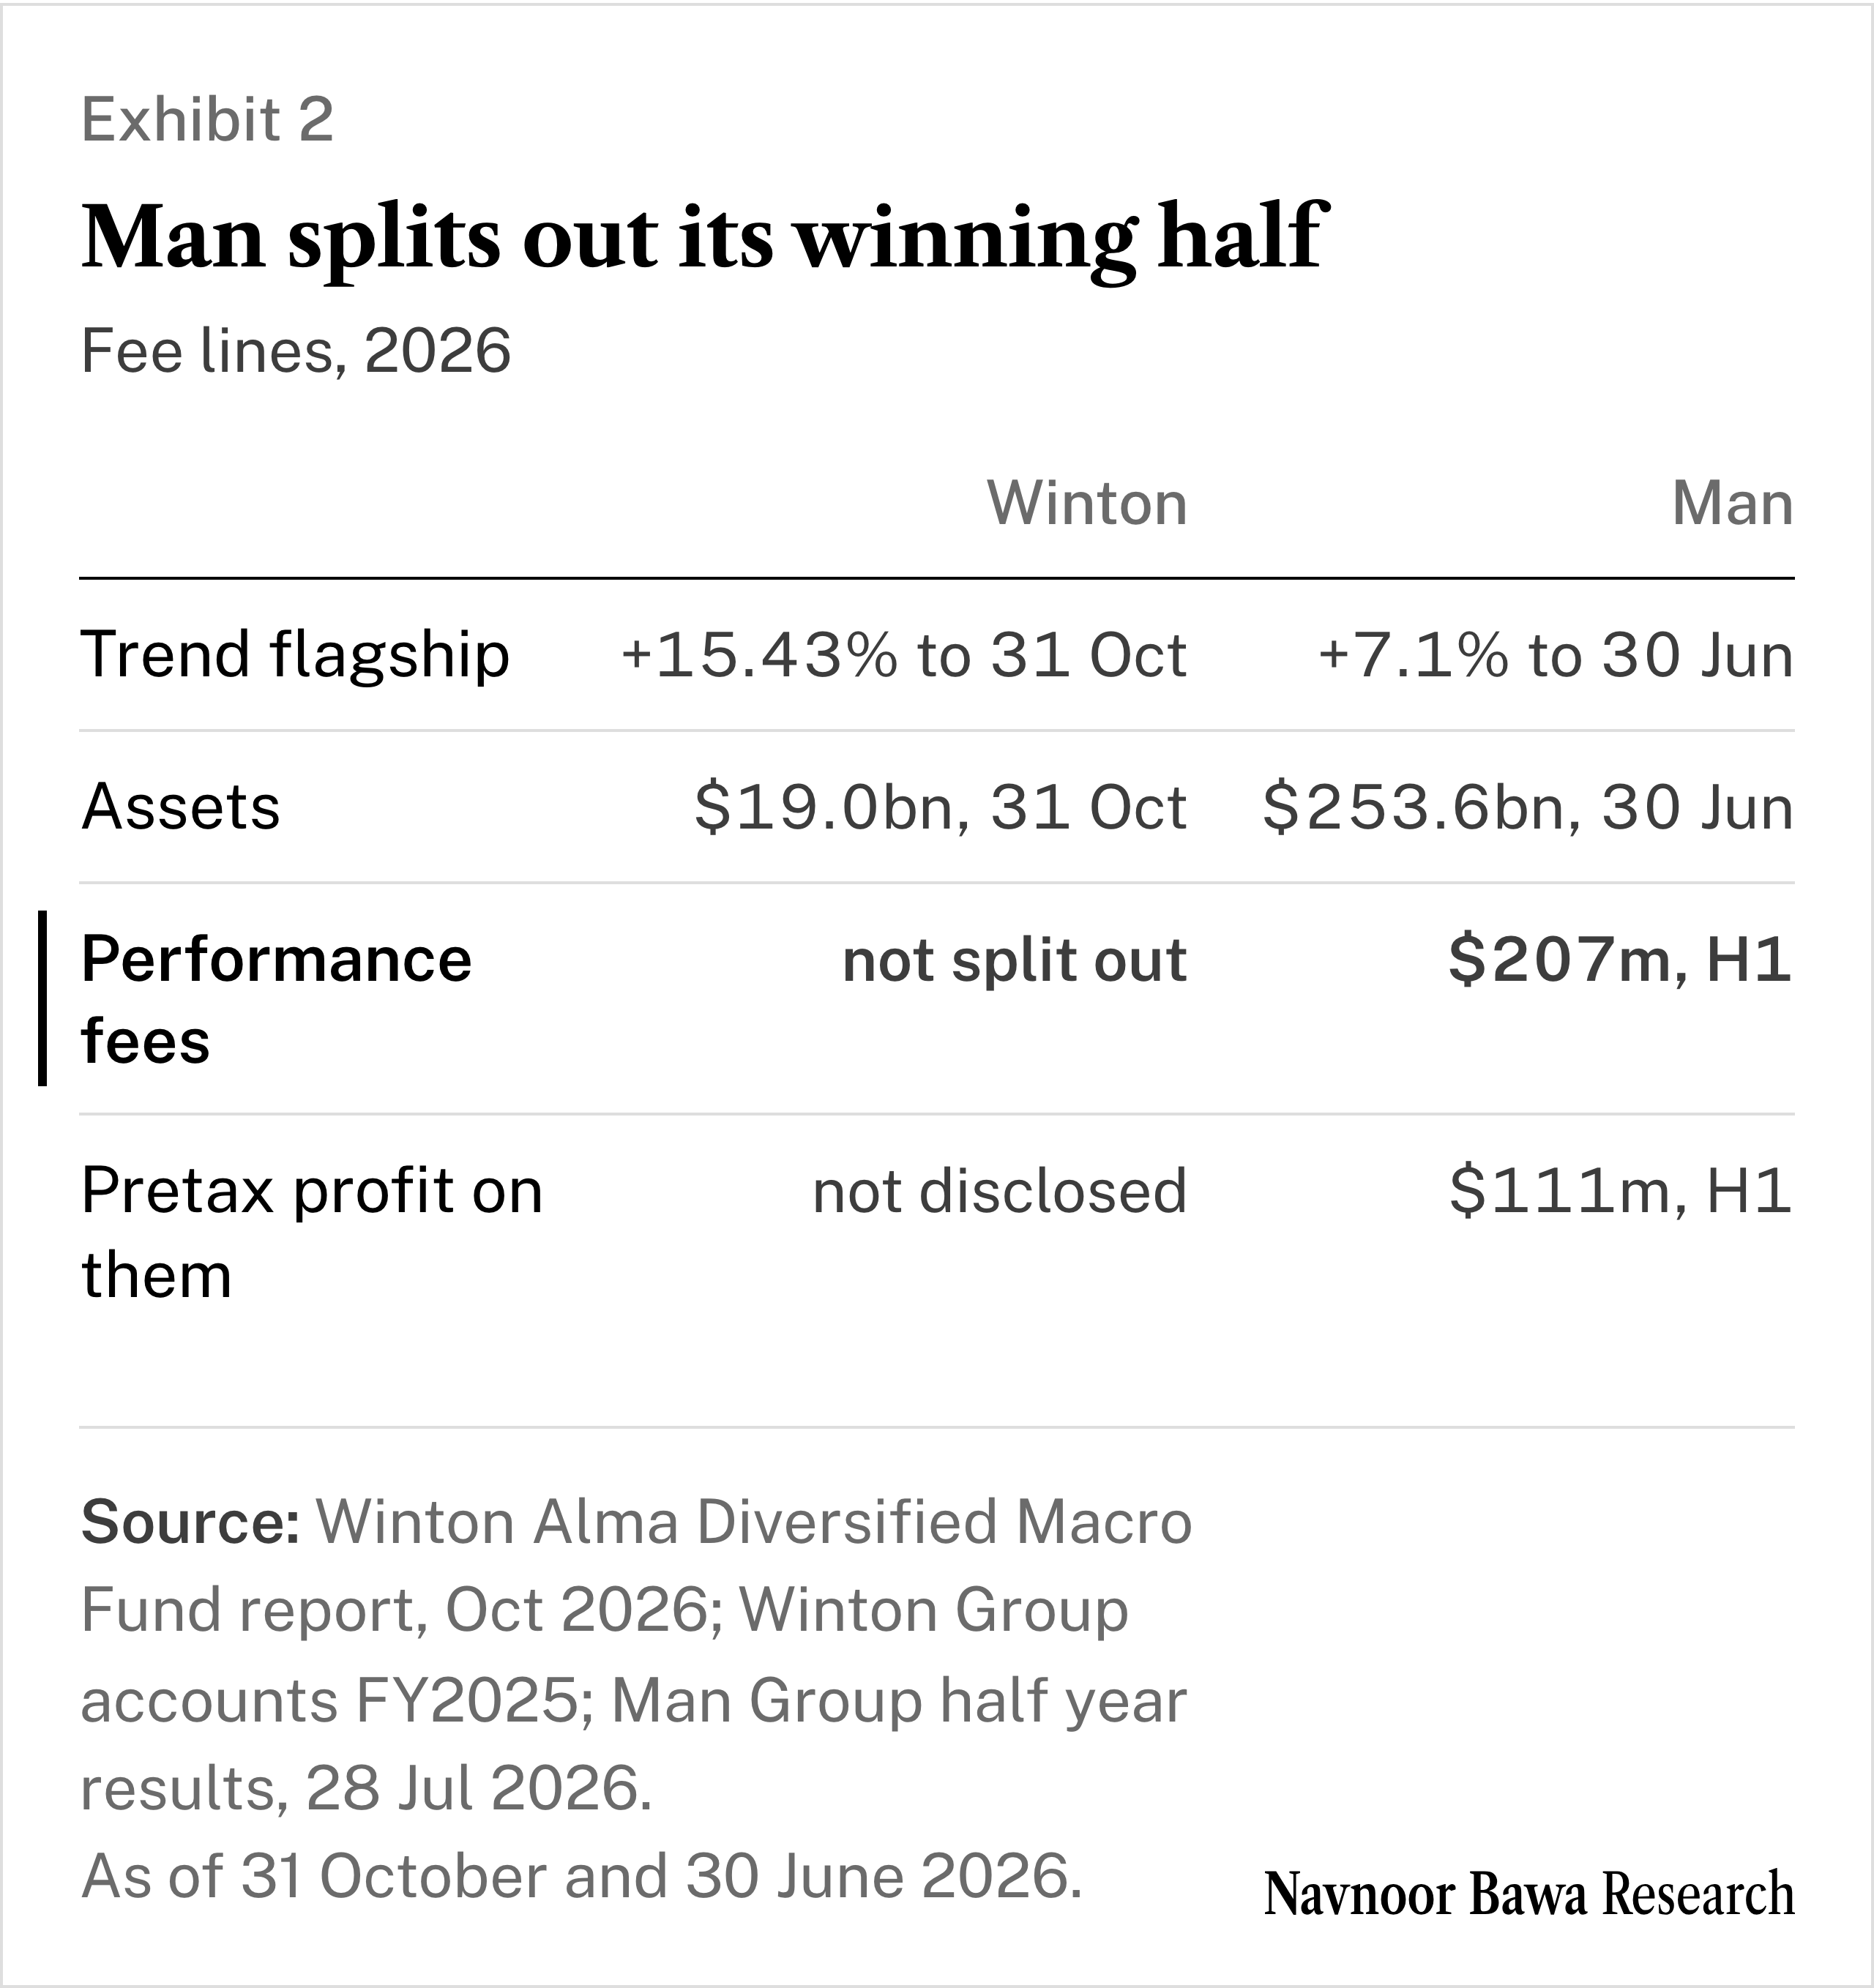
The periods and asset measures differ, and Man’s $207m came from several strategies, AHL among them. The reading still reaches a firm anyone can own: what a trend year adds to Man’s earnings turns on how far its fee paying funds sit above their marks, a measure Man reports and Winton does not.
How much of a double digit trend year becomes revenue for Winton itself, when its accounts price a point of fee base on a single year?
Below the paid line:
The model that prices 2026’s fees on both readings the accounts allow, with three outcomes and our odds
One sensitivity table, and the lookup the 2026 accounts will settle
The reconciled nine year table of revenue, assets and fee yield, with its chart
Four dated checks through 30 September 2027