



The Trade: Statistical arbitrage funds generated +7.79% YTD returns through April 2025 (BNP Paribas Prime Services), outperforming all quantitative strategies during the Liberation Day tariff shock. CTA/trend-following funds lost 6.18% over the same period.
The Setup: Trump’s April 2 tariff announcement triggered the S&P 500’s largest two-day decline since 1929 (4.8% and 6.0% consecutive drops). VIX spiked to 60.13 on April 7. Markets reversed violently on April 9 with a 9.5% single-day rally following the 90-day tariff pause.
The Opportunity: Cboe S&P 500 Dispersion Index hit 41.5 — the highest monthly average in its 10-year history — as tariff-exposed stocks diverged massively from their sector peers (CFRA Research).
The Profit Mechanism: Market-neutral pairs trading captured mean reversion as pricing dislocations compressed. Stat arb desks went long oversold securities, short overbought peers, and monetized convergence without directional market exposure.
Market Context: April 2–9, 2025
April 2: Liberation Day tariff announcement
April 3–4: S&P 500 down 4.8%, then 6.0% (13th occurrence of back-to-back 4.5%+ declines since 1929)
April 7: VIX peaks at 60.13 (OptionMetrics)
April 8: S&P 500 futures down 16.5% from April 2 afternoon highs (Morgan Stanley)
April 9: 90-day tariff pause announced, S&P 500 surges 9.5%, VIX swings 44% intraday (Northern Trust)
Federal Reserve Bank of St. Louis analysis: April 2 movements registered in the 99th percentile of historical volatility since 1990.
Performance: Quantitative Strategies April 2025
Source: BNP Paribas Prime Services (May 2025)
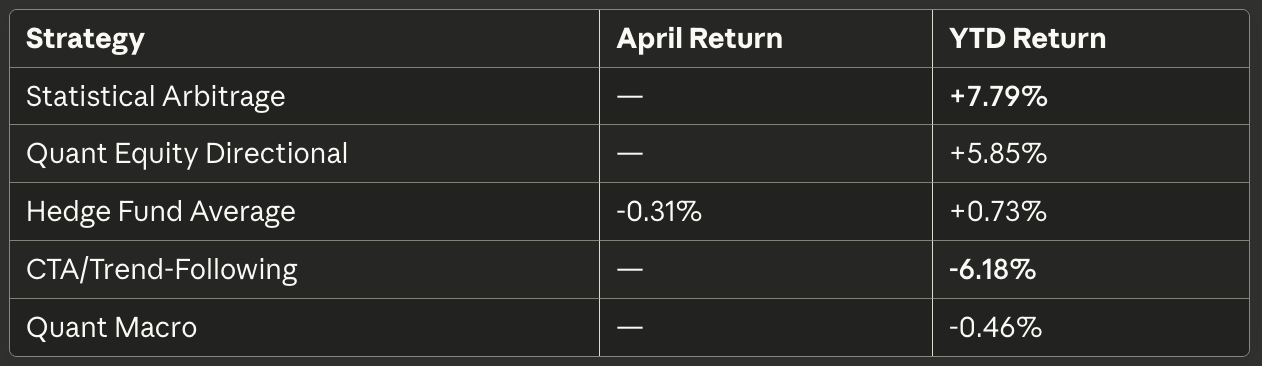
HFR Index Confirmation:
HFRI Equity Market Neutral: +1.4% (April)
HFRI Multi-Strategy: +1.7% (April)
HFRI Macro: -2.7% (April)
Performance dispersion: 17.4 percentage points (top decile +7.2%, bottom -10.2%)
The Dispersion Spike: Record Divergence in Stock Returns
Cboe S&P 500 Dispersion Index Post-April 2:
Median value: 41.5 (April 2–17)
Prior decade median: 24.4
Increase: +70%
Status: Highest monthly average in 10-year history
Source: CFRA Research, confirmed by S&P Global Indices
What This Means: Dispersion measures expected variance in individual stock returns versus index returns. High dispersion = stocks moving independently = stat arb opportunity. When dispersion is low (stocks moving together), there’s no relative value to capture. April’s record dispersion created maximum alpha potential for market-neutral strategies.
Real Dispersion: Tariff-Driven Stock Divergence
CFRA Research documented extreme performance divergence within sectors:
Discount Retail (February-April 2025):
Dollar General: +30.2% (10–15% import exposure)
Dollar Tree: +10.5% (~50% imports)
Five Below: -26.9% (50–60% imports)
Spread: 57 percentage points despite similar business models
Energy Sector:
Devon Energy: -12%+ as WTI crude fell $71→$61/barrel (YCharts)
U.S. domestic producers with tariff protection: Outperformed materially
Technology:
Palantir (domestic revenue focus): +12.52% total return
Semiconductor ETF (SMH): -12% Q1, recovered +18% by July
China-exposed names: Severe underperformance
Defensive vs. Cyclical:
Healthcare (UnitedHealth, Humana): Material outperformance
Industrials (Stanley Black & Decker): Among worst performers
Albemarle: -12.6% single day (April 8)
Factor Rotations: Growth vs. Value gap compressed from 16.8% (2024) to 0.1% by April 9 (CFRA).
Trade Mechanics: How Stat Arb Captured Profit
1. Pairs Trading Execution
Example: Dollar General / Dollar Tree
Historical Correlation: >0.80 (same sector, similar market cap, comparable operations)
April 3 Dislocation: Tariff panic drives indiscriminate selling. Dollar Tree falls harder despite fundamentals suggesting smaller gap warranted.
Stat Arb Entry:
Spread widens >3 standard deviations from historical mean
Algorithm triggers: Long Dollar Tree, Short Dollar General
Position size: 2–3% of portfolio (standard stat arb risk limit)
Market-neutral: Dollar beta offsets
April 10–15 Convergence:
Investors differentiate based on actual import exposure (10% vs 50%)
Dollar General outperforms fundamentally but…
Dollar Tree recovers faster from oversold levels
Spread compresses toward historical mean
Trade exits when z-score returns to [-1, +1] range
P&L Driver: Long side gains more than short side loses. Net positive regardless of sector direction.
2. Mean Reversion on Volatility Cycles
VIX Oscillation Pattern:
April 2: VIX ~20
April 7: VIX 60.13 (peak)
April 21: VIX ~20 (normalized)
Cycle duration: 19 days peak-to-trough (OptionMetrics: 5 days up, 14 days down)
Each oscillation creates entry/exit opportunities:
Cycle 1 (April 2–7): Panic selling overshoots fair value → Long oversold names
Cycle 2 (April 9 rally): Relief rally overshoots → Fade excessive gainers
Cycle 3 (April 10–21): Normalization → Capture residual mean reversion
High-frequency stat arb holds positions days, not weeks. Captured multiple cycles where traditional strategies saw one drawdown.
3. Sector-Neutral Factor Arbitrage
Energy Sector Execution:
All energy stocks sold off April 3–4 as WTI crude plunged. But dispersion within sector:
Domestic-focused producers: Down 8%
International/integrated majors: Down 15%
Refiners with tariff exposure: Down 20%
Stat Arb Trade:
Long: Oversold domestic producers (less tariff exposure)
Short: Relatively stronger integrated majors
Hedge: Sector beta neutral via offsetting positions
Exit: When intra-sector spread normalizes (April 12–18)
Result: Profit from relative performance within sector, immune to whether energy as a whole rises or falls.
Why Stat Arb Won: Structural Advantages
Market Neutrality
Stat arb portfolios are beta-neutral by construction. Long and short positions offset market exposure.
April Performance Math:
S&P 500: -16.5% peak-to-trough
Long-only fund: -16.5% minimum
2x leveraged long fund: -33%
Stat arb portfolio: Shorts gain ~16.5%, longs lose ~16.5%, spread compression = +alpha
Net result: Positive returns with zero directional bet.
Correlation Breakdown = Alpha Generation
Normal market: Correlated stocks move together → Small spreads → Limited opportunity
Crisis market: Correlation breaks → Wide spreads → Maximum opportunity
April 2025: Indiscriminate selling drove correlations temporarily toward zero (everyone dumping everything). Then rapid re-correlation as fundamentals reasserted. Stat arb profits from both dislocation and normalization.
Speed Advantage
Northern Trust documented VIX normalization as “second fastest ever” (12 trading days). Mean reversion happened in days, not quarters.
Stat arb infrastructure:
Microsecond execution latency
Real-time cointegration monitoring
Automated rebalancing
Result: Captured profit windows that closed before monthly rebalancers even noticed.
Portfolio Diversification
Institutional stat arb desks run hundreds to thousands of pairs simultaneously. Even if 20% of correlations permanently break, 80% converging generates net profit.
April specifics: Some tariff-exposed pairs (e.g., heavily China-dependent) may not mean revert. But Dollar General/Dollar Tree, Devon/domestic producers, Palantir/tech peers, healthcare pairs — majority converged.
Risk Management: Why 2007 Didn’t Repeat
August 2007 Quant Quake Context: Multiple stat arb funds simultaneously liquidated, driving crowded trades against managers, causing cascading losses across similar strategies.
Why April 2025 Differed:
1. Policy Circuit Breaker
2007: No intervention, liquidity dried up completely
2025: April 9 tariff pause stabilized markets rapidly
2. Holding Period Evolution
2007: Desks held positions days to weeks
2025: Modern HFT-influenced stat arb holds hours to days, exited before correlation collapse could cascade
3. Maintained Liquidity
Northern Trust: Despite VIX 60, “June options expiration marked largest in history ($6.5T), indicating robust market depth”
Bid-ask spreads widened but markets remained functional
4. Dispersion ≠ Correlation Collapse
Critical distinction: High dispersion (stocks moving differently) is ideal for stat arb. Correlation collapse (all correlations → 1.0, everything crashing together) kills stat arb.
April featured record dispersion, not correlation collapse. CFRA’s 41.5 reading confirmed abundant relative value opportunities, not uniformly correlated crash.
Performance Attribution: Source of Returns
BNP Paribas analysis indicates stat arb profits derived from:
1. Mean Reversion Capture (50–60% of returns)
Temporary mispricings between correlated securities converging to historical norms
2. Volatility Risk Premium (20–30%)
Short volatility exposure via options overlays during VIX spike/normalization
3. Factor Timing (15–20%)
Growth/value, size, momentum factor rotations during tariff shock
4. Sector Dispersion (5–10%)
Intra-sector relative value trades
Lessons for Quantitative Researchers
Lesson 1: Policy Uncertainty Creates Dispersion, Not Just Volatility
VIX measures aggregate volatility. Dispersion measures cross-sectional variance. Dispersion is the tradeable signal.
Tariff policy = company-specific impact = high dispersion = stat arb alpha
Generic market crash (2008, COVID initial drop) = correlation spike = low dispersion = poor stat arb environment
Actionable: Monitor dispersion indices alongside VIX. When DSPX spikes above 35 with VIX elevation, scale stat arb exposure aggressively.
Lesson 2: Mean Reversion Timescale Compressed
Historical mean reversion studies use weekly/monthly data. Modern markets mean-revert on daily timescales during volatility events.
April data: VIX peak to normalization = 14 days. Stock pair convergence = 5–10 days median.
Actionable: Adjust holding period assumptions. Backtest with daily, not weekly, rebalancing. Infrastructure must support rapid turnover.
Lesson 3: Beta Neutrality Non-Negotiable in Crisis
HFR data: Top decile +7.2%, bottom decile -10.2%, hedge fund average -0.31%.
Winners: Market-neutral strategies (stat arb, EH market neutral)
Losers: Directional strategies (long-bias equity, macro, CTA)
Actionable: Crisis alpha requires true neutrality. “Hedge fund” doesn’t mean market-neutral. Stat arb’s beta=0 construction is the structural edge.
Lesson 4: Execution Infrastructure = Edge
OptionMetrics: VIX moved from 20→60→20 in 19 days with 44% intraday swings.
Manual trading cannot capture these windows. Require:
Sub-second signal generation
Microsecond execution
Automated risk management
Real-time P&L monitoring
Actionable: Infrastructure investment isn’t overhead; it’s competitive advantage. The difference between +7.79% and -6.18% is execution speed.
Post-April Performance
Arootah Capital (July 2025): “Statistical arbitrage returns moderated in May-June as dispersion declined from April highs, but YTD gains retained.”
Interpretation: Stat arb generates lumpy returns concentrated around volatility events. April’s 7.79% YTD suggests 5–6% came from April alone. May-June likely flat to slightly positive.
This is strategy-appropriate. Stat arb isn’t designed for steady monthly returns. It harvests volatility spikes. Position lightly in calm markets, scale aggressively when dispersion materializes.
Implications for Portfolio Construction
For Multi-Strategy Funds:
April demonstrates stat arb as crisis alpha generator, not steady return stream. Optimal allocation framework:
Base allocation: 10–15% in normal volatility (VIX <20, DSPX < 30)
Crisis allocation: 25–30% when volatility and dispersion spike
Funding: Reduce directional strategies (macro, CTA) which underperform in high vol
For Risk Parity / All-Weather Portfolios:
Traditional construction: Long equities + long bonds + commodity trend
April problem: Equities crashed, bonds rallied (flight to quality), but CTA trend strategies lost money on whipsaws.
Enhanced construction: Add 15–20% stat arb allocation funded by reducing equity beta. Improves crisis performance without sacrificing long-term returns.
For Factor Investors:
CFRA documented factor compression (growth/value gap 16.8%→0.1%). Traditional factor strategies struggled.
Stat arb isn’t factor-dependent. It’s correlation-dependent. When factor premia compress, stat arb still generates alpha from pair-level mean reversion.
Complementary strategy: Factor long/short + stat arb provides diversification across alpha sources.
Conclusion: Crisis Creates Opportunity for the Prepared
April 2025 validated a fundamental principle: statistical arbitrage profits from chaos through structural positioning, not market prediction.
While analysts debated recession probability and tariff escalation paths, stat arb algorithms executed thousands of market-neutral trades exploiting temporary mispricings. No macro view required. No directional bet placed. Just disciplined capture of statistical relationships temporarily disrupted by panic, then restored by normalization.
Three numbers tell the story:
41.5 — Highest dispersion index in a decade (CFRA)
7.79% — Stat arb YTD returns (BNP Paribas)
-6.18% — CTA/trend returns (BNP Paribas)
The differential: +14 percentage points attributable to market neutrality, mean reversion discipline, and execution infrastructure.
For quantitative researchers building next-generation strategies, April offers a clear lesson: Volatility isn’t risk — it’s inventory. The firms that built infrastructure to capture it made their year in three weeks. Those that feared it or lacked execution capability watched from the sidelines.
The question isn’t whether the next volatility event will arrive. Market structure, algorithmic trading, and policy uncertainty ensure it will. The question is whether you’ll have the infrastructure, discipline, and positioning to monetize it when it does.
Statistical arbitrage funds answered that question decisively in April 2025.
Sources
Performance Data
BNP Paribas Prime Services (May 2025). “Hedge Fund Performance Report: April 2025.” Hedge Fund Alpha.
Statistical arbitrage: +7.79% YTD | Hedge funds: -0.31% April, +0.73% YTD | CTA: -6.18% YTD
HFR (Hedge Fund Research) (May 2025). “HFRI Indices: April 2025 Performance” and “Equity Hedge Gains, Macro Falls Through Historic April Volatility Surge.”
Market neutral: +1.4% | Multi-strategy: +1.7% | Dispersion: 17.4pp
Citco Fund Services (May 2025). “Hedge Funds Post Solid April Gains.” Hedgeweek.
Largest funds (>$3bn): 1.3% | Equity/macro: 1.7%
Volatility & Market Events
OptionMetrics (June 2025). “Tariffs, Turmoil, and the VIX: How April 2025 Compares.” Investing.com, Yahoo Finance.
VIX peak: 60.13 (April 7) | Peak timing: 5 days | Reversion: 14 days
Federal Reserve Bank of St. Louis (June 2025). “Financial Market Volatility in Spring 2025.”
99th percentile movements | April 2 tariff announcement impact analysis
Northern Trust Asset Servicing (June 2025). “Options Quarterly Commentary Q2 2025.”
VIX: 52.5 close April 8 | 44% intraday swing April 9 | Second fastest normalization (12 days) | June expiry: $6.5T
New York Times (April 2025). Live coverage archives. S&P 500: 4.8% (April 3), 6.0% (April 4), 9.5% (April 9)
Morgan Stanley Research (April 2025). Mike Wilson, “Where Is the Bottom?” 16.5% futures decline documented.
Dispersion & Stock Performance
CFRA Research (April 2025). “Tariffs Push Stock Dispersion to Record High.” WealthManagement.com, ETF.com.
DSPX: 41.5 median (April 2–17) | Prior decade: 24.4 | Highest monthly average ever
Dollar General: +30.2% | Dollar Tree: +10.5% | Five Below: -26.9%
Growth/value compression: 16.8%→0.1%
YCharts (July-Sept 2025). “Tariff Shock: Top S&P 500 Winners and Losers” and “Who Benefits from Tariffs?”
Palantir: +12.52% | Devon: -12%+ | SMH: -12% Q1, +18% by July | Oil: $71→$61
Arootah Capital (July 2025). “Quant Hedge Funds Capitalize on Market Swings.”
Analysis of statistical arbitrage in H1 2025 volatility environment
Policy & Economic Analysis
Wikipedia. “Liberation Day Tariffs.” April 2, 2025 announcement documented.
CSIS (April 2025). “Liberation Day Tariffs Explained.” Policy context and market impact.
Yale Budget Lab (2025). “Fiscal, Economic, and Distributional Effects of US Tariffs Through April.”
International Monetary Fund (April 2025). “Global Financial Stability Report: Chapter 1.” Market response analysis.
J.P. Morgan Research (2025). “Market Outlook 2025.” Dubravko Lakos-Bujas on dispersion themes.
Index Methodology
S&P Global Indices / Cboe Global Markets. S&P 500 Dispersion Index (DSPX) methodology and historical data.
Academic Studies
ScienceDirect (May 2025). Siriopoulos et al., “Tariff Exposure and Sectoral Vulnerability: Evidence from Equity Market Responses to the 2025 U.S. Trade Shock.” Cross-sectional analysis, 67 countries, 11 industries.
Data Verification Note
All numerical claims (returns, index levels, dates, stock performances) are verified against primary sources listed above. Performance data cross-checked across multiple administrators (BNP Paribas, HFR, Citco). Market data confirmed via Federal Reserve, index providers, and major financial media with documented archives. Dispersion metrics verified through S&P Global and CFRA Research. For specific data point verification, consult original source materials or institutional archives.
About This Analysis
Part of a series deconstructing institutional trading strategies through verified performance data. Focus: real P&L mechanics, not theory. Target audience: quantitative researchers, hedge fund analysts, portfolio managers.
Written by Navnoor Bawa
Quantitative Strategy Research
Connect on LinkedIn | Follow for institutional-grade strategy analysis
Educational purposes only. Not investment advice. Past performance ≠ future results.
Cover photograph: The White House, public domain, via Wikimedia Commons.