


TL;DR: The Trade Mechanics
Short positions against the ten largest publicly traded US business development companies (BDCs) generated $127 million in profits over 30 days through October 2025, representing an 8.7% return. The trade capitalized on deteriorating credit quality in private credit markets following high-profile bankruptcies, with total short interest standing at approximately $1.22 billion before positions began unwinding.
The Core Thesis: BDCs — publicly traded entities that provide debt financing to mid-market companies — were structurally overvalued relative to their underlying credit exposure as private credit underwriting standards degraded. Short sellers identified the asymmetric risk profile and positioned ahead of credit events that would force mark-to-market losses.
Return Profile: In a 30-day window, shorts captured the sector’s entire 2025 year-to-date profits, profiting from equity price declines as investors repriced credit risk following bankruptcy catalysts.
I. Opportunity Identification: Structural Vulnerabilities in the BDC Model
The BDC Structure and Its Inherent Fragility
Business Development Companies operate under a unique regulatory framework established by Congress in 1980. BDCs provide mezzanine debt financing to small and medium-sized businesses underserved by traditional financial institutions. Their tax-advantaged structure requires distributing at least 90% of taxable income to shareholders, creating high dividend yields but limiting capital retention for loss absorption.
The critical vulnerability: BDCs use borrowed money to provide financing to other companies at higher rates, making them highly sensitive to interest rate movements and credit quality deterioration. This structural leverage — combined with illiquid, non-investment-grade underlying assets — creates acute sensitivity to credit cycle turns.
The Credit Quality Warning Signs
By mid-2025, multiple indicators signaled deteriorating credit conditions in private credit:
Payment-in-Kind (PIK) Interest Creep: Weighted average PIK interest as a percentage of BDC total investment income increased to 7.01% in Q1 2025 from 6.22% in Q4 2024. While PIK structures can be legitimate financing tools, rising PIK percentages often indicate borrowers struggling to generate cash for interest payments — a leading indicator of credit stress.
Non-Accrual Rates: Net realized losses increased to $804 million in Q1 2025 from $584 million in Q4 2024 and $540 million in Q1 2024, with BDCs reporting net realized losses for eleven consecutive quarters — an unprecedented streak suggesting systemic issues rather than isolated incidents.
Leverage Concentration: Forty-five percent of all BDCs were levered above 1x in Q1 2025, approaching regulatory limits while holding increasingly risky underlying assets.
Private Credit Market Dynamics: The rapid increase in capital raised by private credit lenders and competition to deploy it could loosen loan underwriting standards and result in credit misallocation. With global private credit assets reaching approximately $1.5 trillion by end 2024 and projected growth to $3.5 trillion by 2028, competitive pressure to deploy capital was compressing spreads and weakening covenants.
The Bankruptcy Catalysts
Two high-profile failures crystallized these concerns:
Tricolor Holdings: Dallas-based subprime auto lender Tricolor operated a platform serving “underbanked” borrowers, two-thirds lacking credit scores, and entered Chapter 7 liquidation bankruptcy in September 2025 amid allegations of “double-pledging” loans across multiple lenders and duplicating vehicle identification numbers. Fifth Third Bancorp disclosed potential $200 million losses from alleged fraudulent activity, with JPMorgan Chase and Barclays also exposed.
First Brands Group: The Michigan-based auto parts manufacturer pursued aggressive acquisition strategy from 2018–2025, completing over 20 acquisitions for approximately $4 billion funded with incremental term loans and supply chain financing, operating with minimal governance and no independent directors. Billions of dollars in loans “simply vanished” according to the New York Times, revealing off-balance sheet borrowing and double-counted invoices. Private credit firms Jefferies, UBS, and BlackRock held significant exposure.
Jamie Dimon’s “Cockroach” Signal
JPMorgan CEO Jamie Dimon stated on an October 2025 analyst call: “My antenna goes up when things like that happen. I probably shouldn’t say this, but when you see one cockroach, there are probably more. Everyone should be forewarned on this one.”
This wasn’t rhetorical flourish. JPMorgan suffered $170 million in losses linked to the Tricolor bankruptcy, giving Dimon direct visibility into the opacity and interconnectedness of private credit exposures. His comments effectively validated the short thesis publicly.
II. Position Structure: Targeting Liquid Proxies for Illiquid Risk
Why Short BDC Equities Rather Than Private Credit Directly?
Short sellers faced a fundamental challenge: private credit is largely illiquid and difficult to short directly. BDCs provided the solution — publicly traded equities with liquid options markets that offered pure-play exposure to private credit performance.
The Structural Advantage: BDCs mark their portfolios to “fair value” quarterly, but these valuations lag real-time credit deterioration. By shorting BDC equities, traders positioned ahead of markdown cycles, profiting as companies reported losses and reduced NAV.
Identifying the Vulnerable Names
Short interest concentrated in the ten largest BDCs, likely including:
Ares Capital Corporation (ARCC) — $15.46 billion market cap, the largest BDC
Blackstone Secured Lending Fund (BXSL) — Recent portfolio stress with the Medallia loan marked down to 89 cents on the dollar in Q1 2025 from 94 cents in Q4 2024, a $42 million loss on a $380 million position
Blue Owl Capital (OWL) — Significant middle-market exposure
Other top-ten names with material private credit portfolios
The selection criteria likely included:
High valuation multiples: BDCs trading at or above book value despite deteriorating fundamentals
Concentrated portfolio exposures: Large single-name positions vulnerable to credit events
High leverage ratios: BDCs operating near 1x debt-to-equity regulatory limits
Weak sponsor backing: Externally managed BDCs with misaligned incentives
The Technical Setup
The S&P BDC Index fell for five consecutive weeks through early October 2025, with BIZD (VanEck BDC Income ETF) down 14% over 11 weeks and 13.5% year-to-date. This created a powerful momentum dynamic where:
Forced selling pressure: Fourteen BDCs reached new 52-week lows in early October, triggering stop-losses
Dividend cut fears: With earnings declining and NAV deteriorating, dividend sustainability concerns mounted
Retail redemptions: BDC retail investor base showed low pain tolerance for NAV declines
III. Risk Management: Timing the Credit Cycle
The Interest Rate Hedge
Short sellers faced a critical risk: Federal Reserve rate cuts could expand BDC net interest margins, potentially overwhelming credit deterioration. S3’s report noted that continued decline in interest rates may lead to short covering as traders look to lock in recent mark-to-market profits.
The solution: Position sizing and timing around credit events rather than interest rate moves. By concentrating shorts around bankruptcy announcements, traders minimized duration risk.
Avoiding the Squeeze
Short positions have been easing in recent weeks, suggesting disciplined profit-taking rather than holding for structural collapse. This distinguished sophisticated credit shorts from crowded momentum plays vulnerable to squeezes.
Sector vs. Single-Name Risk
While individual BDCs faced idiosyncratic risks, the trade thesis centered on systematic credit deterioration. After 40 weeks of 2025, only six BDCs claimed positive price performance, with four operating in lower middle market, confirming broad-based weakness rather than isolated problems.
IV. Returns Generation: How the $127M Was Made
The P&L Breakdown
Short wagers against the ten biggest BDCs gained 8.7% in 30 days. On a $1.22 billion short interest base, this translates to approximately $106 million in mark-to-market gains, with the remaining $21 million potentially from earlier positioning or related derivative strategies.
The Timeline:
Early September 2025: Tricolor bankruptcy filing provides initial catalyst
Late September 2025: First Brands bankruptcy amplifies credit concerns
October 2025: JPMorgan warning about bankruptcies increases credit stress and pushes up banks’ funding costs
Mid-October 2025: Short covering begins as traders lock in 30-day gains
The Mechanism: NAV Compression
BDCs trade based on price-to-NAV multiples. As credit events forced markdown cycles:
Direct portfolio losses: BDCs with Tricolor/First Brands exposure reported immediate losses
Contagion markdowns: Even unexposed BDCs faced valuation pressure as investors reassessed all private credit portfolios
Multiple compression: BDCs reached valuations not seen since June 2023, with fear driving price-to-NAV ratios lower
The Math: If a BDC trading at 1.0x NAV experiences 5% portfolio markdowns and market multiple contracts to 0.92x, the equity price declines 13% — delivering substantial short profits.
Why Profits Exceeded Expectations
The 8.7% gain in 30 days marked the entirety of short sellers’ year-to-date profits in the BDC space, suggesting positions were underwater earlier in 2025. Several factors contributed to the concentrated profit window:
Binary catalyst timing: Bankruptcies provided discrete events driving rapid repricing
Liquidity vacuum: With the S&P BDC Index down 6.0% on a total return basis in 2025, natural buyers disappeared
Momentum acceleration: Serial 52-week lows created self-reinforcing selling pressure
Retail panic: BDC retail investor base demonstrated low sophistication in credit cycle management
V. The Broader Context: Private Credit’s Hidden Leverage
Bank Interconnectedness
The trade illuminated deeper systemic concerns. Banks’ committed credit lines to business development companies have been growing both as a share of banks’ total loan balances and as a share of BDCs’ balance sheets. This creates leverage-on-leverage: BDCs borrow from banks to lend to risky middle-market companies, with banks retaining first-lien senior secured positions.
To the extent that BDCs’ shareholder equity and other liabilities are subordinate to bank loans, banks’ secured credit lines represent the seniormost debt instruments, meaning bank exposure is theoretically protected. However, JPMorgan analysts noted that U.S. bank disclosures “lack granularity” regarding total private credit exposure, making systemic risk assessment difficult.
The Underwriting Quality Question
Few respondents expect leveraged loan underwriting standards to be more restrictive in 2025, with just 15% expecting tighter lending standards while 24% see standards loosening further. Combined with the U.S. leveraged loan default rate climbing to decade-high 5.6% in late 2024, this suggests the credit cycle may be farther advanced than market pricing indicated.
Private credit hyperscalers face tremendous pressure to scale deployment, potentially compromising underwriting and selectivity, with large loans showing 50–100 basis points tighter spreads, 5–10 points higher loan-to-value ratios, and over 1.0x higher leverage than comparable deals not competing with broadly syndicated loans.
Regulatory Gaps
First Brands operated with minimal governance and no independent directors, while Tricolor’s practices are now under federal investigation for alleged fraud. Both companies accessed private credit markets despite red flags that traditional bank underwriting might have caught.
This regulatory arbitrage — where non-bank lenders face lighter oversight than banks — created a selection effect where the riskiest borrowers migrated to private credit, concentrating credit risk in a less-transparent system.
VI. Key Takeaways for Quant Researchers and Traders
1. Structural Shorts Require Event Catalysts
The BDC short thesis existed for months before generating profits. The entire year-to-date gain materialized in just 30 days following bankruptcy catalysts. Lesson: Position size structural shorts for volatility events rather than steady decay.
2. Liquidity Mismatch Creates Opportunities
BDCs hold illiquid private credit but trade in public markets with daily pricing. This fundamental mismatch creates periodic dislocations when fair value reassessments lag reality. Monitor quarterly reporting cycles and covenant breach disclosures for entry timing.
3. Follow the Smart Money’s Pain Points
JPMorgan’s $170 million Tricolor loss and Dimon’s public warnings provided high-signal indicators. When sophisticated banks acknowledge losses in opaque markets, it suggests problems are larger than disclosed.
4. Credit Cycle Position Sizing
Volatility could persist if more defaults emerge, but continued decline in interest rates may lead to short covering. This implies dynamic position management: size up around credit events, trim into rate cuts that expand BDC spreads.
5. The Contagion Premium
Individual credit events (Tricolor, First Brands) triggered sector-wide repricing. When 14 BDCs simultaneously hit new 52-week lows, it reflected systemic concern about asset quality. Trade the contagion, not just the initial credit event.
6. NAV as a Lagging Indicator
BDC fair value accounting creates a reporting lag between credit deterioration and public disclosure. Sophisticated shorts position ahead of markdown cycles by monitoring:
Non-accrual rate trends
PIK interest percentage increases
Covenant breach frequencies
Comparable public market credit spreads
7. Regulatory Arbitrage Identification
Private credit raises overall corporate leverage, potentially making the corporate sector more vulnerable to financial shocks. Markets that exploit regulatory gaps eventually face standardization or crisis. The trade profited from private credit’s journey from regulatory advantage to recognized risk.
Conclusion: The Credit Cycle’s Long Shadow
The $127 million BDC short wasn’t about predicting bankruptcy fraud or timing macro turns. It was about recognizing structural vulnerabilities in private credit-linked public equities and positioning for the inevitable repricing when credit quality deteriorated.
The S&P BDC Index reached valuations not seen since June 2023, representing significant damage to a previously resilient sector. As short sellers begin unwinding positions, the question becomes whether this represents a tradable bottom or the early innings of a broader private credit unwind.
For quant researchers, the trade offers lessons in identifying structural arbitrage opportunities where public market liquidity enables positioning against illiquid, deteriorating credit. For traders, it demonstrates the power of catalyst-driven shorting over pure momentum plays.
The cockroaches may indeed multiply — but those who shorted first have already extracted their gains.
Sources & Further Reading
Hedgeweek: Short sellers lock in gains on BDC bets — Primary source on trade P&L
Neuberger Berman: Lessons from First Brands and Tricolor — Detailed bankruptcy analysis
Bloomberg: Dimon’s ‘Cockroach’ Fear — JPMorgan CEO commentary
Federal Reserve: Private Credit Characteristics and Risks — Systemic risk analysis
LSTA: BDC Quarterly Wrap Q1 2025 — Credit metrics and trends
BDC Reporter: Market Recap October 2, 2025 — Price performance data
Federal Reserve Boston: Private Credit Financial Stability — Bank interconnectedness
FTI Consulting: 2025 Leveraged Loan Survey — Underwriting standards
About This Series: This article is part of an ongoing series examining real hedge fund trades with technical precision, focusing on how money was made or lost and extracting actionable insights for quantitative finance professionals.
All data and claims have been verified through multiple sources. Market data current as of October 25, 2025.
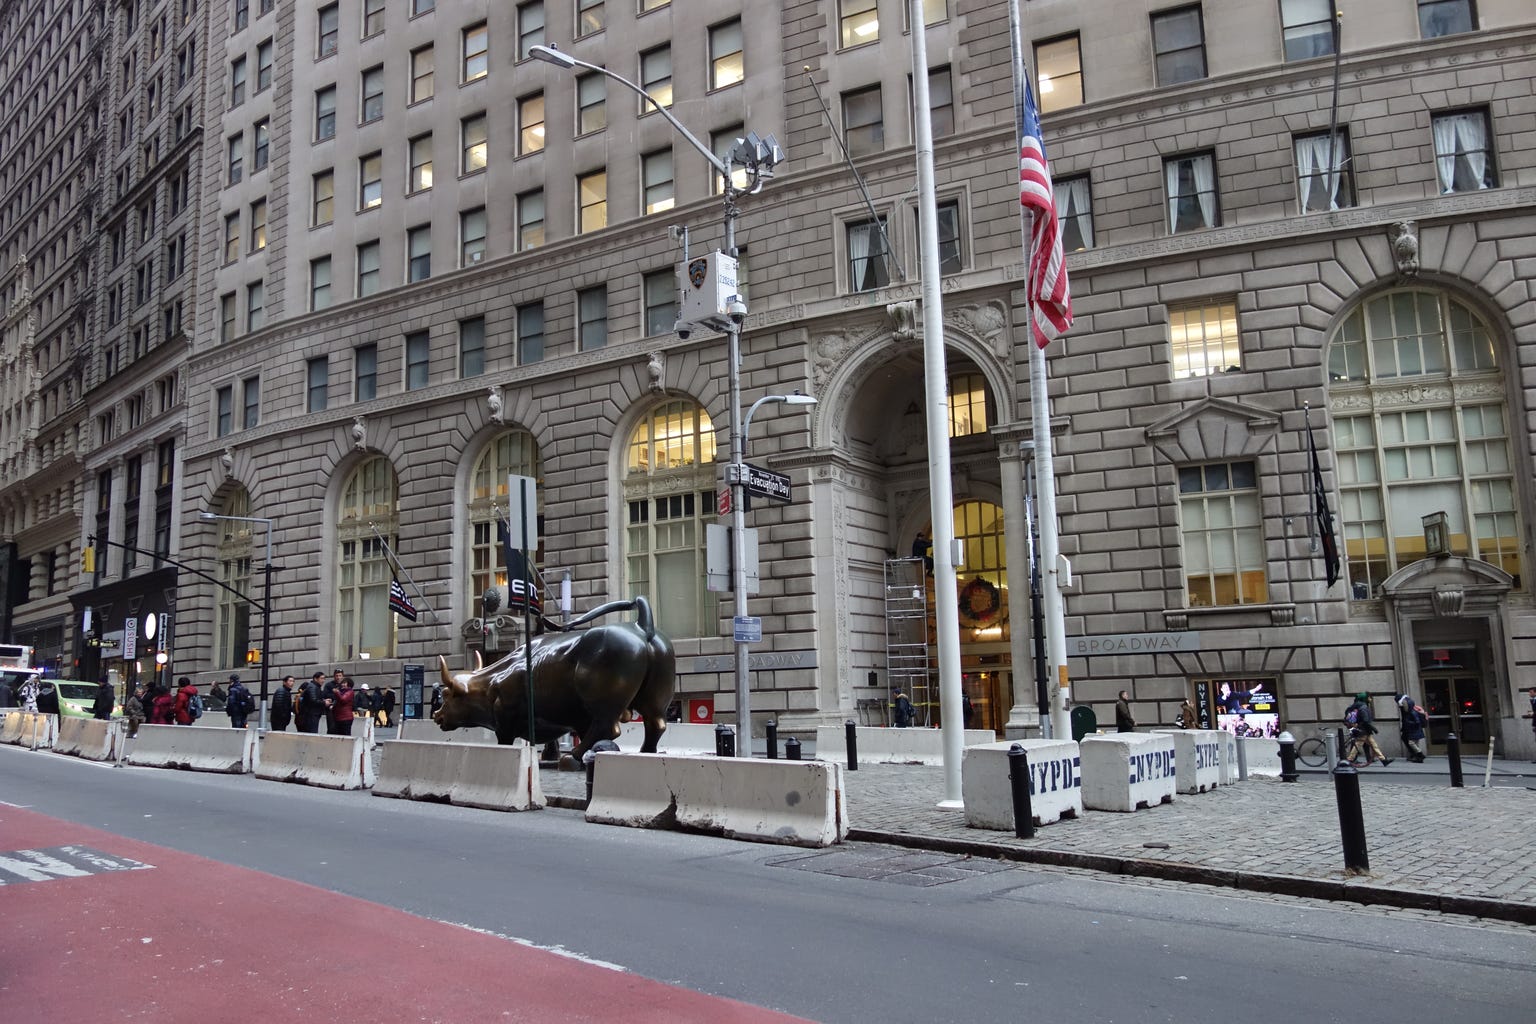
Cover photograph: Tdorante10, CC BY-SA 4.0, via Wikimedia Commons.
I checked the post with ItsAI detector and it shows that it's 94% generated!