


Chris Rokos’s firm lost 4.9% in October, as Hedgeweek reported on 10 November, relaying Bloomberg. In that month the Nasdaq puts in the firm’s June filing should have paid. Nobody has printed which positions lost it.
That filing is a 13F, the quarterly list of a manager’s long holdings in US-listed shares and options. I priced its lines, the positions it lists, against July and October. They account for July’s loss. At the option deltas I assume, an option’s move per dollar of its index, October leaves a wider gap: between a fifth of the loss and all of it sits outside them.
The paid half prices the case where the puts stayed on, against July and September, with our odds.
A falling Nasdaq and a losing month
QQQ, the fund that tracks the Nasdaq-100, fell 6.7% in October on its daily closes. On the June book, that is a month in which the puts would have paid, and Rokos lost 4.9% in it anyway.
I priced the lines of Rokos’s last 13F against their own closes for July and October, which no report on either month did. A year to date of about 8% after October implies about 13.6% at the end of September. Hedgeweek had printed 13.5% on 8 October.
Both Rokos figures rest on one Bloomberg report, relayed by Hedgeweek, and I found no second source for either. Hedgeweek gives the year to date as coming “according to people familiar with its performance”, and adds that “the firm manages around $22bn in assets”. On that base, 4.9% is about $1.08bn. Each point of return, a point of capital in what follows, is about $220m.
October was bad across strategies. Hedgeweek’s 4 November round up, again relaying Bloomberg, had Millennium down 2.3% and Marshall Wace’s Eureka down 5.4%. Arini Capital’s flagship credit strategy was down 12.1% through 23 October. Citadel’s Wellington made 1.7% and Quantedge 7.2%.
Neither report ties a cause to a Rokos position. The 10 November report wrote that “a sharp technology sector selloff coincided with political upheaval in Brazil and violent protests in France”. Rokos has made no statement about October that I could find.
The natural reading is that the tech selloff hit Rokos. Half of it holds: the peers’ numbers say October punished books of every kind. The other half is harder to square with the June book, which stood to gain from a falling Nasdaq while the puts were on. A 13F is the only public window on Rokos’s book, and October tests what that window can carry.
What the June filing shows
The 30 June 13F has 254 lines with a total value of $26.79bn. That total adds puts with a plus sign, so it measures no exposure. The Form 13F instructions require option entries “in terms of the securities underlying the options, not the options themselves”.
So a put line shows put notional: the value, at the 30 June close, of the shares the puts give the right to sell. The QQQ lines come to $12.48bn of put notional, $0.41bn of calls and $4.21bn of shares.
What surprised me in the filings was the put line itself. March’s 13F showed $1.72bn of QQQ put notional beside $1.76bn of calls, roughly matched. By June the put notional was seven times larger, the largest in the twelve quarter ends since September 2023, and the calls had shrunk to $0.41bn.
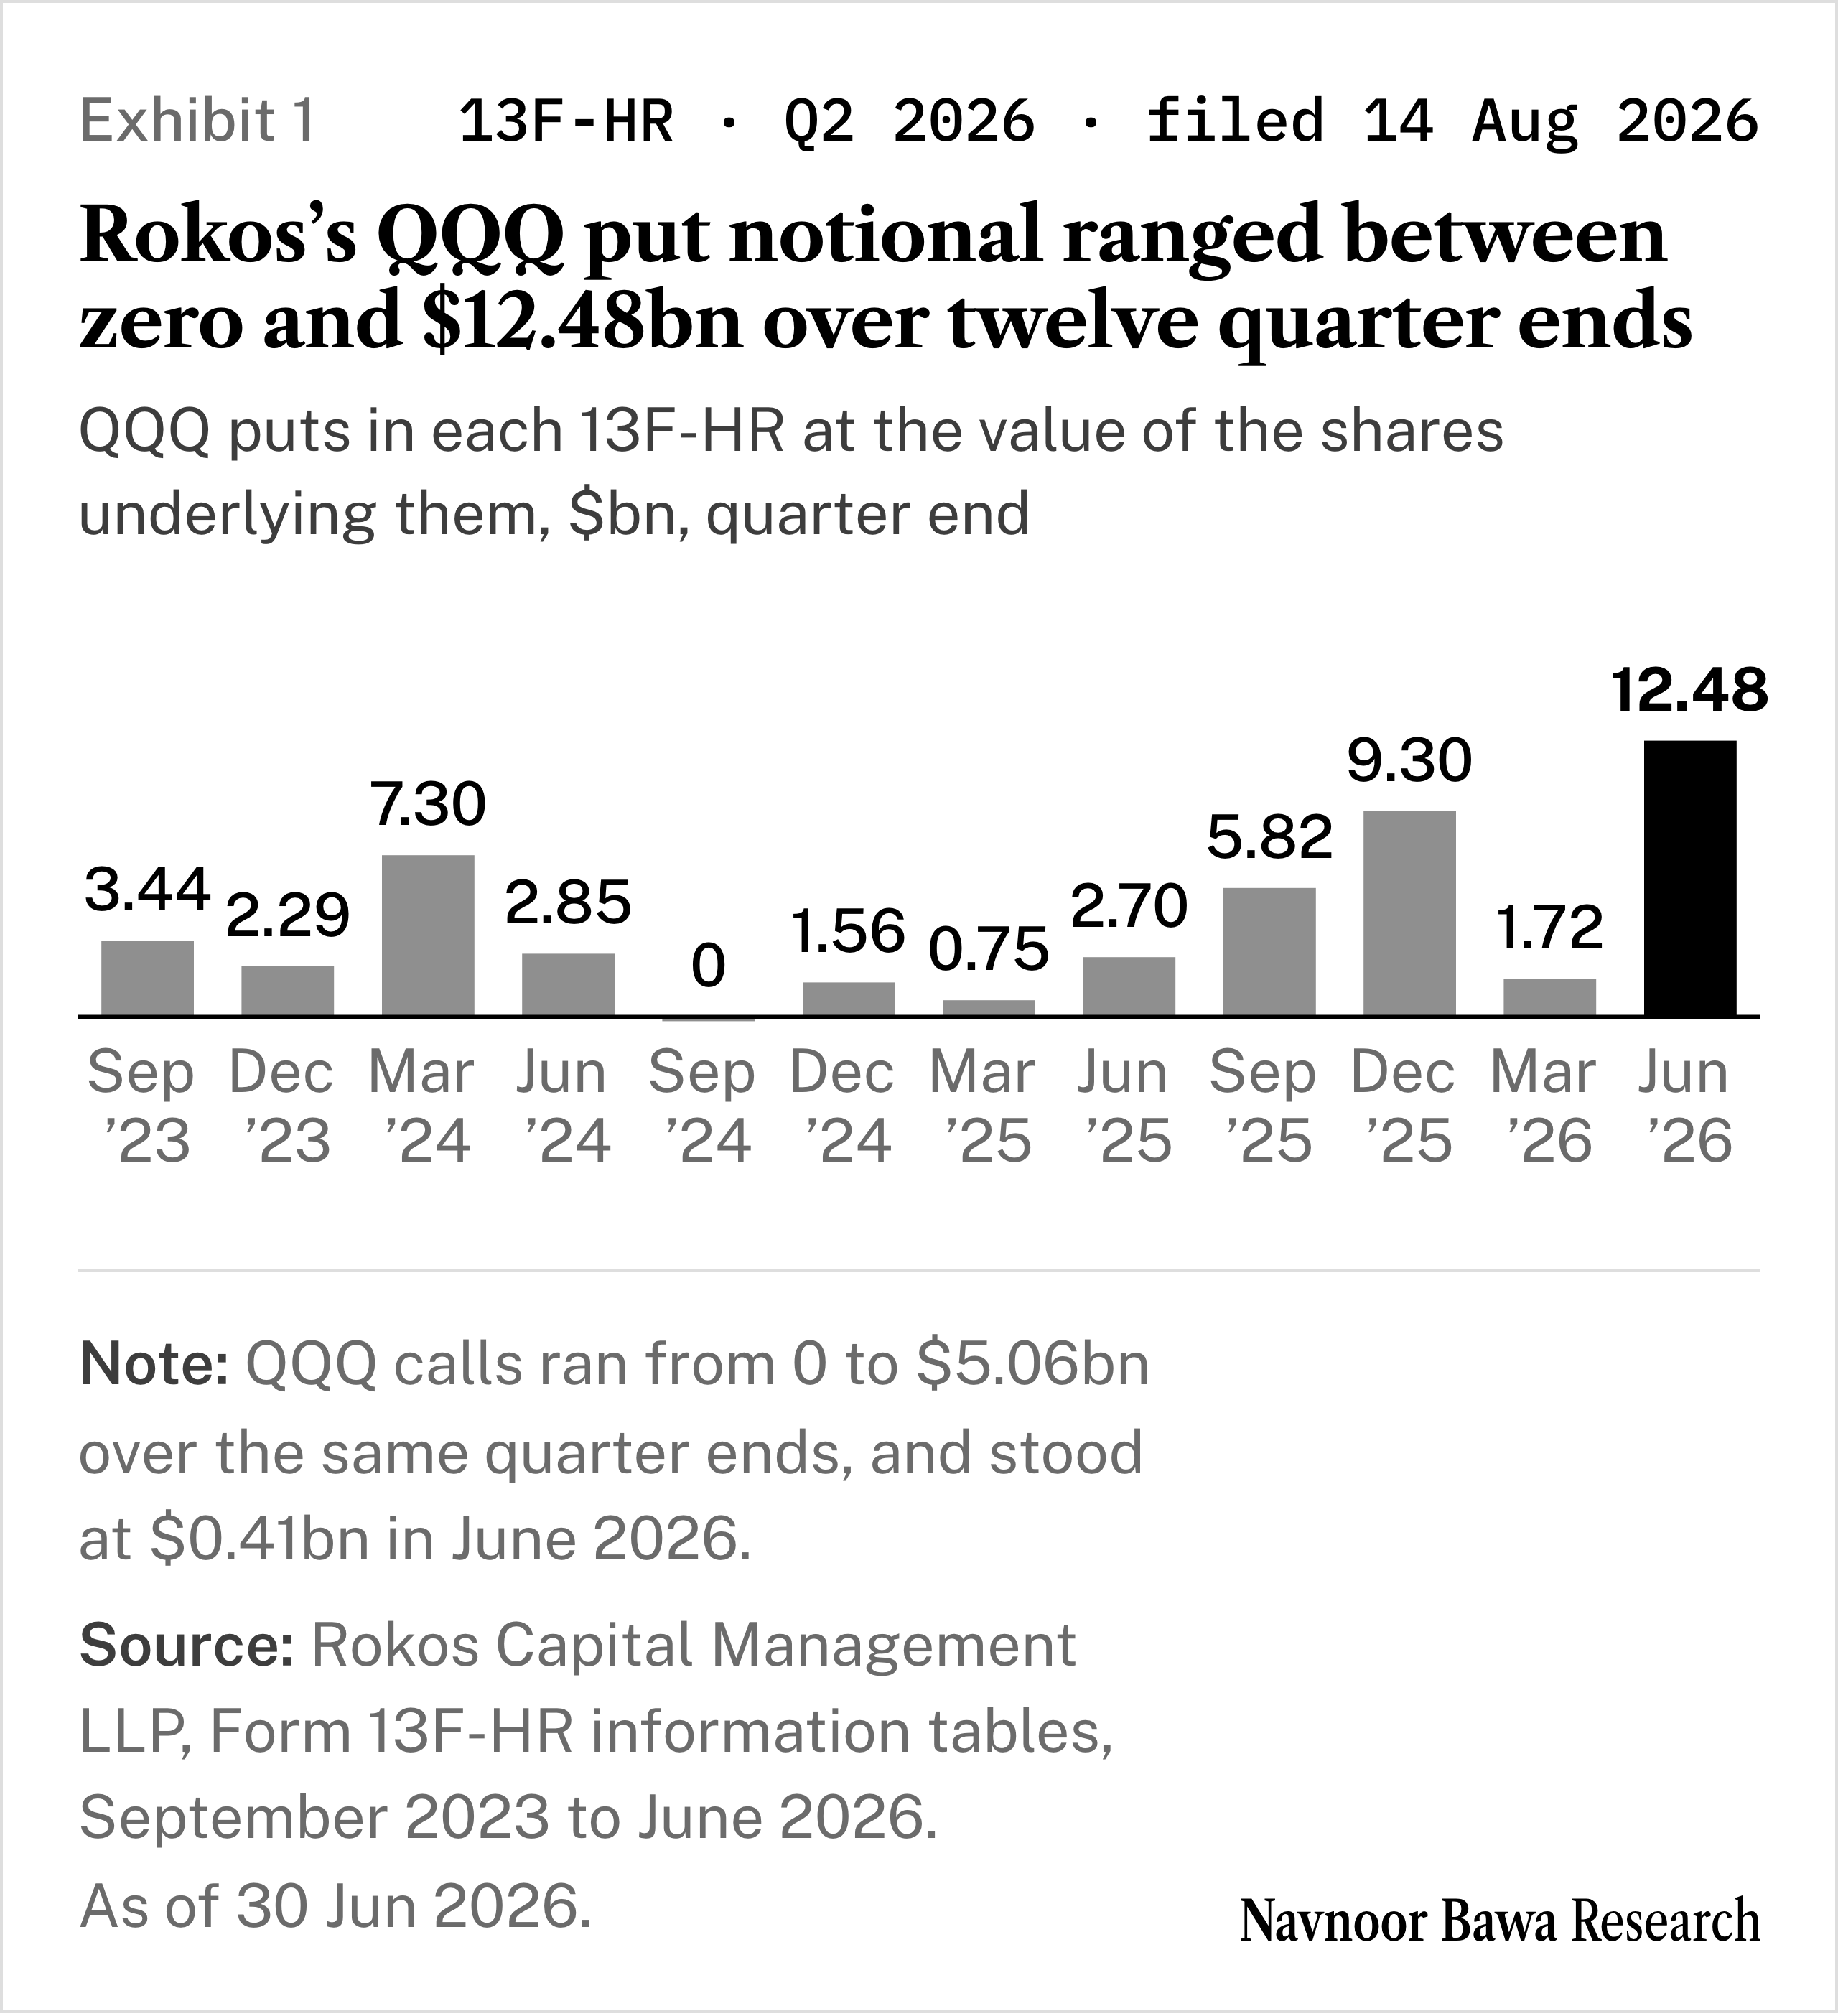
Exhibit 1 · Rokos’s QQQ put notional ranged between zero and $12.48bn over twelve quarter ends
Source: Rokos Capital Management LLP, Form 13F-HR information tables on EDGAR, September 2023 to June 2026 · as of 30 June 2026
A put line is close to a fixture, present in 11 of the 12 quarter ends, but its size swings, from nothing at September 2024 to June’s $12.48bn. A snapshot of a line like this says where October could have started, not where it did.
Why the put line grew that much is not stated anywhere I could find; the filing shows a size and gives no reason. The firm is largely one man’s: Chris Rokos, the chief investment officer, holds 50% to 75% of the UK partnership directly, by the schedules of its Form ADV, its SEC registration.
The July control
A month’s loss can sit in three places: the lines a 13F lists, the positions no 13F reports, and the trades made since the filing’s date. The July control prices the first of them at a month’s own closes, sets the result against what the fund lost, and runs it first on July, the month whose starting book the filing shows. It takes five steps:
Take each QQQ line at its 30 June size: $4.21bn of shares and $12.48bn of put notional.
Move the shares with QQQ’s return for the month.
Move the put notional the other way, scaled by a delta, the put’s move per dollar of QQQ. A 13F prints no strike or expiry, so the delta is assumed at 0.2, 0.35 and 0.5.
Run three states for the puts on the first day of the month: on at June’s size, cut to a fifth, or off.
Price the twelve largest other share lines and their options the same way, bracket the rest, and say what is left outside in points of capital.
The $0.41bn of QQQ calls is left out; pricing it would add a loss well under a point.
The 13F was filed on 14 August, so nobody could read it during July, but its date is the eve of the month. That makes puts on the state the filing records for 1 July.
QQQ fell 6.57% in July, from 736.40 on 30 June to 687.99 on 31 July, on its daily closes for the month. The QQQ shares alone, at June size, lost $277m. The twelve largest other share lines fell 6.0% weighted, SanDisk by 46.6%.
The firm lost too. Chris Rokos’s firm “fell 1.2% during the month”, Hedgeweek reported on 20 August, according to people familiar with the results. On the $22bn base that is about $264m.
With the puts on, the priced lines explain between -22% and 151% of July’s loss, where a negative share means they made money. They leave between -0.6 and +1.5 points of capital outside. At the lower deltas the filing’s lines can carry the whole of July, and at 0.5 they leave up to 1.5 points outside. It is one month, a check on the method and not a calibration of it.
The other two states fit July badly. With the puts cut to a fifth, the lines alone lose 103% to 201% of the firm’s July loss. With them off, they lose 134% to 213%. Either would need the rest of the book to have made money in a month the firm lost.
Same book, almost the same Nasdaq fall: the June lines carry Rokos’s 1.2% July, and October leaves them a wider gap in every state of the puts, at the deltas I assume.
October on the June book
October starts from the same book three months on, and the filing cannot say which state the puts were in on 1 October. With them off, the QQQ shares alone, a line that never passed $1.21bn before June, lose $280m. With them on, the puts offset some or all of that, by an amount that turns on the delta.
The stocks did more damage than the index. The twelve largest other share lines fell 11.8% weighted, almost twice QQQ’s 6.7%. Alphabet, the largest at $199m, fell 18.7%. SanDisk fell 33.9% and Lam Research 27.2%, while Norfolk Southern rose 10.9%.
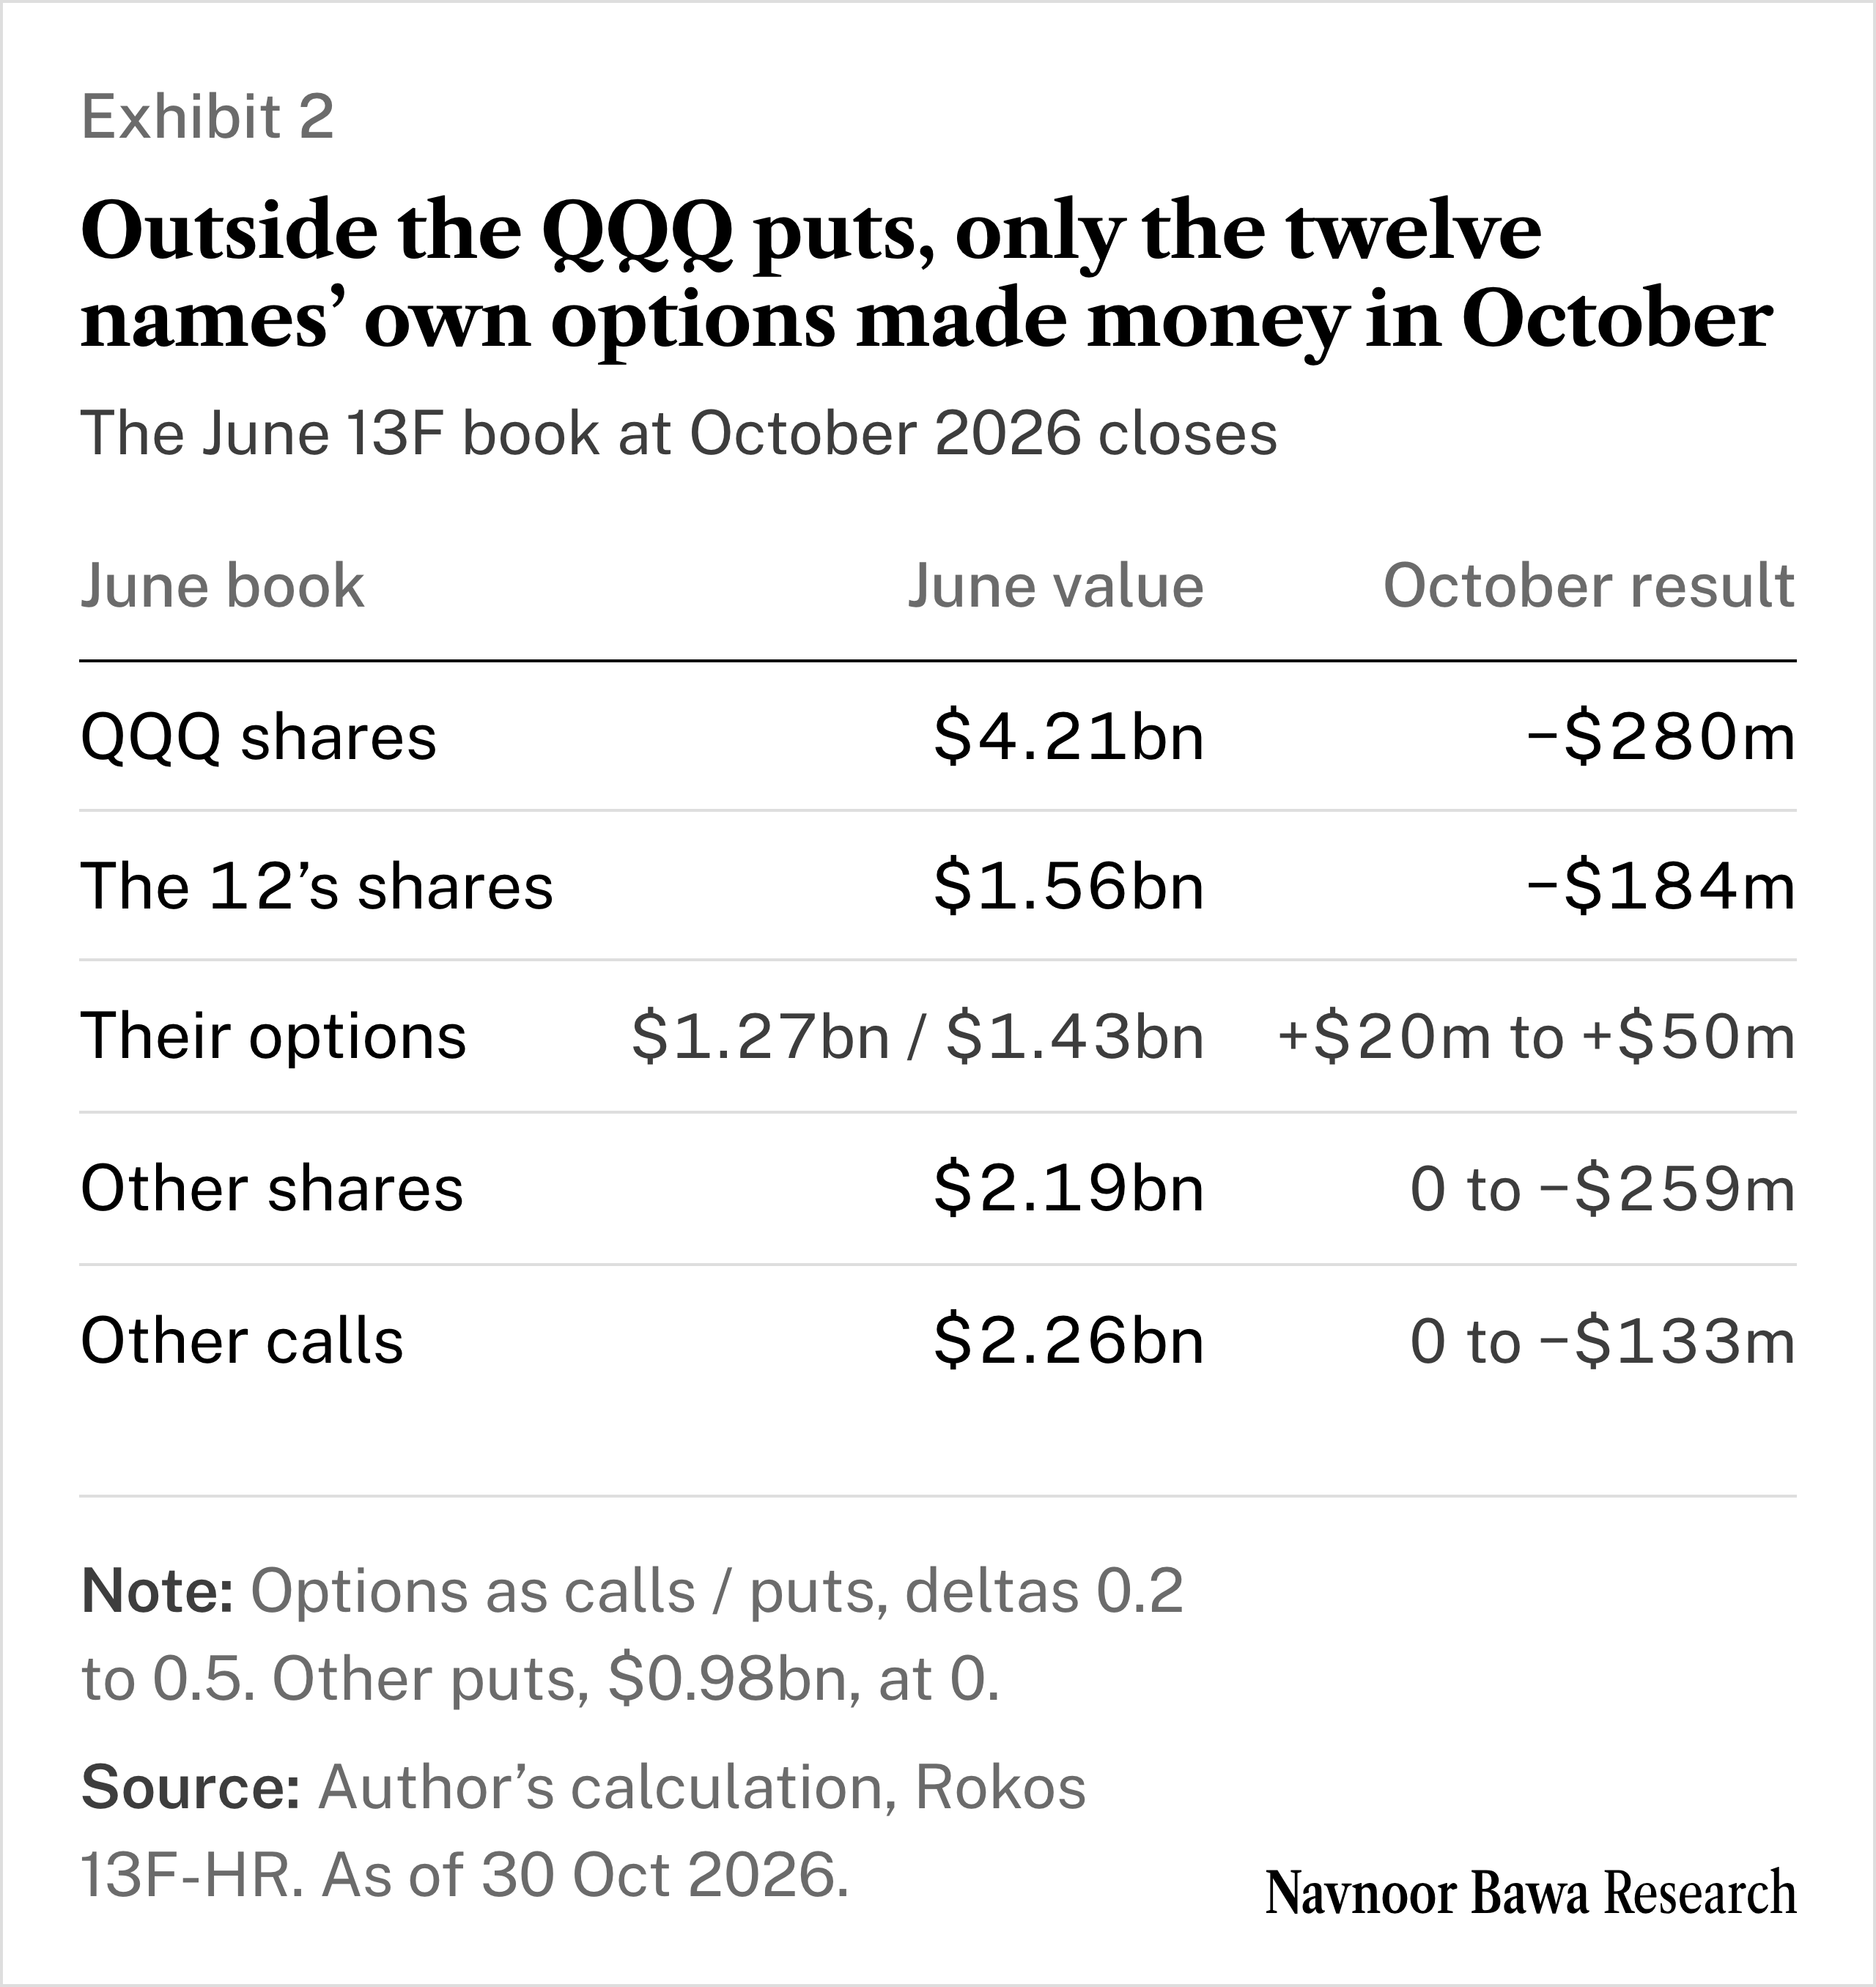
Exhibit 2 · Outside the QQQ puts, only the twelve names’ own options made money in October
Source: Rokos 13F-HR for 30 June 2026; QQQ and single stock daily closes for October 2026; author’s calculation at the stated deltas · as of 30 October 2026
The remaining shares are bracketed between flat and the twelve’s fall, and the other names’ calls at worst lose half their notional times that fall. Add the QQQ puts in each of their three states for the total. At the stated deltas, the priced lines explain 0% to 78% of October. They leave 1.1 to 4.9 points of capital outside. July, on the same lines with the puts on, left -0.6 to +1.5.
The puts off end is generous to the lines: it keeps the $4.21bn of QQQ shares, and if shares and puts were unwound together the QQQ lines would explain less. So the tech reading reaches at most 78% of October through these lines, and only with the puts off and every bracket at its harshest.
What no 13F shows
The SEC’s own staff say what is missing. Their answers on Form 13F are blunt: “You should not report put or call options that you write ... your short options positions like your short equity positions will not be reported on Form 13F or subtracted from a long position.” Every short, future, swap, currency forward, bond and listing outside the US sits beyond the filing. So does every trade in the three months between 30 June and 1 October, which the July control cannot price.
Brazil is the plainest case. The real, Brazil’s currency, fell 8.4% in one session, from 5.0377 per dollar on 23 October to 5.5007 on 26 October, on the central bank’s PTAX rate. An iShares MSCI Brazil line sat in 10 of the 12 quarter ends, $884m of it at December 2025. At June 2026 it was gone, leaving about $75m in Nu Holdings and XP.
No 13F can show a Brazilian bond or a position in the real, and no public document says which way Rokos held it. September’s 4.2% gain came in a month Hedgeweek framed around a bond rout, and a giveback in rates would be just as invisible. So would anything in France.
Which state the puts were in on 1 October is the question the free record cannot settle. The 30 September 13F, due by Monday 16 November, will.
→ Rokos’s 2025 QQQ put build, rebuilt from its 13F filings, Trade File No. 13 on Patreon.
If the puts were still on when October began, how much of Rokos’s 4.9% sat outside every line the June filing shows?
Below the paid line:
The verdict for the puts on case against July, with September as a second control.
The odds on the 30 September put line, one sensitivity table and the one kill line.
What this changes for reading any fund’s 13F, and what to watch into December.