


The Volatility Risk Premium · Jane Street’s $20.5B · SEC v. Karen Bruton · James Cordier’s $150M Collapse · Volmageddon · AQR Peer-Reviewed Research · Dispersion Trading · 0DTE Options · Nassim Taleb’s Congressional Warning · What Institutional Survivors Do Differently
Options Greeks · Deep Research

By Navnoor Bawa · LinkedIn · YouTube — The Mathematical Trader
∂C/∂t = − (S φ(d₁) σ) / (2√T)  −  rK e^(−rT) N(d₂)

Term 1: vol-driven erosion of extrinsic value
Term 2: interest-rate PV adjustment on strike

Theta (Θ) · Daily premium bleed · Non-linear acceleration toward expiry
Primary Sources Used: SEC EDGAR · BIS Quarterly Review · U.S. Congressional Record · CFA Institute FAJ · AQR.com · Bloomberg · SSRN · Institutional Investor
Every option is a melting clock. Theta is the rate of melt — the relentless, accelerating erosion of an option’s extrinsic value as it marches toward expiry. For buyers, theta is the enemy. For the hedge funds, market-makers, and systematic vol managers who have built institutional businesses around it, theta is a paycheck — backed by a structural risk premium that has been positive 86% of the time since 1990. This article follows the money to its primary sources: AQR’s peer-reviewed research, Jane Street’s $20.5 billion revenue disclosure, the SEC’s actual court complaint against Karen Bruton, the BIS Quarterly Review’s documented account of Volmageddon, and Nassim Taleb’s verbatim congressional testimony warning that this entire business model is designed to blow up. The full evidence trail — not the summary.
01 · Foundation — What Theta Measures, and Why the Curve Matters More Than the Number
Theta is the partial derivative of an option’s price with respect to the passage of time. In Black-Scholes it decomposes into two terms. The first, −(S φ(d₁) σ) / (2√T), captures the erosion of uncertainty value as the time horizon shrinks — it is always negative and maximised for at-the-money options, because ATM options carry the most extrinsic value relative to any hedge structure. The second term, −rK e^(−rT) N(d₂), is the interest-rate PV adjustment on the strike — structurally minor in low-rate environments but meaningful above 4%. According to Charles Schwab’s options education series, theta for an ATM option roughly doubles in magnitude as you move from 60 DTE to 30 DTE, and doubles again from 30 DTE to expiry.
The non-linearity is not a detail — it is the entire business model. Option Alpha’s documented analysis of SPX theta curves shows the steepest portion of the decay curve sits between 30 and 0 days to expiry. Professional theta desks target this window precisely — selling options in the 30–60 DTE range, collecting carry during the steepest segment, and rolling before gamma risk in the final week overwhelms the income. The goal is not to hold to expiry; it is to continuously harvest the steepest portion of the curve in a rolling cycle.
Core Mechanics — The Gamma–Theta Inverse
Theta and gamma are structural inverses. When you are short options — positive theta — you are simultaneously short gamma, meaning large moves in the underlying cost you money in an accelerating, non-linear way. The daily P&L of a theta position is approximated as: Theta collected − ½ × Gamma × (realised daily move)². The question is never “how much theta do I collect?” It is always “does my theta income exceed my expected gamma bleed given the current implied volatility environment?” That ratio — the VRP — is the structural foundation of the entire business.
02 · The Structural Premium — Why This Is a Business, Not a Bet
Theta harvesting would be a break-even grind if implied volatility were an unbiased forecast of realised volatility. It is not. Options consistently trade richer than subsequent realised volatility — a persistent mispricing called the Volatility Risk Premium (VRP). This premium is the reason that being a systematic option seller is a business, not a gamble.
The most precisely documented measurement comes from Barclays’ Volatility Risk Premium analysis, which reports — citing AQR research — that the VRP on the S&P 500 has been positive 86% of the time since 1990, with an average spread of 4.2 implied-volatility points above realised. This 86% figure is not an estimate — it is a direct data observation from the VIX minus subsequent 30-day realised vol series since 1990.
Why does it persist? The economics are identical to a property and casualty insurance market. Institutional hedgers — pension funds, endowments, liability-driven investors, structured-product manufacturers — are price-insensitive buyers of portfolio protection. They need puts regardless of whether implied vol is cheap or expensive. As The Hedge Fund Journal documents in its VRP strategy profile, the option seller is the structural counterparty to this demand — absorbing tail risk in exchange for a persistent premium, exactly as a property insurer absorbs storm risk in exchange for premium income.
“You can invest in value by buying a cheap stock and selling an expensive stock or harvest the volatility risk premium by selling an index option. But to harvest these risk premia in a risk-managed way that respects the nuances and complexities of the underlying markets requires expertise.”
— Roni Israelov, AQR Principal, Meet the Expert interview, AQR.com
03 · Execution Blueprints — How Professional Desks Actually Structure the Trade
1. Delta-Neutral Short Straddle / Strangle
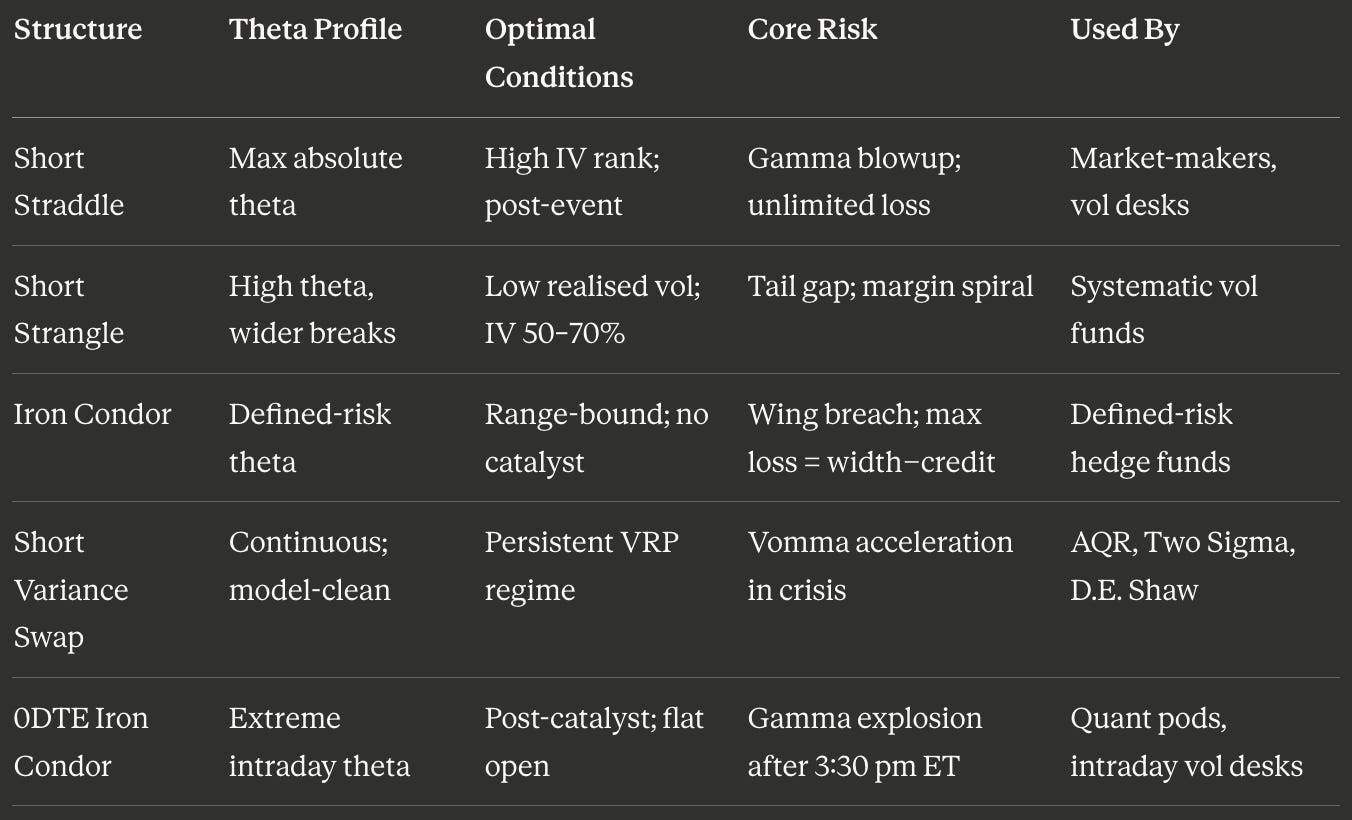
Sell an ATM call and ATM put at the same strike (straddle), or OTM call and put (strangle). Both generate the highest absolute daily theta of any non-directional structure. Both begin delta-neutral but drift as the underlying moves, requiring continuous rebalancing via the underlying — this is delta hedging: the mechanism that converts what would otherwise be a directional bet into a pure time-premium income trade. According to Options Trading IQ’s documented analysis of short straddles, the daily P&L equation is: theta collected minus gamma bleed. If realised vol stays below implied — the documented 86% base case — theta wins. When a large move arrives, the loss accelerates quadratically.
2. Iron Condor — The Defined-Risk Standard
Sell an OTM call spread and OTM put spread on the same underlying and expiry. Maximum gain is the credit received; maximum loss is spread width minus credit — both defined in advance. Institutional iron condors on SPX typically target the 30–60 DTE window with short strikes at 15–20 delta, and systematic programmes exit at 50% of maximum profit to avoid gamma explosion in the final expiry week. This is the go-to vehicle for funds with defined-risk mandates or for maximising capital efficiency under portfolio-margin rules.
3. Variance Swaps — The Institutionally Pure Expression
A variance swap pays the difference between realised and implied variance over a contract period. Its theoretical replication is a delta-hedged strip of options weighted by 1/K² across all strikes — making its pricing model-transparent, as Barclays’ analysis explains: “The payoff of a variance swap can be fully replicated using a strip of delta hedged options weighted by 1/strike-squared, hence the pricing of a variance swap is more transparent.” Short variance swaps are how large quant funds like Two Sigma, Citadel, AQR, and D.E. Shaw harvest vol premium at institutional scale without the path-dependency and rebalancing friction of vanilla short-options books. The Barclays paper explicitly flags the risk: “Its convex exposure to VRP is not an ideal feature because a spike in realised volatility usually means a significant loss.”
Strategy Comparison
04 · Jane Street — The $20.5 Billion Industrial-Scale Proof
Jane Street is the most transparent large-scale documented evidence that systematic theta monetisation at institutional scale works — and works at a size that dwarfs most hedge funds. As a global market-maker, it stands on the short side of the options market continuously, collecting bid-ask spread and the structural VRP on every order it fills, while delta-hedging its book to isolate time-premium income from directional risk.
The numbers are primary-source documented. Bloomberg reported in December 2024 that Jane Street generated $14.2 billion in net trading revenue in just the first three quarters of 2024, already surpassing its full-year 2023 record of $10.6 billion. The full-year 2024 figure, confirmed by Bloomberg in April 2025 and documented by Global Trading’s analysis of Jane Street’s internal financial documents, was $20.5 billion in net trading revenue — nearly double 2023 and enough to surpass Citigroup ($19.8B) and Bank of America ($18.8B). Net income was a record $13 billion.
In options specifically, Jane Street accounted for approximately 8% of all OCC contract volume in 2024 — trading close to one billion OCC contracts. The firm’s own statement to Global Trading explicitly describes options’ dual role: “In addition to our market-making activity, options also play a large role in our risk management. As part of our hedging activity, we use options to hedge firmwide tail risk and to manage risk from idiosyncratic exposures across various trading strategies.” This is the practitioner’s description of professional theta management: collect premium while simultaneously using options as a hedge against the very tail risks that can obliterate a theta book.
Revenue Benchmark: Jane Street vs. Global Banks, 2024
Jane Street: $20.5B net trading revenue (3,000 employees) · Citigroup trading: $19.8B (220,000 employees) · Bank of America trading: $18.8B (210,000 employees). Per-employee productivity at Jane Street is approximately $6.8 million in revenue ($20.5B ÷ 3,000) — roughly 76× the comparable figure at major banks. Source: Global Trading / Jane Street financial documents, 2025.
05 · Karen the Supertrader — The SEC Case File
No case illustrates both the genuine viability and the structural failure mode of systematic theta selling better than Karen Bruton, the Nashville-based options trader who became a celebrity under the name “Karen the Supertrader.” Her case is not anecdote — it is public record, documented in SEC court filings with full case numbers.
The strategy was described in detail across multiple TastyTrade appearances: sell short strangles on SPX, NDX, and RUT at approximately two standard deviations OTM, with 30–56 DTE, using portfolio margin to maximise capital efficiency. According to SteadyOptions’ documented analysis of her TastyTrade interviews, she executed over 50,000 trades in a single year — roughly 137 per day — and reported 13 consecutive profitable months through 2013.
In late 2014, a volatility spike created what would become the pivotal event. The SEC’s official litigation release LR-23551 states directly: “The two private hedge funds managed by Hope Advisers and Bruton — named Hope Investments LLC and HDB Investments LLC — have more than $175 million in net asset value. Hope Advisers and Bruton engaged in a continuous pattern of trading to inflate their compensation from the funds. They not only delayed realization of trading losses but also intentionally sized certain trades so the funds realized a profit every month.”
The SEC’s distribution page for SEC v. Hope Advisors (Case №16-cv-01752-LMM, N.D. Ga.) documents the mechanism: Bruton orchestrated trades that “enabled the funds to realize a large gain near the end of the current month while basically guaranteeing a large loss to be realized early the following month.” Without the fraudulent trades, Hope Advisors would have received almost no incentive fees from at least October 2014 — because the fund’s high-water-mark structure required actual realised profits.
The consent judgment, entered by the court on September 13, 2018, was documented in SEC Litigation Release LR-24285 (issued September 21, 2018), which permanently enjoined Bruton and Hope Advisors from future violations of Sections 206(1), (2), and (4) of the Investment Advisers Act and ordered them to pay disgorgement of $1,237,235 plus a civil penalty of $250,000. The administrative law judge’s decision (ALJ Decision id1386cff.pdf, 2019) covers the separate administrative industry-bar proceedings. The scheme had concealed more than $50 million in fund losses while collecting incentive fees on fictitious profits.
The Mechanism Behind the Fraud — and Why It Was Inevitable
The trade itself generated real returns through 2013. The structural failure: in a high-vol spike, a naked short-strangle book faces losses that arrive faster and larger than the high-water-mark fee structure can absorb. When losses exceeded accumulated profits, the fund crossed below its high-water mark and Bruton collected no fees. Rather than disclose this to investors, she engineered “paired scheme trades” — rolling losses into the next period. As SteadyOptions documented: “The scheme has enabled Hope Advisers to avoid realization of more than $50 million in losses in the hedge funds while earning millions of dollars in fees to which they were not entitled.”
06 · James Cordier — $150 Million, One Week, One YouTube Video
If Karen’s case shows the regulatory risk of concealing theta losses, James Cordier’s OptionSellers.com implosion shows the trading risk of absorbing them. Cordier was a Tampa-based Commodity Trading Advisor managing approximately $150 million for 290 clients, selling naked commodity options. According to Oil & Energy Online’s documented profile, OptionSellers.com billed itself as “The Global Authority on Selling Options” — Cordier had named his method “FUDOM” (FUndamentals combined with Deep Out of the Money options).
In autumn 2018, the U.S. Energy Information Administration (EIA) reported that stored natural gas was on track to hit its lowest end-of-October level in 13 years — the lowest since 2005. On November 14, 2018, a cold-front forecast triggered a surge: natural gas futures spiked 18% in a single session to a four-year high. Cordier held naked call positions on natural gas — unlimited upside risk — and simultaneous naked puts on crude oil, which had been collapsing. Both positions were catastrophically wrong simultaneously. When he could not provide collateral for the margin call, his broker INTL FCStone liquidated his positions, realising a loss of $150 million.
On November 15, OptionSellers.com sent all 290 clients an email with the subject line: “Catastrophic Loss Event.” The email stated that a “short call position in natural gas” had “overwhelmed all risk measures in place.” Not only had all client money been lost — clients were additionally on the hook to clear their margin deficits. Per a BusinessWire press release from Peiffer Wolf law firm, a footnote in INTL FCStone’s November 28, 2018 Statement of Financial Condition indicated that clients could each owe as much as $1.4 million — with $35 million in total additional margin debts demanded across the client base.
“The events of this past week have been incredibly devastating for our clients… a rogue wave that I was unable to navigate has likely cost me my hedge fund.”
— James Cordier, YouTube apology video, November 15, 2018, as reported by CNBC, November 21, 2018
Institutional Investor’s investigation found that attorney John Chapman — representing 110 of the 290 investors — stated: “Not only did everybody lose 100 percent of their investment, they were also hit with margin debt calls equal to about a third of their investment. FCStone has additionally been demanding that clients also pay interest on that money. Clients are taking out second mortgages just to put potatoes on the table.” The same investigation confirmed at least one client died awaiting restitution during the subsequent legal proceedings. Notably, Dimond Kaplan & Rothstein’s legal profile confirms that Cordier had a prior 2013 CFTC enforcement history — a $50,000 fine for improper trading — a red flag that went unexamined by the clearing firm and clients alike.
The Anatomy of the Failure
Cordier’s stated risk model, per The Short Bear’s documented reconstruction, allocated only 5% of capital per commodity and retained 50% in reserve — implying a maximum loss of $50,000 per $1M of AUM on natural gas. Actual losses were catastrophically larger, indicating actual position sizing far exceeded the stated parameters. Additionally, according to Peiffer Wolf’s legal filing, INTL FCStone “allowed OptionSellers.com to trade investors’ qualified funds, like IRA accounts, on margin” — a practice generally not permitted in qualified retirement accounts.
07 · Volmageddon — The BIS-Documented Feedback Loop
February 5, 2018 is the event that permanently rewired how professional traders think about short-vol strategies. The VIX had spent 2017 in near-record-low territory; short-vol had become one of the most crowded trades in market history. The retail vehicle that crystallised this crowding was the VelocityShares Daily Inverse VIX Short-Term ETN (XIV), issued by Credit Suisse.
On February 5, the VIX closed at 37.32 — up from 17.31 on February 2. The magnitude of the spike was not merely a function of equity selling. The Bank for International Settlements’ March 2018 Quarterly Review provides the most precisely documented mechanism: “Due to the mechanical nature of the rebalancing, a higher VIX futures price necessitated even greater VIX futures purchases by the ETPs, creating a feedback loop. Transaction data show a spike in trading volume to 115,862 VIX futures contracts, or roughly one quarter of the entire market, and at highly inflated prices, within one minute at 16:08.”
XIV triggered an “acceleration event” per its prospectus — Credit Suisse disclosed that XIV’s intraday indicative value fell to 20% or less of the prior day’s closing value, triggering the contractual termination clause. The academic post-mortem, published in the Financial Analysts Journal, Volume 77(3) (Augustin, Cheng & Van den Bergen, 2021), states: “The Volmageddon episode can be explained by a combination of market concentration and hedge and leverage rebalancing. The large market share in VIX futures contracts held by leveraged ETPs exacerbated the volatility shock, sending the ETPs’ rebalancing mechanisms into overdrive. This negative feedback loop kept pushing futures prices upward, leading to huge downward pressure on the ETPs’ AUM and, eventually, to investor losses of around 90%.”
The BIS paper explicitly deployed the phrase now standard in the industry — describing short-vol strategies as “collecting pennies in front of a steamroller.”
Volmageddon By the Numbers
XIV AUM on February 4, 2018: $1.86 billion · XIV AUM post-event: ~$63 million · Single-day investor losses: ~84% (XIV terminated per acceleration clause) · VIX futures contracts traded in 1 minute at 16:08: 115,862 — ~25% of the entire VIX futures market · S&P 500 decline on the day: 4.2% (BIS Box A: “a 3.8 standard deviation daily move”)
Sources: BIS Quarterly Review, March 2018 · Financial Analysts Journal, Vol. 77(3), 2021
08 · AQR’s Peer-Reviewed Evidence Trail
Roni Israelov at AQR has produced the most rigorous academic evidence base on the mechanics and returns of institutional options writing. His publications are the foundation that serious theta funds cite in pitch decks — and unlike the promotional material those pitch decks often include, his papers are SSRN-archived and peer-reviewed.
The 2015 paper, “Covered Calls Uncovered” (Israelov & Nielsen, Financial Analysts Journal, SSRN #2444999), formally decomposes covered-call returns into three factors: equity market exposure, short-volatility exposure, and an equity timing factor. The finding: the short-volatility component, which contributes less than 10% of total strategy risk, achieves a realised Sharpe ratio close to 1.0. The equity timing component — the implicit market-timing bet embedded in covered-call writing — contributes large risk for near-zero return. Conclusion: the VRP, not equity timing, is the engine of covered-call alpha.
The 2017 paper with Tummala, “Which Index Options Should You Sell?” (SSRN #2990542), answers the operational question every vol desk faces: how to run the book. Core finding: the choice of moneyness, maturity, and weighting scheme materially changes realised Sharpe ratios. ATM options carry the most theta per notional dollar but also the most gamma risk. The paper calculates optimal combinations across the volatility surface that substantially improve risk-adjusted returns versus naive ATM selling.
The companion paper “Covering the World: Global Evidence on Covered Calls” (SSRN #2990522) extends the analysis to eleven global equity indices and finds the same pattern in every market: the short-volatility component achieves the highest Sharpe ratio; market timing adds risk without commensurate return. The VRP is real, cross-market, and persistent — not a US-specific artefact.
AQR’s Practical Implementation Framework
Per Israelov’s AQR interview, the VRP can be deployed in three institutional configurations: (1) Pure high-risk VRP allocation for maximum premium exposure. (2) VRP alongside equities in a 0.5-beta portfolio — functioning as a “defensive equity” or hedge fund replacement. (3) Small VRP overlay on a 1.0-beta equity portfolio. The VRP’s low correlation to value, momentum, carry, and trend-following factors makes it genuinely additive in a multi-factor portfolio. Critical caveat: that low correlation persists only in normal regimes. In acute crises, correlation jumps toward equities precisely when investors most need the diversification.
09 · Dispersion Trading — The Correlation Risk Premium Beneath the Theta
The deepest institutional layer of theta monetisation is dispersion trading — where the alpha source is not just the VRP but the correlation risk premium: the structural tendency of implied pairwise stock correlations (embedded in index options) to exceed subsequent realised correlations.
The trade: buy options on S&P 500 index constituents (long single-stock vol) and sell options on the index itself (short index vol, collecting index theta). The trade profits when stocks move independently rather than in lockstep. It loses when macro shocks cause correlations to spike — 2008, COVID, Volmageddon. According to Resonanz Capital’s analysis of the CBOE DSPX Dispersion Index, the correlation risk premium has historically averaged approximately 7 percentage points (S&P 500 implied correlation at 39.5% vs. realised at 32.5%). The CBOE launched the DSPX Index in September 2023 to provide real-time forward-looking dispersion measurement.
Assenagon Asset Management’s equity volatility dispersion strategy — managing over €1 billion — exploits this premium through bespoke stock and sector selection rather than generic constituent options. Their approach uses a hybrid of plain vanilla options and volatility swaps capped at 2.5× strike to control vomma risk. The portfolio is delta-hedged at close of business each day. Crucially, the strategy generates positive daily carry: the short index vol leg produces more theta than the long single-name legs consume — making the dispersion trade a net theta collector at the portfolio level, not just a relative-vol bet.
Fulcrum Asset Management’s analysis of theta-neutral versus vega-neutral dispersion schemes provides the practitioner’s comparison: theta-neutral dispersion sells one unit of index vega but buys back only a fraction of single-stock vega (determined by the implied-vol ratio). This produces purer correlation risk premium exposure — but creates the most extreme drawdowns when implied correlation spikes sharply.
10 · The 0DTE Revolution — Theta Compressed Into 6.5 Hours
The CBOE’s 2022 introduction of daily SPX expirations compressed the entire theta lifecycle into a single session. By 2024, 0DTE options accounted for approximately 49% of all SPX options trading volume. The theta mechanics are extreme: according to MarketXLS’s documented analysis of 0DTE SPX theta curves, an ATM option carrying $5.00 of extrinsic value at the 9:30 open can lose $0.40–$0.60 in the first hour, with the decay curve accelerating sharply after 3:30 pm ET as the option approaches terminal hours.
Resonanz Capital’s analysis of institutional 0DTE adoption documents that by 2024, large systematic funds had built scalable 0DTE workflows, using them primarily for intraday premium harvesting and targeted convexity plays around macro catalysts. A quantitative study of 0DTE SPX iron condors found an 89.2% win rate on trades entered at 3:58 pm ET, with an average expected return of $975 per trade — but a maximum drawdown of $45,000, an approximately 46× loss ratio on worst-case days. This is not an anomaly; it is the defining signature of all systematic theta strategies: high win rate, catastrophic loss asymmetry on tail events.
11 · Taleb’s Congressional Warning — The Verbatim Record
Nassim Taleb — himself a former derivatives trader at Credit Suisse First Boston, UBS, BNP-Paribas, and Indosuez before founding Empirica Capital — testified before Congress on September 10, 2009, to the House Subcommittee on Investigations and Oversight, Committee on Science and Technology (Hearing Vol. 111–48). His written statement is archived in the Congressional Record.
The testimony directly addresses the theta-harvesting business model by mechanism. From the written statement, archived verbatim: “I have shown that operators like to engage in a ‘blow-up’ strategy, (switching risks from visible to hidden), which consists in producing steady profits for a long time, collecting bonuses, then losing everything in a single blowup. Such trades pay extremely well for the trader — but not for society. For instance, a member of Citicorp’s executive committee collected $120 million of bonuses over the years of hidden risks before the blowup.”
His VaR critique applies with precise force to theta books. From the same testimony: “A standard daily VaR of $1 million at a 1% probability tells you that you have less than a 1% chance of losing $1 million or more on a given day… Data shows that methods meant to improve the standard VaR, like ‘expected shortfall’ or ‘conditional VaR,’ are equally defective with economic variables — past losses do not predict future losses.”
Taleb’s personal investment philosophy — the structural inverse of the theta harvester — places 85–90% of capital in safe instruments and uses 10–15% to buy deep OTM options that profit from the catastrophic events that destroy theta books. At Universa Investments, where Taleb serves as scientific advisor, this long-tail approach returned 3,612% in March 2020 alone — and 4,144% for Q1 2020 year-to-date — precisely the month a generic, unmanaged VRP exposure blew out -65%, when realised volatility of 90% was more than triple one-month implied volatility. Ostrum’s actively managed Seeyond strategy, by contrast, limited its drawdown to approximately -13% by reducing short-vol exposure ahead of the spike.
12 · What Institutional Survivors Do Differently
Every documented theta blow-up examined in this article — Karen Bruton’s SEC fraud, James Cordier’s $150 million commodity implosion, and Volmageddon’s ETP feedback loop — shares the same structural failure mode: concentration, inadequate hedging, and position sizing that assumed historical volatility distributions were forward-looking. The programmes that have run durable theta businesses share the following operational DNA.
Contrarian vol-scaling. Ostrum Asset Management’s Seeyond VRP strategy — winner of The Hedge Fund Journal’s UCITS Hedge 2024 award for best-performing volatility strategy over 10 years — explicitly increases short-vol exposure after implied volatility spikes. This is when the VRP is richest: fear-premia are highest, and forward-looking option premium is most elevated above expected realised vol. Selling protection in a calm market is low-premium insurance; selling it after a spike, when buyers are desperate, is maximum-premium insurance.
Greek budgeting over premium collection. Professional desks size by theta efficiency — theta per dollar of margin — not by raw premium collected. Daily portfolio theta targets of 0.06%–0.10% of total capital are the discipline structure that prevents gradual over-leverage during prolonged low-volatility periods. Hard aggregate vega limits as a percentage of NAV are maintained separately.
Geographic and asset diversification. Ostrum harvests VRP across US, European, and Asian equity indices. Assenagon adds geographic and single-stock diversification to its dispersion book. Concentrating a theta programme entirely in SPX amplifies correlation risk during US-specific crises and Volmageddon-type ETP feedback loops.
Hard exit rules. Exit defined-risk positions at 2× the initial credit received. Roll positions before the final expiry week. The 50% max-profit rule for iron condors is the mechanism that keeps the book out of the gamma danger zone where delta-hedging costs and mark-to-market variance both accelerate exponentially.
13 · The Bottom Line
The formula at the top of this article — ∂C/∂t = −(S φ(d₁) σ)/(2√T) − rK e^(−rT) N(d₂) — is not a money printer. It is a precise mathematical description of what time costs an options buyer, and therefore what time pays an option seller. The business built around systematically collecting that payment is real, documented, and institutionally significant.
The VRP has been positive 86% of the time since 1990 (Barclays/AQR). AQR’s peer-reviewed research shows the short-vol component of covered calls achieves Sharpe ratios close to 1.0 (FAJ, 2015). Jane Street built $20.5 billion in 2024 net trading revenue on systematic market-making and option-premium collection. The S&P 500 correlation risk premium has historically averaged 7 percentage points above realised (Resonanz Capital/DSPX).
But the SEC’s court filings document that Karen Bruton concealed more than $50 million in fund losses behind options roll trades. The CNBC record shows James Cordier sent 290 clients a “Catastrophic Loss Event” email and wept on YouTube. The BIS Quarterly Review documents that 115,862 VIX futures contracts traded in a single minute during Volmageddon, destroying a $1.86 billion product. Ostrum’s decade-long award-winning VRP strategy limited its COVID drawdown to ~13% through active risk management — while an unmanaged generic VRP exposure would have lost 65% in that same month. And Nassim Taleb told Congress in 2009 — on the record, verbatim — that this entire category of trade is designed to “produc[e] steady profits for a long time, collecting bonuses, then losing everything in a single blowup.”
The professional edge is not in avoiding the blowup. It is in pricing the risk correctly, sizing positions to survive the blowup when it arrives, and remaining in business when the inevitable claim materialises. Theta is a business. But it is the insurance business — and every insurer eventually pays a catastrophic claim.
📊 Want Deeper Quantitative Analysis?
This research required extensive data collection, primary-source verification across SEC filings, BIS documents, congressional records, peer-reviewed journals, and institutional reports — followed by synthesis into a coherent analytical framework.
If you found value in this deep-dive, I publish exclusive quantitative research, trading strategies, and institutional-grade analysis on Patreon — the same primary-source rigour you’ve just read, applied to new strategies, instruments, and market events on a regular basis.
By joining, you’ll be directly supporting this work and motivating more research at this level of depth.
→ Join the Patreon community here
All Sources — Full URLs
SEC Court Documents
SEC LR-23551 (Hope Advisors complaint): https://www.sec.gov/enforcement-litigation/litigation-releases/lr-23551
SEC LR-24285 (Final judgment, Sept. 13, 2018): https://www.sec.gov/enforcement-litigation/litigation-releases/lr-24285
SEC v. Hope Advisors distribution page (Case №16-cv-01752-LMM): https://www.sec.gov/enforcement-litigation/distributions-harmed-investors/sec-v-hope-advisors-llc-et-al-case-no-16-cv-01752-lmm-nd-ga
ALJ Decision id1386cff.pdf (2019, industry bar + disgorgement): https://www.sec.gov/files/alj/aljdec/2019/id1386cff.pdf
Congressional Record
Taleb written testimony, House Science Committee, Sept. 10, 2009: https://republicans-science.house.gov/_cache/files/e/7/e76e36c5-a9f5-4cc0-88dd-f1ac967bfd10/DC2971441259C5AE89B6D7164F4BB3DE.091009-taleb.pdf
Full hearing transcript, Vol. 111–48: https://www.govinfo.gov/content/pkg/CHRG-111hhrg51925/html/CHRG-111hhrg51925.htm
BIS & CFA Institute
BIS Quarterly Review, March 2018 (Volmageddon mechanism): https://www.bis.org/publ/qtrpdf/r_qt1803a.pdf
Financial Analysts Journal Vol. 77(3), 2021 (Volmageddon analysis): https://rpc.cfainstitute.org/research/financial-analysts-journal/2021/volmageddon-failure-short-volatility-products
AQR & SSRN
Covered Calls Uncovered (Israelov & Nielsen, FAJ 2015, SSRN #2444999): https://papers.ssrn.com/sol3/Papers.cfm?abstract_id=2444999
Which Index Options Should You Sell? (Israelov & Tummala, SSRN #2990542): https://papers.ssrn.com/sol3/papers.cfm?abstract_id=2990542
Covering the World: Global Covered Call Evidence (SSRN #2990522): https://papers.ssrn.com/sol3/papers.cfm?abstract_id=2990522
Roni Israelov Meet the Expert interview: https://www.aqr.com/Insights/Research/Interviews/Meet-the-Expert-Roni-Israelov
AQR VRP white paper, 2018: https://www.aqr.com/Insights/Research/White-Papers/Understanding-the-Volatility-Risk-Premium
Barclays
Barclays VRP analysis (86% positive frequency; 4.2 vol pts avg): https://indices.cib.barclays/dms/Public%20marketing/Volatility_Risk_Premium.pdf
Bloomberg
Jane Street full-year 2024 revenue ($20.5B), April 2025: https://www.bloomberg.com/news/articles/2025-04-23/jane-street-s-20-5-billion-trading-haul-tops-citigroup-bofa
Jane Street Q1–Q3 2024 revenue ($14.2B), Dec. 2024: https://www.bloomberg.com/news/articles/2024-12-02/jane-street-reaps-14-2-billion-in-first-nine-months-of-trading
Primary News & Legal Sources
Global Trading / Jane Street internal documents: https://www.globaltrading.net/jane-street-took-10-of-of-us-equity-market-in-2024/
CNBC — Cordier YouTube apology, Nov. 21, 2018: https://www.cnbc.com/2018/11/21/a-risky-natural-gas-bet-gone-awry-leads-to-weepy-youtube-confessional.html
Institutional Investor — client deaths, margin debts: https://www.institutionalinvestor.com/article/2bsx4k0wcflzwsbz26i9s/culture/remember-wall-streets-viral-laughingstock-optionseller-com
BusinessWire / Peiffer Wolf — $35M margin debts: https://www.businesswire.com/news/home/20181205005817/en/PWCK-Law-Firm-Investors-Wiped-Out-in-OptionSellers.com-Natural-Gas-Scheme-Should-Seek-Help-Now-in-%E2%80%9CDouble-Whammy%E2%80%9D-Debacle-with-Margin-Calls
Peiffer Wolf — FCStone legal filing: https://www.peifferwolf.com/optionsellers-and-intl-fc-stone-lawsuit/
Dimond Kaplan & Rothstein — Cordier’s 2013 CFTC charge: https://www.dkrpa.com/blog/optionsellers-com-causes-millions-in-investor-losses/
The Short Bear / Substack — Cordier blow-up timeline:

Strategy & Fund Analysis
The Hedge Fund Journal — Ostrum/Seeyond VRP (UCITS Hedge 2024 award, best 10-year volatility strategy; ~13% managed COVID drawdown vs. -65% generic unmanaged VRP exposure): https://thehedgefundjournal.com/harvesting-the-volatility-risk-premium-globally/
The Hedge Fund Journal — Assenagon dispersion strategy mechanics: https://thehedgefundjournal.com/assenagon-long-short-volatility-strategy-equity/
Resonanz Capital — DSPX index, correlation risk premium: https://resonanzcapital.com/insights/dispersion-trading-and-the-dspx-index
Resonanz Capital — 0DTE institutional adoption: https://resonanzcapital.com/insights/same-day-options-same-day-alpha-institutional-lessons-from-0-dtes-boom
Fulcrum Asset Management — theta-neutral vs. vega-neutral dispersion: https://fulcrumasset.com/insights/investment-insights/white-papers/a-few-thoughts-on-dispersion-weighting-schemes/
SteadyOptions — Karen TastyTrade interview analysis: https://steadyoptions.com/articles/karen-the-supertrader-myth-or-reality-r110/
SteadyOptions — Karen $50M concealed losses: https://steadyoptions.com/articles/karen-the-supertrader-too-good-to-be-true-r160/
EBC Financial — VIX 17.31 to 37.32; XIV acceleration event: https://www.ebc.com/forex/volmageddon-explained-when-volatility-turns-violent
Option Alpha — 0DTE SPX volume share (49%): https://optionalpha.com/learn/0dte
Option Alpha — theta decay curves: https://optionalpha.com/blog/0dte-options-time-decay
MarketXLS — 0DTE theta acceleration: https://marketxls.com/blog/0dte-theta-decay-what-every-trader-should-know
StudyLib — 0DTE 89.2% win rate study: https://studylib.net/doc/27926930/ultra-short-dated-option-spreads-as-a-fund-strategy--pearce-
Universa Investments:
https://www.universainvestments.com/
About the Author
Navnoor Bawa publishes institutional-grade quantitative research on options, derivatives, and systematic trading strategies.
🎓 Follow on LinkedIn for research updates and professional commentary
📺 Subscribe on YouTube — The Mathematical Trader for video breakdowns of quantitative strategies
📊 Support on Patreon for exclusive deep-dives, trading strategies, and institutional-grade analysis
Research conducted March 2026 · Primary sources: SEC EDGAR, BIS, U.S. Congressional Record, CFA Institute FAJ, AQR.com, Bloomberg, SSRN
Cover photograph: Ken Lund, CC BY-SA 2.0, via Wikimedia Commons.
Very well written. Loved it.