


SoftBank Is Not One Trade. It Is Five Recurring Structural Edges.
Most financial writing about SoftBank asks the same question: was Masayoshi Son a genius or a reckless gambler? That framing misses the more interesting analysis entirely. For sophisticated hedge funds, SoftBank was never a single binary bet. It was a layered set of structural mispricings — some favoring a long position in the stock itself, some rewarding those who shorted its overvalued portfolio companies, some extracted from the mechanics of its derivatives flow — that repeated with enough regularity to be traded systematically.
The five trades documented here span 2018 to 2024. Some are long SoftBank. Some are short SoftBank’s portfolio companies. One rides the dealer hedging mechanics created by SoftBank’s own internal trading unit. All are supported by primary evidence: earnings call transcripts, SoftBank IR press releases, SEC filings, and contemporaneous reporting. None required privileged access to information Son had not already disclosed publicly.
🎬 Prefer to watch instead of read?
I made a full video breakdown of all five trades — same depth, same primary sources, structured as a research briefing.
📊 Want deeper quantitative analysis like this?
This research took significant time in data collection, primary-source verification, and structural analysis. If you found value in this deep-dive, I publish exclusive quantitative research, trading strategies, and institutional-grade analysis on Patreon. By joining, you will be supporting independent research and motivating more content at this level.
→ Read the full institutional trade note here
Or join the community: The Mathematical Trader Patreon
Follow along on: YouTube — @TheMathematicalTrader | LinkedIn — Navnoor Bawa
Trade 1 — The NAV Discount Long: Elliott Management and Tiger Global
The Setup: A $100+ Billion Gap, Visible to Anyone Who Could Read a Filing
SoftBank Group’s market capitalization has chronically traded below the aggregate value of its listed holdings — a standard conglomerate discount amplified by three structural factors: Masayoshi Son’s unilateral governance style, the group’s leverage, and persistent market skepticism about unverifiable private marks inside the Vision Fund.
By March 23, 2020, SoftBank’s own press release announced a ¥4.5 trillion ($41 billion) emergency monetization program on the same day its shares were trading at a record 73% discount to aggregate net asset value — meaning the market was pricing $1 of SoftBank’s Alibaba, Arm, Sprint, and Japanese telecom assets at 27 cents through the stock. The 7gc.co analysis confirmed the 73% discount, attributing it to “markets mistrust of Masa’s long-term strategy, FMV reporting disparities, and high net debt levels, currently at a 4.5x Net Debt/EBITDA multiple”.
Son himself confirmed the spread on his Q1 FY2021 earnings call (August 2020): “The equity value, well, the ¥24.4 trillion is the current shareholder value. And the SoftBank market cap is ¥13 trillion or so” — a gap of roughly $105 billion, disclosed live, in public, with no delay.
The trade structure was straightforward: buy SFTBY at the discount, apply activist pressure to force buybacks or asset monetization that mechanically compresses the spread, exit once the gap narrows. Every element — the NAV calculation, the gap, the catalyst mechanism — was derived from publicly available filings.
Elliott Management: Running the Same Campaign Twice
2020 campaign: Elliott, a $40 billion hedge fund run by activist investor Paul Singer, built a stake close to $3 billion in SoftBank by February 2020, led by Gordon Singer. Elliott’s public statement was precise: “Elliott’s substantial investment in SoftBank Group reflects its strong conviction that the market significantly undervalues SoftBank’s portfolio of assets.” Its demands: a $10–$20 billion buyback to “help close a yawning gap between the company’s market value and the value of stakes in companies in which it has invested,” plus governance improvements. It engaged privately, stating it was “working constructively on solutions to help SoftBank materially and sustainably reduce its discount to intrinsic value.”
SoftBank shares jumped as much as 8.2% on the day the Bloomberg report broke — alpha from the disclosure itself, before any capital was returned. Son responded within weeks: the ¥4.5 trillion monetization announcement sent the stock up close to 19% in a single session. The Bocconi Students Investment Club documented Elliott’s thesis: the company’s valuation was “circa $150bn short of its true valuation”. Elliott sold almost all its shares by August 2022, having reportedly “lost conviction in Masayoshi Son’s ability to lead a turnaround” — a clean entry-to-exit cycle across 2.5 years.
2024 campaign: Elliott rebuilt a $2 billion+ stake in June 2024 and pushed for a $15 billion buyback, with Reuters confirming Elliott had engaged SoftBank senior management for two to three months before the disclosure. The engagement was led by Nabeel Bhanji — the same partner who led the 2020 campaign. SoftBank shares jumped more than 5% on the disclosure, hitting ¥9,420 — the highest in three years. The logic was structurally identical: NAV gap, undervalued listed assets, pressure for capital return.
Tiger Global’s Earlier Read
Tiger Global’s Chase Coleman disclosed a $1 billion+ stake in July 2018, explicitly telling investors in a client letter the stock was trading at too steep a discount to NAV and failing to reflect Alibaba’s appreciation. SoftBank’s shares rose 5.5% on the day — the same announcement-day mechanism Elliott would use twice in the years following.
The key insight across all three of these positions: this is not a trade against SoftBank. It is a long trade on SoftBank, made possible by Son’s own repeated public acknowledgment that the stock was undervalued. The activists did not discover information Son was hiding. They acted on information Son was broadcasting.
Trade 2 — The Vision Fund LP Structure: Why the Coupon Forced Bad Bets
A Capital Structure That Made Overvaluation Inevitable
This is the least-discussed structural edge and the most mechanically precise. Vision Fund 1 closed with $98.6 billion in total committed capital: SoftBank contributed $28 billion, PIF (Saudi Arabia) $45 billion, Mubadala (Abu Dhabi) $15 billion, and other investors including Apple, Qualcomm, Foxconn, and Sharp contributed approximately $5–8 billion more — approximately $70 billion total from outside LPs.
The structural defect: approximately 40% of each outside LP’s commitment was structured as preferred equity carrying a 7% annual coupon on invested capital, regardless of fund performance or liquidity. The maximum annual coupon obligation when the fund was fully deployed was $2.8 billion per year. Over the fund’s lifetime, the Vision Fund needed to generate more than $11 billion in returns just to cover coupon payments before a single dollar of profit could flow to LP equity holders.
The Mechanical Consequence: Deploy Fast, IPO Fast, or Bleed Cash
Wharton asked the central question: could this coupon structure have caused SoftBank to deploy 80% of the fund’s capital in 2.5 years — twice as fast as planned? The 7gc.co analysis was direct: the LP structure “backfired and ultimately made the underlying portfolio riskier by incentivizing GPs to make quicker, riskier investment decisions,” and the Vision Fund had to invest an average of $55 million per day to meet its five-year deployment schedule.
Any fund that modeled this constraint could trace a direct causal chain. The coupon pressure explained: (a) why SoftBank offered inflated valuations — it had to deploy $55M/day to match schedule, making competitive discipline secondary to deal velocity; (b) why IPOs were mandatory rather than optional — they were the only mechanism generating real cash distributions; © why when IPOs failed or underperformed, SoftBank was compelled to sell its most liquid listed assets — Alibaba, T-Mobile, Uber — to plug the gap.
The American Prospect confirmed the logic: “given the fund’s massive debt obligations; its hefty, performance-irrelevant annual payouts to investors; and its need to yield billions in profits steadily, it’s no surprise that it placed huge pressure on these tech investments to bear fruit quickly.” In August 2019, when IPO distributions dried up, the Vision Fund borrowed up to $4 billion against its Uber and Guardant Health shares to return cash to investors — an arrangement the Wall Street Journal called “unusual.” That borrowing was a publicly observable, filing-documented signal that forced selling of listed assets was imminent.
Understanding the LP structure is not simply background — it is the causal root of Trade 3.
Trade 3 — The IPO Short: Reading the Valuation Gap Before the Market Did
Why Vision Fund Portfolio Companies Were Systematically Overpriced at IPO
The coupon-driven deployment pressure from Trade 2 created a predictable output: every late-stage pre-IPO funding round was written at an inflated valuation, both to win the deal under competitive pressure and to generate the paper mark-up that allowed the fund to show interim gains while real distributions were scarce. The 7gc.co analysis documented that WeWork’s “peak fair market value” in SoftBank’s own portfolio marks was $18.8 billion above SoftBank’s invested capital — unrealized gains that were never realized. When these companies hit public markets, investors without a SoftBank relationship repriced them on public GAAP metrics. The gap between private mark and public clearing price was the short.
Uber: SoftBank invested $7.65 billion in early 2018 — $6.6 billion buying secondary shares at $32.87 per share at a $48 billion valuation (down from a prior $70 billion private mark), and $1.05 billion in new shares at $48.77 per share. CNN confirmed SoftBank acquired most of its stake “at a $48 billion valuation — down from the $70 billion it had most recently been valued at on the private market” — a forced secondary that itself signaled the widening gap between VC marks and clearing prices.
In Q1 FY2020 (the quarter ending June 30, 2019 — Uber’s first full quarter as a listed company), SoftBank recorded Vision Fund unrealized losses of approximately $1.84 billion across Uber and other portfolio investments. By September 3, 2019, SoftBank was more than $600 million underwater on its Uber position based on total entry price versus market price alone. In Q2 FY2020 (July–September 2019), Uber’s shares fell 34%. The S-1 unit economics — negative margin on every ride, contested California AB5 reclassification risk, no moat — were public before the IPO. The short thesis required no private information, only a willingness to read the filing.
WeWork: SoftBank’s January 2019 funding round valued WeWork at $47 billion. The S-1 filed in August 2019 disclosed $900 million in net losses on $1.5 billion in revenue in H1 2019, $17.9 billion in long-term lease obligations, and a metric called “community-adjusted EBITDA” that removed the core rental cost entirely. Any short seller had six weeks of S-1 data before the IPO was pulled. The valuation collapsed 83% to the SoftBank rescue price of $7.8 billion, then further to $2.9 billion by March 2020 — a 94% destruction of peak private value in under 14 months. SoftBank’s cumulative losses in WeWork totaled $14.2 billion through September 2023 before WeWork filed for bankruptcy in November 2023.
Son’s own words confirmed the thesis on the May 2020 earnings call: “We made a failure on investing in WeWork and I’ve been admitting that several times. I was foolish. I made a wrong decision.” He also disclosed: “Out of 88 companies, 15 could go bankrupt. That’s my assumption at this moment.” That is a CEO publicly quantifying distress across a $100 billion portfolio, live, with no lag.
The Q3 FY2020 earnings call (February 2020) added further confirmation: WeWork and Uber failures had “caused concern amongst potential investors in Vision Fund 2” — a public signal that future IPO-driven distributions were collapsing, making Alibaba and T-Mobile stake sales the only remaining cash source. Any fund monitoring the coupon coverage ratio now had a CEO-sourced verification that the forced-selling clock was running.
Trade 4 — The Nasdaq Whale Gamma Loop: Profiting From SoftBank’s Own Flow
SoftBank Became the Market
In summer 2020, a distinct and unusual opportunity emerged: SoftBank’s internal trading unit became a large enough options buyer to mechanically lift the underlying equity prices of the stocks it was trading. The trade was not against SoftBank. It was alongside — or more precisely, downstream of — SoftBank’s dealer-hedging mechanics.
SoftBank’s SB Northstar unit — run by former Deutsche Bank trader Akshay Naheta under a three-member investment committee of Masayoshi Son, Naheta, and SoftBank vice-chairman Ron Fisher — spent approximately $4 billion in options premiums on call options tied to roughly $50 billion in notional exposure across Apple, Amazon, Tesla, Facebook, Alphabet, and Microsoft. Son acknowledged the activity on his Q1 FY2021 earnings call (August 2020): “we purchase these issues…in addition to that, in order to minimize the risk, we use derivative transactions as well.”
The Gamma Feedback Mechanism
The mechanical chain runs as follows. When a large buyer purchases call options at scale, dealers who sold the calls must delta-hedge by purchasing the underlying shares — the hedge proportional to each option’s delta. As spot prices rise, delta increases on out-of-the-money calls moving toward at-the-money, requiring dealers to buy more shares to rebalance. More buying lifts prices further, which again increases delta, which forces more buying. The Irish Times described this precisely as “a classic ‘tail wags the dog’ feedback loop.”
The signal was detectable from observable market data. Single-stock call volumes in large-cap tech on short-dated maturities were extraordinary — the Financial Times reported trading volumes in single stocks had surged beyond the average daily volumes of calls on broader stock market indices. One derivatives-focused hedge fund manager told the FT: “These are some of the biggest trades I’ve seen in 20 years of doing this. The flow is huge.” Rising spot prices alongside rising implied volatility — the inverse of the normal relationship — was a mechanical fingerprint of concentrated directional buying. Any fund long the same underlying names during this period extracted yield from SoftBank’s dealer-forced buying.
The Outcome
SB Northstar reported $3.7 billion in losses by November 2020. The strategy’s total loss reached $5.6 billion. Son personally lost $1.3 billion (¥150 billion), which he disclosed directly on a quarterly earnings call. SB Management’s US-listed equity portfolio collapsed from over $17 billion to just over $1 billion within a year. The unit was shut in April 2022. Naheta, who had also executed the Wirecard derivatives bet funded by Mubadala and individual SoftBank executives rather than SoftBank’s own balance sheet, departed the firm.
The trade logic for hedge funds positioned in these names was straightforward: SoftBank was creating a mechanical buyer in dealer desks across Wall Street. Any fund that identified that buyer from options market data could ride the flow rather than stand against it.
Trade 5 — The Alibaba Prepaid Forward Collar: The Dealer-Side Position Nobody Published
A Structure That Was Fully Disclosed and Widely Ignored
From 2016, SoftBank monetized its Alibaba stake not through open-market sales but through a series of variable prepaid forward contracts — fully disclosed in SoftBank’s own press releases and in SEC EDGAR filings, but rarely modeled by market participants at the portfolio level.
The mechanism: a SoftBank subsidiary pledged Alibaba shares to financial institution counterparties, received a cash prepayment of roughly 70–80% of market value at signing, and agreed to deliver a variable number of shares at a future settlement date. The 2016 transaction via West Raptor Holdings embedded collar derivatives — a cap and a floor on the exact number of shares to be delivered at settlement, tied to Alibaba’s final price. In June 2019, West Raptor Holdings delivered 73 million Alibaba ADSs to settle that 2016 contract, having received $5.4 billion at signing.
The April 2020 transaction — via SoftBank subsidiary Skybridge — involved 512.3 million Alibaba shares, settled in tranches between October 2021 and January 2024. The 2022 settlement batch was the largest single event: 242 million ADSs, cutting SoftBank’s Alibaba stake from 23.7% to 14.6% and realizing approximately $34 billion in proceeds.
The Critical Dealer Mechanics
SoftBank’s own August 2022 press release stated explicitly: “Alibaba shares subject to these prepaid forward contracts were hedged in the market at the time of the original monetization transactions by each financial institution counterparty.” The counterparty banks confirmed by contemporaneous reporting were Goldman Sachs, Mizuho, and UBS.
This sentence is the core of the trade logic. From the day each contract was signed — in some cases years before physical settlement — Goldman, Mizuho, and UBS were structurally short Alibaba in the open market as a delta-hedge. Their short position persisted until physical share delivery extinguished it. The settlement schedule was publicly disclosed in SoftBank’s filings, and the settlement dates were known in advance.
For funds reading those filings, the information set was complete: a known counterparty short position in Alibaba, a known settlement schedule, and a known structural overhang — with no private information required. An 86Research analyst confirmed the mechanics after the 2022 settlement: “The positions were already hedged when forward contracts were signed, so there is no more impact on public market” — which is precisely why the overhang was a factor during the contract period, not after.
The CEO Signal Layer: Masayoshi Son’s Earnings Calls as a Trading Calendar
Across all five trades, there is a consistent meta-source of edge that deserves standalone treatment: Masayoshi Son’s public earnings calls. Son is among the most candid CEOs of any large asset holder, and his quarterly presentations generated a stream of actionable signals that required no interpretation — only a willingness to model their cash-flow consequences.
May 2020 — direct portfolio stress admission: “Out of 88 companies, 15 could go bankrupt. That’s my assumption at this moment.” On the same call: “I was foolish. I made a wrong decision,” on WeWork — a CEO publicly quantifying distress across a $100 billion portfolio.
November 2021 — buyback at documented peak discount: Son announced a ¥1 trillion ($9 billion) buyback, simultaneously disclosing the NAV discount had reached 52%. He stated directly: “With a discount this wide, I thought, what would make shareholders happy? A buyback.” Reuters confirmed the stock jumped 10.5% on the following trading day. Any fund monitoring SoftBank’s quarterly LTV and NAV publications — both posted on the SoftBank IR site — could anticipate this announcement category before the press release.
Q2 FY2022 (November 2021) — pre-emptive China write-down signal: Son described the environment as “in the middle of a blizzard” as Chinese portfolio NAV declined — preceding significant further write-downs in subsequent quarters.
March 2020 — “defensive mode” as forced-selling pre-announcement: Son confirmed on the earnings call that “we need to be defensive and protect from any attack,” then announced the ¥4.5 trillion monetization. The stock rose 19% that day.
Beyond the calls: Fortune’s May 2024 reporting revealed SoftBank had assembled an internal equity capital markets team drawn from Goldman Sachs specifically to manage Vision Fund stake exits through block trades, timing them to minimize market disruption — with those block trades visible in EDGAR 13F filings before final settlement. Since end-2021, the Vision Fund’s US-listed portfolio shrank by approximately $29 billion through Coupang, DoorDash, and Grab stake sales — each block trade visible in regulatory filings before settlement.
The Unified Framework: Five Structural Edges, Five Different Mechanisms
The five trades documented here are not random alpha. They form a coherent system, each arising from a different layer of SoftBank’s architecture.
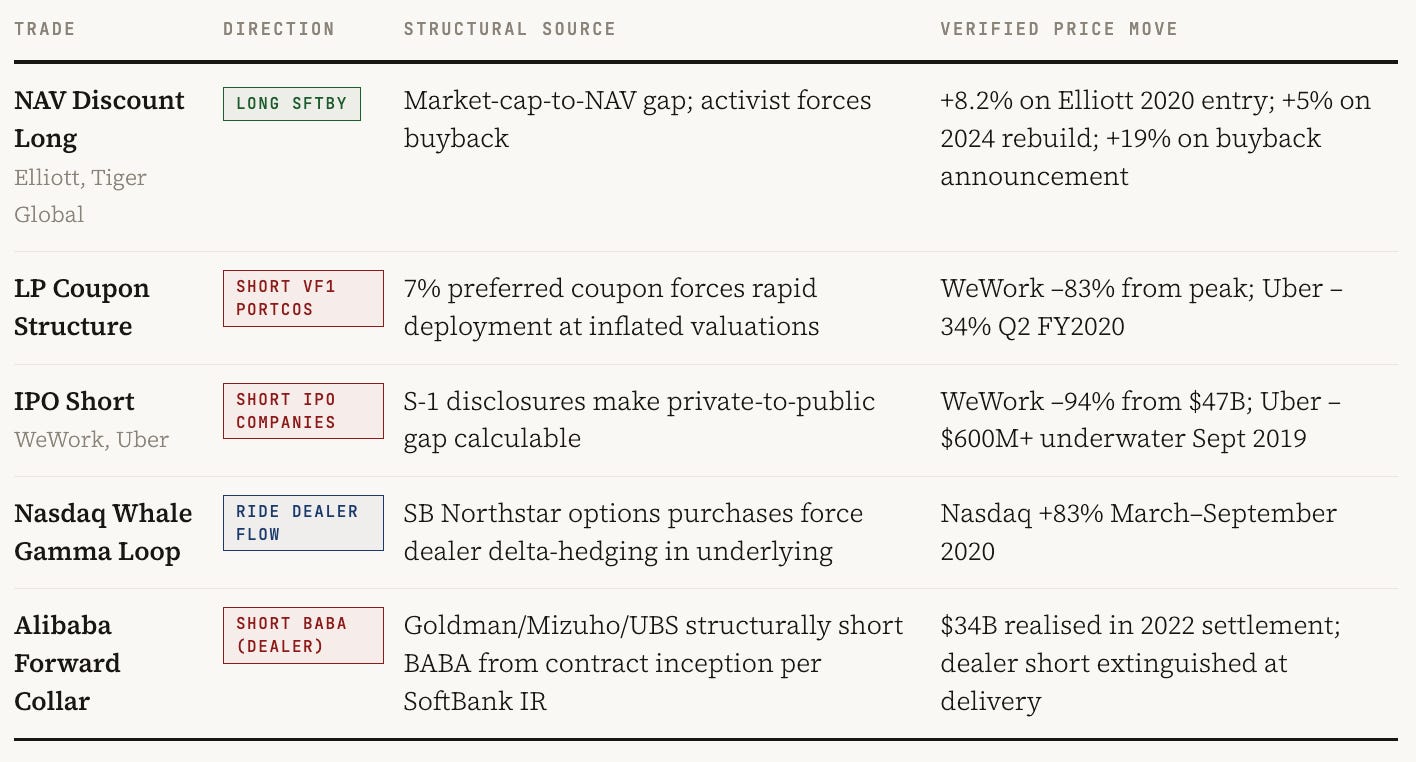
What links all five is a single underlying condition: SoftBank’s disclosures were exceptional in their completeness, and Son’s behavior was consistent in its predictability. The NAV gap was disclosed quarterly. The LP coupon terms were in fund documents. The IPO S-1s were public. The options flow was legible from market data. The forward contract settlement schedules were in press releases.
The alpha did not require privileged access. It required the discipline to read what Son had already published — and the rigor to model the mechanical consequences before the price moved.
📊 Want the Institutional-Grade Trade Note?
This article is the public version. The full trade note — published exclusively for paid subscribers on The Mathematical Trader Patreon — goes further:
Trade structure with explicit entry thesis, exit signal, and risk management parameters
Five falsifiable risks to the thesis, each written as a specific, testable claim
Catalyst calendar — five events to monitor with precise instructions on what each means for the position
10-row verification table mapping every number and quote to its named primary source
Format: institutional. Bottom line first. Written for portfolio managers and quant researchers.
If you are serious about hedge fund strategy at this depth, this is where the work lives.
→ Read the full trade note on Patreon
Join The Mathematical Trader Patreon
Follow along on: YouTube — @TheMathematicalTrader | LinkedIn — Navnoor Bawa
Primary sources: Bloomberg — Elliott $3B stake Feb 2020 | SoftBank IR — March 2020 asset-sale announcement | CNBC — 73% discount, $41B buyback | CNBC — Elliott Feb 2020 statement | Fortune — Elliott $10–20B buyback demand | CNBC — Elliott 2024 stake rebuild | Reuters — Elliott $15B buyback 2024 | Yahoo Finance — Elliott 2024 detail | Elliott Wikipedia | Governance Intelligence — Elliott private engagement | Bloomberg — Tiger Global $1B stake | Bocconi BSIC — Elliott Japan analysis | Wharton — Vision Fund LP structure | 7gc.co — Vision Fund deep dive | Axios — Vision Fund coupon | American Prospect — forced IPO pressure | Pitchbook — Vision Fund LP breakdown | Wikipedia — Vision Fund structure | eMorningCoffee — Uber entry price analysis | CNN — SoftBank Uber IPO | CNBC — $1.84B Q1 FY2020 loss, $600M underwater | CNN — Uber –34% Q2 FY2020 | CNBC — Son “foolish,” WeWork $2.9B | Seeking Alpha — Son Q4 FY2020 call | Business Insider India — Son quotes May 2020 | Yahoo Finance — WeWork $14.2B cumulative loss | Seeking Alpha — Q3 FY2020 earnings call | NZ Herald — SB Northstar losses and committee | Fortune — Nasdaq whale unmasked | Irish Times — gamma loop | CNBC — SoftBank options buying | Grokipedia — Naheta total losses | Yahoo Finance — Son personal loss | Nation and State — SB Northstar shutdown | InvestorsNewsBlog — Naheta Wirecard | SoftBank IR — August 2022 Alibaba settlement | SoftBank IR — 2016 collar, June 2019 settlement | SCMP — Alibaba final settlement | Asia Financial — $34B gain | Yahoo Finance — Goldman Sachs, Mizuho, UBS counterparties | US News — 86Research dealer mechanic confirmation | Time — $9B buyback, 52% discount | Reuters — 10.5% jump Nov 2021 buyback | Seeking Alpha — Son Q2 FY2022 “blizzard” | Seeking Alpha — Son Q1 FY2021 call | Fortune Asia — Goldman ECM team, block trades
Cover photograph: Wikiuser0805, CC BY 4.0, via Wikimedia Commons.