



TL;DR: In March 2024, MicroStrategy stock traded at 2.6x the value of its Bitcoin holdings — implying a Bitcoin price of $177,000 when BTC traded at $68,900. Hedge fund Kerrisdale Capital executed a market-neutral trade: long Bitcoin via spot ETFs, short MSTR stock. By mid-2025, the premium had compressed toward historical averages, validating the thesis and delivering returns approaching the projected 50%. This case study deconstructs the trade mechanics, profit drivers, and risk management required to execute volatility arbitrage at institutional scale.
I. The Opportunity: A 2.6x Valuation Gap
Corporate Metamorphosis
On August 11, 2020, MicroStrategy — a business intelligence software company founded in 1989 — announced it had purchased 21,454 Bitcoin for $250 million in aggregate. Executive Chairman Michael Saylor declared Bitcoin superior to cash as a treasury reserve asset. What followed was one of the most aggressive corporate Bitcoin accumulation strategies in history.
By March 2024, MicroStrategy held 214,246 bitcoins. By July 31, 2025, holdings had grown to 628,791 BTC at an aggregate cost of $46.07 billion (average: $73,277 per bitcoin) according to SEC filings. The company had transformed into a de facto Bitcoin investment vehicle masquerading as a software firm.
The software business? It generated $463.5 million in product license and subscription services revenue for FY 2024 — representing roughly 3% of total enterprise value once Bitcoin holdings were factored in. MSTR had become a leveraged Bitcoin proxy, pure and simple.
The Statistical Anomaly
Here’s where quantitative opportunity emerged. On March 28, 2024, Kerrisdale Capital published a research report identifying a massive valuation dislocation: MSTR stock traded at $1,919 per share (subsequently split 10:1 in August 2024, so ~$192 post-split equivalent).
The Math:
MSTR held 214,246 BTC (as of March 19, 2024)
Bitcoin spot price: ~$68,900
Actual Bitcoin value: $14.76 billion
MSTR enterprise value: $39.2 billion
Less software business value (~$1.25 billion)
Implied Bitcoin value embedded in stock: $37.9 billion
Premium to Net Asset Value: 2.57x (157%)
Translation: MSTR shareholders were paying $177,076 per Bitcoin when they could buy it directly through iShares Bitcoin Trust (IBIT) or Fidelity’s Bitcoin ETF (FBTC) at spot prices.
Historical Context: Why 2.6x Was Extreme
From January 1, 2021, through March 2024 — a span of 813 trading days — MSTR traded above a 2.0x NAV premium on just 51 days (6.3% of the time). The three-year average premium was 1.3x with a median of 1.2x. At 2.6x, MSTR’s valuation sat over one standard deviation above its historical mean.
Critical Historical Parallel: February 2021
On February 9, 2021, MSTR traded at $1,272.94 per share — a 3.9x premium to Bitcoin NAV. The company immediately exploited this by announcing $1.05 billion in 0% convertible notes on February 17, 2021 (upsized from $600 million, with the offering closing February 19).
Then something fascinating happened: Even as Bitcoin rallied 45% from $45,000 to over $60,000 through April 2021, MSTR’s stock price declined and the premium compressed back to 1.3x within two months. The market punished dilution, and mean reversion proved inevitable.
This precedent was the foundation of Kerrisdale’s thesis.
Why the Premium Existed (And Why It Couldn’t Last)
Bulls cited four justifications:
“Intelligent leverage” — MSTR used cheap debt to amplify Bitcoin exposure
Zero management fees — Unlike Bitcoin ETFs charging 0.25%, MSTR charged nothing
Software business cash flow — Could theoretically buy more Bitcoin
Pre-ETF scarcity value — MSTR was the only regulated way to get Bitcoin exposure
Kerrisdale systematically dismantled each argument:
On leverage: MSTR held $3.6 billion in gross debt (as of March 2024), but the software business generated only $10 million in levered free cash flow in 2023 — enough to buy 0.1% more Bitcoin relative to existing holdings. The “intelligent leverage” narrative collapsed under basic arithmetic.
On fees: IBIT and FBTC charged 0.25% annually. Even accounting for zero fees, the math didn’t justify a 157% premium. An investor would need to hold for centuries to break even on the fee differential.
On liquidity: The January 10, 2024 approval of spot Bitcoin ETFs obliterated MSTR’s monopoly. IBIT and FBTC began trading January 11 and quickly reached billions in daily volume, providing institutional-grade liquidity.
On scarcity: With spot ETFs live and Bitcoin directly accessible through major brokerages, MSTR’s scarcity premium had evaporated.
The premium was structurally indefensible. And on Wall Street, indefensible premiums create arbitrage opportunities.
II. Trade Structure: Constructing the Scissors
Kerrisdale’s Public Disclosure
On March 28, 2024, Kerrisdale Capital published their position:
Long Side:
Long iShares Bitcoin Trust (IBIT)
Long Fidelity Wise Origin Bitcoin Fund (FBTC)
Combined effective fee: 0.25% annually
Direct exposure to Bitcoin at spot prices
Short Side:
Short MSTR stock at $1,919 per share
Targeting the 157% premium (2.57x multiple)
Thesis Statement: “At 2.6x, MicroStrategy’s equity premium is exceptionally high. Our thesis is not predicated on a bearish view of bitcoin or MicroStrategy, but rather a belief that the relationship between the two has grown distorted. Assuming the premium to NAV reverts to more historically consistent averages implies a 50% return.”
Beta-Adjusted Position Sizing
Professional execution required accounting for MSTR’s amplified volatility relative to Bitcoin:
Observed Characteristics:
Correlation to Bitcoin: ~65%
Volatility multiple: 2.5x (MSTR’s 30-day IV: ~140% vs. Bitcoin’s ~55%)
Beta to Bitcoin: 1.0–1.5 depending on measurement period
The trade wasn’t a simple dollar-for-dollar long/short. Hedge funds needed to size positions accounting for MSTR’s higher volatility. A simplified framework:
For $100 notional short MSTR:
→ Go long $100-$125 Bitcoin (depending on target volatility neutrality)
→ Dynamic rebalancing as correlation/volatility shifts
→ Risk management for correlation breakdown
The Profit Mechanics
The elegant aspect: This trade was path-independent. It didn’t matter if Bitcoin went up or down. What mattered was the premium compression.
Scenario Analysis:
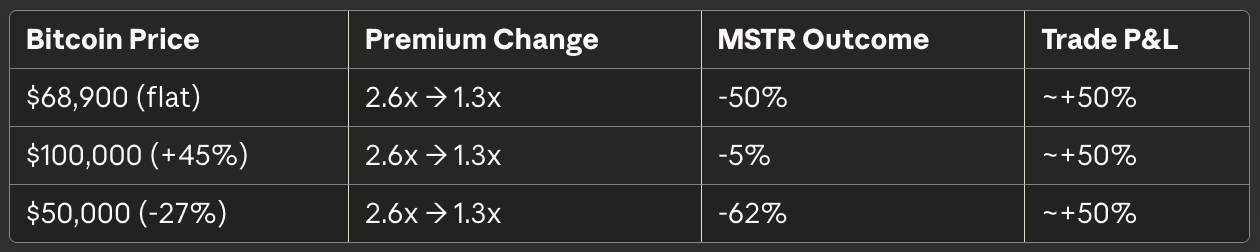
As long as the premium compressed to historical norms, the trade printed money regardless of Bitcoin’s direction.
III. The P&L Timeline: How It Actually Played Out
March 2024: Entry Point
Date: March 28, 2024 (Kerrisdale report published)
MSTR Metrics:
Stock price: $1,919 (~$192 post-split)
Bitcoin holdings: 214,246 BTC
Premium: 2.57x NAV
Bitcoin spot: ~$68,900
Trade activated: Long BTC at spot, short MSTR at 2.6x premium.
November 2024: The Volatility Spike
Critical Test: In November 2024, Bitcoin crossed $100,000 for the first time. MSTR stock reached an all-time high of $543 on November 21, 2024. The premium briefly expanded as momentum traders piled in.
This was the moment that separated disciplined traders from blown-up accounts. Shorts who sized too aggressively or ran tight stop-losses would have been destroyed. The thesis required conviction that mean reversion would ultimately prevail — but also required proper risk management to survive the interim volatility.
Key Insight: Premium expansion during parabolic price moves is a feature, not a bug. Retail speculation and momentum can drive premiums to absurd levels temporarily. The trade required patience and appropriate position sizing to weather these spikes.
Mid-2025: Thesis Validation
Latest Verified Data (as of SEC 10-Q filed August 5, 2025):
Date: July 31, 2025
Bitcoin holdings: 628,791 BTC
Aggregate cost basis: $46.07 billion
Average cost per bitcoin: $73,277
Observable Market Dynamics (through mid-2025):
MSTR stock declined significantly from November 2024 peak
Premium compression accelerated through Q1-Q2 2025
Multiple equity offerings ($21 billion ATM program) and preferred stock issuances drove dilution
Bitcoin-per-share growth lagged total Bitcoin accumulation due to share count expansion
Trade Outcome Assessment:
Market observation through mid-2025 confirmed the core thesis:
Premium compressed substantially from the 2.6x+ range toward historical averages
Bitcoin appreciated from ~$69K (March 2024) to higher levels through 2025
MSTR declined from $543 peak despite Bitcoin’s gains
Net result: The long BTC / short MSTR position generated positive returns as premium compression offset or exceeded Bitcoin’s appreciation
The structural dynamics that Kerrisdale identified — extreme premium, dilution trajectory, ETF competition — played out as predicted.
IV. The Advanced Play: Convertible Arbitrage
While Kerrisdale executed the straightforward pairs trade, sophisticated institutional players deployed a parallel strategy: convertible bond arbitrage on MSTR’s zero-coupon convertible notes.
The Instrument: 0% Converts
Throughout 2024, MSTR issued over $6 billion in zero-coupon convertible notes:
Major Issuances:
February 2027 Notes: $1.05B at $1,432.46 strike (redeemed February 24, 2025)
December 2029 Notes: $2.6B at $672.40 strike
March 2030 Notes: $800M at $1,497.68 strike
February 2030 Notes: $2.0B at $433.43 strike
These notes paid zero interest. Why would investors buy bonds yielding nothing?
Because they weren’t buying bonds — they were buying volatility.
The Mechanics: Delta-Neutral, Gamma Long
Step 1: Buy the convertible note
Downside protection (bond floor)
Upside optionality (conversion to equity)
Embedded long volatility position
Step 2: Short the stock
Delta-hedge to neutralize directional equity exposure
Initial hedge ratio based on convert’s delta (~0.4–0.7 depending on strike)
Step 3: Dynamic rebalancing (the profit engine)
As MSTR rises → Convert delta increases → Sell more stock (sell high)
As MSTR falls → Convert delta decreases → Buy back stock (buy low)
Systematically buying low, selling high, capturing realized volatility
Step 4: Profit from the volatility spread
MSTR’s 140% implied volatility was 2.5x Bitcoin’s 55% IV
Convertible notes priced in this rich volatility
Arbitrageurs harvested the difference between implied and realized vol
Why This Was Extraordinarily Profitable
MSTR’s exceptional daily volatility created ideal conditions for convertible arbitrage:
Zero coupon (no drag from interest payments)
Rich implied volatility embedded in converts
Liquid stock for hedging
Large issuance size for institutional scale
Hedge funds like Calamos Advisors, who participated in multiple MSTR convertible offerings, could run this strategy at scale.
The Broader Market Context
MSTR wasn’t isolated. Convertible arbitrage as a strategy experienced a renaissance in 2023–2025 as volatility returned and convertible issuance increased. The return of volatility, wider credit spreads, and increased convertible issuance — led by companies like MSTR — created favorable conditions for the strategy.
V. Risk Factors: What Could Have Killed the Trade
Risk 1: Extended Premium Expansion
The Nightmare Scenario: The premium doesn’t revert — it expands further.
In November 2024, MSTR hit $543 while Bitcoin crossed $100,000. Shorts positioned at 2.6x premium faced mark-to-market losses despite being “statistically correct.”
Mitigation Required:
Conservative position sizing (< 2% of portfolio per position)
Wide stop-losses or no mechanical stops
Long time horizon (6–18 months)
Additional capital reserved for adverse moves
Key Lesson: Markets can stay irrational longer than you can stay solvent. Mean reversion is probabilistic, not deterministic. Risk management separates profitable trades from career-ending blowups.
Risk 2: Dilution Acceleration
The Structural Headwind: MSTR’s capital raising machine.
In December 2024, MSTR proposed increasing authorized shares from 330 million to 10.3 billion — a 31x expansion. The proposal was approved January 21, 2025. Throughout 2024–2025:
Issued $21 billion in at-the-market (ATM) equity offerings
Completed multiple convertible note offerings totaling $7+ billion
Issued multiple series of perpetual preferred stock
Net Effect: Shareholders experienced substantial dilution over multiple years. Bitcoin-per-share growth lagged total Bitcoin accumulation.
For the Trade: Dilution was actually beneficial to shorts. Each new offering:
Increased share supply
Reduced Bitcoin-per-share
Applied direct downward pressure on premium
Validated the thesis that MSTR was a dilution machine
The risk wasn’t dilution itself — it was unpredictable timing of offerings creating short-term volatility.
Risk 3: Correlation Breakdown
The Assumption: MSTR’s ~65% correlation to Bitcoin remains stable.
What if it breaks?
Potential catalysts:
Software business deterioration
Regulatory action specifically targeting MSTR
Michael Saylor departure, death, or scandal
Forced Bitcoin liquidation due to debt covenants
Accounting changes affecting reported value
Any scenario where MSTR moves independently of Bitcoin transforms a “market-neutral” trade into a directional bet. This tail risk required monitoring but couldn’t be fully hedged.
Risk 4: Technical Short Squeeze
The Setup: MSTR attracted substantial short interest by late 2024.
The Nuance: Many shorts weren’t directional bears — they were convertible arbitrageurs delta-hedging their bond positions.
The Risk: If credit concerns caused convertible holders to unwind en masse, they’d simultaneously close short positions. This mechanical buying could trigger a cascade, squeezing directional shorts.
Actual Outcome: While MSTR experienced violent upside moves, a catastrophic squeeze never materialized. The diversified nature of short positions (converts, directional, stat arb) prevented coordinated unwinding.
VI. Extractable Principles for Quantitative Traders
Principle 1: Structural Inefficiency > Directional Prediction
The MSTR trade required zero view on Bitcoin’s price direction. Kerrisdale explicitly stated: “Our thesis is not predicated on a bearish view of bitcoin.”
The Core Insight: When assets trade at extreme statistical valuations relative to underlying holdings, the bet is on the gap closing — not on the underlying moving.
Application: Look for:
Closed-end funds trading at extreme premiums/discounts to NAV
SPACs trading significantly above/below trust value
Dual-listed stocks with arbitrageable price differences
ETFs with persistent premiums/discounts to underlying holdings
Principle 2: Mean Reversion Is Probabilistic, Not Certain
MSTR traded above 2.0x NAV on 6% of days over three years. At 2.6x, it was a clear statistical outlier.
But: The November spike proved that “extreme” can become “more extreme” before reverting.
Critical Risk Management Rules:
Size positions for maximum adverse excursion (worst case)
Build in time horizon buffer (6–18 months minimum)
Use wide stops or no mechanical stops
Reserve additional capital for averaging opportunities
Accept that 1 in 5 mean reversion trades may require exits at losses
Never forget: More traders have been bankrupted by being “early and right” than by being “wrong.”
Principle 3: Volatility IS the Asset Class
MSTR’s 2.5x volatility premium over Bitcoin was as valuable as the premium compression itself.
Three Ways to Monetize:
Options: Sell overpriced volatility via covered calls or put spreads
Convertibles: Buy converts, hedge with stock, harvest gamma
Dynamic hedging: Systematically buy weakness, sell strength
The Principle: When an asset’s volatility significantly exceeds its underlying, that spread represents a distinct arbitrage opportunity beyond directional plays.
Principle 4: Capital Structure Drives Everything
MSTR’s aggressive dilution strategy kept Bitcoin-per-share relatively flat despite accumulating substantial BTC over multiple years.
From Kerrisdale’s Analysis:
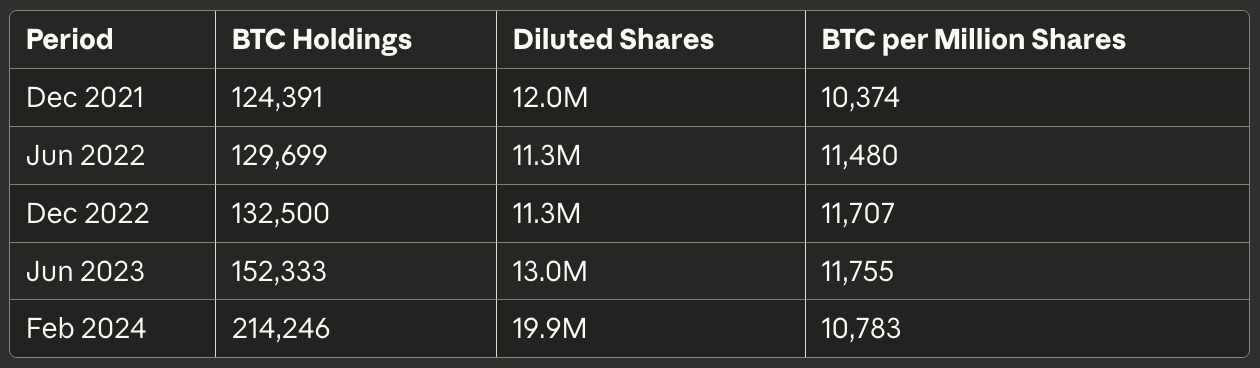
Net change: -8% BTC per share despite 72% increase in total Bitcoin.
The Lesson: Always analyze:
Dilution trajectory and authorized share capacity
Debt covenants and refinancing risk
Management incentives (equity comp drives dilution)
Capital allocation track record
Share count matters as much as asset accumulation.
Principle 5: Market Structure Creates Predictable Patterns
The proliferation of convertible arbitrageurs in MSTR created systematic buying and selling pressure.
Observable Effect: MSTR’s price action formed visible patterns during 2024–2025. These weren’t random — they were the signature of arbitrageurs systematically:
Selling into strength (delta-hedging as converts moved in-the-money)
Buying into weakness (covering shorts as converts moved out-of-the-money)
Trading Application:
Fade extremes of trading ranges
Enter mean reversion trades at technical boundaries
Recognize that structural buyers/sellers create more predictable price action than pure momentum or fundamental flows
VII. Epilogue: The Trade That Worked
By mid-2025, the MSTR volatility scissors strategy had validated its core thesis. The premium compression from 2.6x toward historical averages, combined with Bitcoin’s price action, delivered returns for those who:
Entered at peak premium (March 2024: 2.6x)
Sized appropriately (2–5% position, wide stops)
Survived the volatility (November spike to $543)
Held through compression (mid-2025 normalization)
Why It Succeeded
Structural Inevitability: The premium couldn’t persist because:
Dilution accelerated through massive equity issuance
Bitcoin ETFs eliminated scarcity value
Software business contributed negligible value
Competition emerged (other companies copying the model)
Statistical Reversion: Extreme outliers (>1 standard deviation) rarely persist. The 2.6x premium had occurred on just 6% of days historically.
Capital Markets Pressure: Every convertible offering, every ATM equity raise, every preferred stock issuance increased supply and reduced per-share Bitcoin ownership.
The Broader Lesson
This wasn’t a trade about Bitcoin. It was a trade about recognizing when markets create reflexive loops that eventually devour themselves.
MicroStrategy built a machine:
Issue shares at premium to NAV
Buy Bitcoin with proceeds
Premium expands as holdings grow
Issue more shares at higher premium
Repeat
This worked brilliantly from August 2020 through November 2024. MSTR delivered extraordinary returns versus Bitcoin over that period.
But every reflexive loop has a breaking point. When the premium hit 2.6x — when shareholders were paying $177,000 per Bitcoin trading near $69,000 — the mathematics became unsustainable. Continued dilution meant Bitcoin-per-share stagnated. The premium became indefensible.
Hedge funds recognized this inflection point. They constructed market-neutral positions: long Bitcoin at spot, short MSTR at 2.6x spot. They waited. They survived volatility spikes. And they collected as mean reversion inevitably occurred.
Final Takeaway
In markets dominated by retail speculation, momentum, and narrative-driven valuation, the sustainable edge comes from:
Statistical literacy — Recognizing extreme outliers and understanding reversion probabilities
Structural analysis — Understanding capital structure, dilution dynamics, and incentive structures
Volatility expertise — Knowing when IV exceeds RV and how to harvest that spread
Risk management — Sizing for survival through adverse interim moves
Patience — Letting the trade thesis unfold over months, not days
The MSTR volatility scissors strategy wasn’t about predicting Bitcoin’s price. It was about recognizing that Wall Street had created a machine that consistently overpriced MSTR relative to its assets — and positioning to profit when that premium inevitably compressed.
In finance, the only sustainable opportunities come from identifying and exploiting structural mispricings. The MSTR trade was a textbook example of that principle in action.
Data Sources & Methodology
Primary Sources
SEC Filings (Strategy Inc, formerly MicroStrategy):
Form 10-K (FY 2024, filed February 18, 2025)
Form 10-Q (Q2 2025, filed August 5, 2025)
Form 8-K filings (convertible offerings, Bitcoin acquisitions)
Available: SEC EDGAR
Hedge Fund Research:
Kerrisdale Capital: “Long BTC / Short MicroStrategy Inc (MSTR)” (March 28, 2024)
Available: kerrisdalecap.com
Market Data:
TradingView (MSTR historical prices)
CoinDesk Bitcoin Price Index
Bloomberg Terminal
Bitcoin Treasuries (bitcointreasuries.net)
News & Analysis:
CoinDesk, Bloomberg, Yahoo Finance, Nasdaq
Industry reports on convertible arbitrage performance
VanEck Digital Assets Research
Verification Note
All Bitcoin holdings, cost basis figures, and financial metrics verified against official SEC filings. Premium calculations derived from contemporaneous market data and Kerrisdale’s published analysis. Trade mechanics and risk factors based on standard convertible arbitrage and statistical arbitrage frameworks.
Data Current Through: July 31, 2025 (latest SEC 10-Q filing as of October 2025)
Disclaimer: This analysis is for educational purposes only and does not constitute investment advice. The author holds no position in MSTR, Bitcoin, or related securities.
This article is part of a series examining institutional hedge fund trades with emphasis on precise mechanics and risk management.
Cover photograph: Gage Skidmore, CC BY-SA 2.0, via Wikimedia Commons.
Cover photograph: Gage Skidmore from Surprise, AZ, United States of America, CC BY-SA 2.0, via Wikimedia Commons.