


The Trade That Moved Markets
October 30, 2025: Bloomberg reported that LMR Partners’ convertible arbitrage team achieved a net ~30% return through mid-October, marking one of the strongest performances in the strategy’s modern history.[¹] This wasn’t momentum chasing or beta capture. It was systematic exploitation of market structure during convergent conditions.
For quant researchers and hedge fund analysts, the relevant question isn’t whether 30% is impressive — it’s how exactly was this P&L generated?
This analysis deconstructs the mechanics. We examine four distinct profit engines, dissect the market setup, and extract principles applicable to quantitative strategy development.
Executive summary: LMR Partners exploited underpriced volatility through delta-hedged positions during factor convergence: record convertible issuance (~$50.7B in Q2 2025), tariff-induced volatility (VIX spiking into the 50s with intraday moves toward 60 in April), and normalized financing economics. The strategy combined gamma trading, credit carry, volatility repricing, and corporate action alpha — maintaining near-zero market beta throughout.
Part I: Market Structure Analysis
The Issuance Wave
Global convertible bond issuance in Q2 2025 reached approximately $50.7 billion across 69 deals — a 26% year-over-year increase.[²] June 2025 alone recorded around $30.1 billion across 71 deals, the highest monthly total since March 2021.[²]
Primary drivers:
Refinancing pressure: Industry estimates place $65–71 billion (estimate range) of pandemic-era convertibles maturing by end-2026, with Morgan Stanley/Reuters citing the higher end.[³][⁴] Companies faced expensive refinancing: high-yield debt at 7–9% versus convertibles at 3–4% effective rates.[⁵]
Buyback arbitrage: A structural innovation emerged in 2024 — companies issuing convertibles specifically to fund share repurchases.[⁶] Alibaba’s May 2024 $5 billion convertible (the largest standalone U.S. deal ever) exemplified this trend.[⁶][⁷] The mechanics created unique entry points: hedge funds could establish short positions during concurrent buyback support, reducing short-squeeze risk while positioning for volatility capture.
Cross-border flow: Issuance diversified geographically. North America led with approximately $37.9 billion in Q2, but European volumes surged 231% year-over-year.[²] This geographic dispersion provided arbitrageurs with deeper opportunity sets across volatility regimes.
The Volatility Event
April 2, 2025: President Trump announced comprehensive tariff measures. Markets fractured.
Quantitative impact:
Early April 2025: VIX spiked into the 50s, with intraday moves toward 60 and daily closes above 52 on key dates[⁸][⁹]
Index drawdown: Major U.S. equity indices declined approximately 18–19% from peak to trough[¹⁰]
Convertible resilience: ICE BofA U.S. Convertible Index fell 7.61% — demonstrating 41% downside capture[¹¹]
This 2.4:1 downside protection ratio wasn’t passive. It represented bond floor cushion working as theory predicts. For delta-hedged arbitrageurs, this created optimal conditions: equity shorts captured the full decline while convertible longs benefited from embedded optionality repricing upward as implied volatility exploded.
Financing Economics Transformation
The underappreciated catalyst: interest rate normalization fundamentally altered trade economics.
Historical context: During 2020–2021’s zero-rate environment, shorting stock yielded no benefit — cash collateral earned nothing. Credit spreads compressed to historic tights, leaving convertibles expensive relative to theoretical value.[⁵]
2024–2025 reset: After the 2022 repricing, convertibles traded at wider credit spreads with lower bond floors, providing carry cushion.[⁵] More critically, normalized rates meant short-sale proceeds could be reinvested — in some cases exceeding 5% on available borrows.[⁵][¹²]
This seemingly technical detail transformed break-even trades into profitable ones across hundreds of positions. Positive carry became additive to volatility capture rather than a drag to overcome.
Part II: The Profit Mechanics
Core Structure
Convertible arbitrage exploits mispricing between a hybrid security (corporate debt + embedded equity call option) and its underlying stock.
Standard position:
Long convertible bond at market price
Short underlying stock proportional to delta (typically 40–70% of conversion ratio at issuance)
Dynamic rebalancing as delta evolves with price and volatility
The strategy profits from volatility mispricing, not directional bets. If implied volatility embedded in the convertible trades below expected realized volatility, convergence generates P&L.
Profit Engine #1: Volatility Capture
Mechanism: When convertible pricing implies 30% volatility but arbitrageurs forecast 45% realized, a structural mispricing exists.
Trade construction:
Bond trading at $470M (implies 30% vol)
Theoretical value at 45% vol: $520M
Entry: Long $470M bond, short 53% delta
Convergence: As realized vol materializes, $50M mispricing closes
Recent research confirms that convertible bonds generate positive gamma, making delta-neutral portfolios profitable during volatile periods.[¹³] This gamma — the rate of change in delta — becomes the arbitrageur’s primary asset.
Profit Engine #2: Gamma Trading
Gamma trading transforms theoretical edge into realized P&L through mechanical rebalancing.
April 2025 volatility capture example:
Initial position:
Long convertible
Short 53% of conversion shares at $100
Stock drops 15% to $85:
Delta declines to 35%
Action: Cover 18% of short (buy at $85)
Stock rebounds 10% to $93.50:
Delta rises to 48%
Action: Re-short 13% (sell at $93.50)
Result: Net purchase at $85, sale at $93.50 — capturing $8.50 spread on rebalanced shares while maintaining approximate delta neutrality.[¹⁴]
Industry practitioners describe this explicitly: “Market volatility provides opportunities to profit through gamma trading. As stock price changes, the manager adjusts their hedge, mechanically buying as prices fall and selling as prices rise. The more volatile the stock, the more opportunities there are to buy low and sell high.”[¹⁵]
Profit Engine #3: Credit Carry & Financing
Returns derive partially from income: convertible coupon plus interest on short-sale proceeds.[¹⁶]
2024–2025 carry equation:
Inflows:
Convertible coupon: 1–4% annually
Short rebate: materially improved post-2022 (in some cases exceeding 5% on available borrows)[⁵][¹²]
Outflows:
Repo financing cost
Stock borrow fees
Margin haircuts
The normalization of rates after years of zero-percent policy meant this equation finally worked favorably. Industry commentary notes: “In a 0% interest world, shorting stocks yielded no benefit — cash collateral earned nothing — but today short-sale proceeds can be invested at risk-free rates, earning positive short rebates that add carry to convert-arb trades.”[⁵]
Profit Engine #4: Corporate Actions & Credit
Credit spread compression provides additional returns when issuer quality improves independent of equity movements.[¹⁷] During 2024–2025, many technology issuers saw spreads tighten as post-pandemic balance sheets strengthened.
Corporate actions created discrete opportunities:
Concurrent buyback programs (Alibaba-style structures)
M&A activity affecting conversion ratios
Forced conversions at call provisions
Special dividend declarations
Bloomberg’s reporting emphasized that LMR’s success derived not solely from issuance volume but from “a pickup in corporate actions creating a fertile hunting ground for arbitrageurs.”[¹] These event-driven opportunities don’t appear in volatility models but materially impact position P&L.
Part III: LMR Partners’ Execution Advantage
Institutional Infrastructure
LMR has operated convertible and capital structure arbitrage since 2018 within their multi-strategy platform, building institutional knowledge through multiple market cycles.[¹⁸] The team manages $1.8 billion including flagship fund allocations, providing critical scale advantages:[¹]
Primary market access: Size matters in new issuance. Large institutional allocators receive prioritized access to new deals, which often come to market at modest discounts. Funds with underwriter relationships can establish positions at more attractive entry points than secondary-market participants.
Liquidity resilience: Managing over $1 billion in the dedicated fund enabled position maintenance through April’s volatility spike without forced liquidations. This contrasts sharply with 2008, when undercapitalized funds faced margin calls forcing fire sales.
Global coverage: Portfolio managers based in Dubai (Seb Gorga) and Zurich (Vincent Olekhnovitch) enabled continuous monitoring across time zones.[¹][¹⁹] During April-June volatility when overnight gaps were frequent, this geographic distribution provided operational advantage.
Platform Integration
LMR operates 55 strategies across asset classes within a multi-strategy framework.[¹⁸] This diversification served dual purposes:
Risk management: Convertible positions represented meaningful but not dominant capital allocation, preventing concentration risk that destroyed standalone funds in 2008.
Information flow: Integration with event-driven, credit, and equity long/short teams likely provided early signals on issuer credit quality and corporate action timing — proprietary information edges that pure convertible specialists lack.
The firm’s stated approach emphasizes “identifying catalyst-driven dislocations that hold potential for outsized beta and carry-agnostic returns.”[²⁰] This framework naturally aligned with the corporate action opportunities that proliferated in 2024–2025.
Part IV: Performance Attribution Analysis
P&L Decomposition
Important note: LMR Partners has not publicly disclosed internal P&L attribution. The following represents the author’s estimates based on typical convertible arbitrage performance mechanics and 2024–2025 market conditions.
Estimated contribution to 30% net return (after fees):
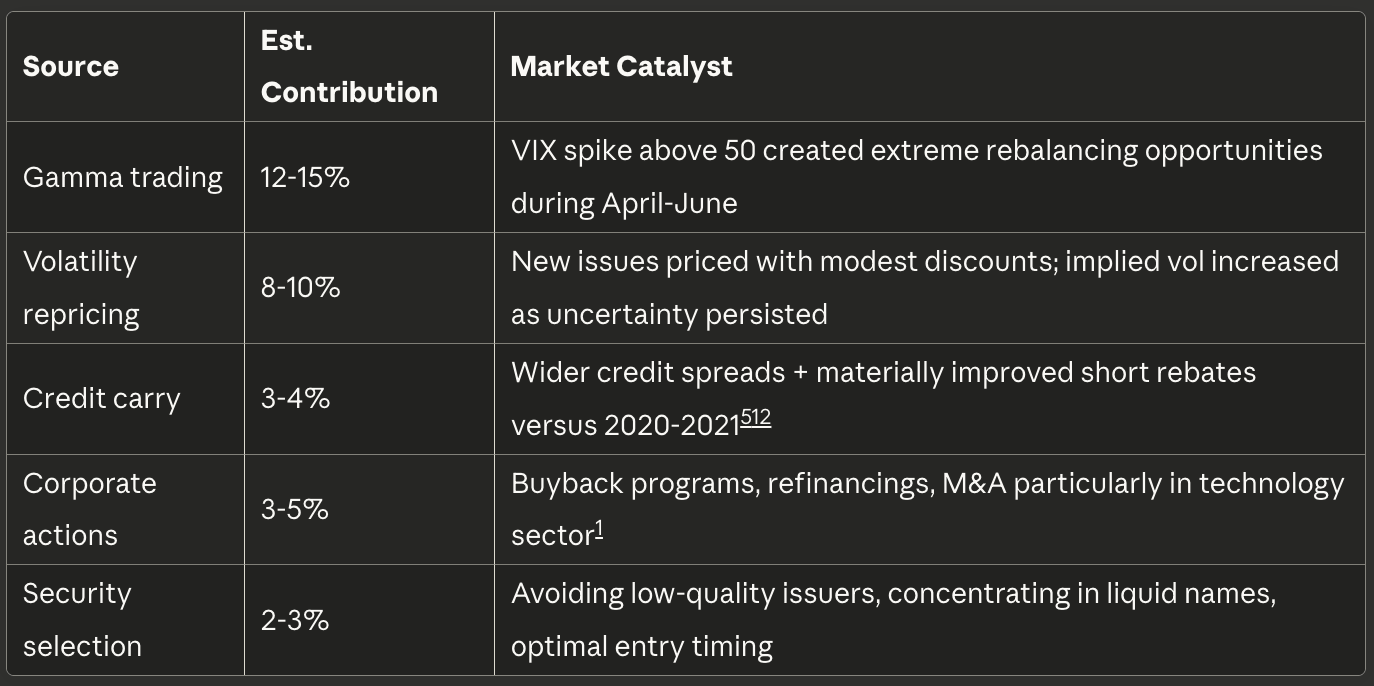
Gross estimated range: 28–37%
Net after fees: ~30%
Benchmark Context
HFR Convertible Arbitrage Index performance:[⁵]
2023: +10.1% (strongest year since pre-GFC era)
2024: Double-digit returns, “one of its best annual returns in recent memory”
2025 (through July): Approximately +6%, among top-performing hedge fund strategies[²¹]
LMR’s 30% through October significantly exceeded these benchmarks, indicating superior execution beyond market beta.
Other notable performers:
Linden Advisors: +5.8% through April 2024 (following +12% in 2023)[²²]
Context Partners: +6% through May 2024[²²]
Tidan Fund: +10.6% in September 2025 (single month record), +6.8% YTD through September[²³]
Performance dispersion across managers confirms that while the environment was favorable, execution quality, security selection, and risk management differentiated top-quartile from median performers.
Part V: Risk Analysis — 2008’s Shadow
The Crisis Mechanism
Understanding convertible arbitrage requires confronting 2008. HFR’s Convertible Arbitrage Index lost 34%, with losses concentrated in September-November.[²⁴]
Three cascading failures:
Excessive leverage: Long-side leverage approached 8x underlying capital in 2008. With delta-neutral implementation, short positions were proportionally inflated. When prime brokers terminated credit facilities, forced liquidations followed. Bonds traded below conversion value while margin calls accelerated.[²⁵]
Structural overcrowding: By 2004–2005, hedge funds owned 80–85% of new convertibles.[⁵] This concentration meant one fund’s forced selling impacted all positions simultaneously. Market-neutral portfolios suffered as correlations went to one.
Liquidity evaporation: The crisis revealed that seemingly independent risks — credit spreads, equity prices, funding availability — moved in lock-step. Bonds fell more than stocks in some cases due to liquidity constraints, violating theoretical models.[¹³]
Post-Crisis Evolution
Leverage reduction: By 2019, long-side leverage declined to 2–3x underlying capital, with proportionally reduced shorts.[²⁵] This created survival capacity during drawdowns.
Ownership diversification: Current ownership: hedge funds ~45%, long-only/indexed funds ~55% (versus 75% hedge fund ownership pre-crisis).[²⁵] More stable capital means less forced selling during stress.
Risk infrastructure: Modern teams stress-test multiple scenarios:
Credit shocks (sudden spread widening)
Equity gaps (overnight jumps)
Funding freezes (repo market stress)
Borrow recalls (short coverage impossible)[¹⁷]
Multi-strategy platform benefits: Integration within large multi-strats provides funding diversification unavailable to standalone 2008-era funds.
Current Vulnerabilities
Credit quality: Recent issuance includes speculative-grade names — small-cap tech, emerging markets, crypto-related entities. Economic cycle turns or sector-specific bubbles (AI froth) could trigger defaults.[⁵]
Liquidity risk: Many convertible issues remain thinly traded. During stress, bid-ask spreads widen dramatically, making rebalancing expensive or impossible.
Model risk: Valuation depends on volatility surface assumptions, credit spread projections, and issuer behavior modeling. Systematic model errors create portfolio-wide mispricing.
Tail events: April 2025’s VIX spike above 50 was manageable because it developed over several days. A true flash crash with overnight gaps could lock positions without rebalancing opportunity.
Part VI: Principles for Quant Researchers
Principle #1: Volatility as the Primary Asset Class
Traditional equity strategies generate returns from directional price moves. Convertible arbitrage generates returns from volatility itself. If stock price moves 10% but implied/realized volatility spread remains unchanged, a properly hedged position may generate zero P&L. Conversely, correct volatility forecasts generate profits regardless of direction.[²⁶]
Implementation requirements:
Implied versus realized volatility forecasting models
Volatility surface modeling across strikes and tenors
Event-driven volatility prediction (earnings, regulatory announcements, macro shocks)
Term structure analysis for multi-month volatility forecasts
Principle #2: Financing is Non-Optional in Strategy Design
The strategy is fundamentally funding-sensitive. Carry from coupons and short rebates must exceed repo costs and borrow fees.[¹⁷] The 2020–2021 period proved this: zero rates eliminated carry even when pricing inefficiencies existed.
Complete funding stack modeling:
Repo rates (collateral-quality dependent)
Short rebates (stock-specific, time-varying)
Margin haircuts (volatility-sensitive)
Opportunity cost of capital
Prime brokerage relationship terms
Strategies appearing attractive on spread analysis alone frequently fail after financing costs.
Principle #3: Primary Market Access Creates Structural Alpha
Access to new convertible issuance at favorable pricing requires:
Sufficient AUM to matter to underwriters
Investment banking relationships
Rapid capital deployment capability
Credit underwriting infrastructure for day-one decisions
Scaling implications: Smaller managers should focus on secondary market inefficiencies where analytical sophistication can uncover mispricing. Larger funds must build primary market relationships as a moat.
Principle #4: Corporate Actions Drive Non-Linear Returns
LMR’s success derived partly from “pickup in corporate actions.”[¹] Events like buybacks, M&A, forced conversions, and dividend changes create value transfers that pure volatility models miss.
Integration requirements:
Management commentary analysis (earnings calls, 8-Ks)
M&A rumor monitoring and probability assignment
Call option exercise modeling based on issuer incentives
Forced conversion timing prediction
Capital allocation pattern recognition by management team
Principle #5: Gamma Capture Has Execution Costs
Positive gamma means rebalancing profits in volatile markets. But high gamma requires:
Frequent monitoring (sometimes intraday)
Transaction costs accumulating with each trade
Operational complexity across hundreds of positions
Execution quality during volatile periods (wide spreads, thin liquidity)
Optimization framework: Build rebalancing strategies balancing theoretical gamma capture against practical implementation costs. Academic models assume frictionless trading; real P&L depends on execution infrastructure.
Part VII: The Historical Arc
Golden Age (Early 2000s)
Convertible arbitrage delivered 13.17% annual returns with 3.40% standard deviation from 1995–2004.[²⁷] The strategy promised arbitrage-like returns with market-neutral characteristics. Capital flooded in.
Warning (2004–2005)
Hedge fund ownership reached 80–85% of new issues.[⁵] GM credit downgrades in 2005 triggered ~8% losses as arbitrageurs were simultaneously long credit (bonds) and short equity.[⁵]
Collapse (2008)
34% losses destroyed funds and careers.[²⁴] Survivors reduced leverage dramatically. Institutional allocators fled. Long-only investors dominated the space for a decade.
Wilderness (2010–2021)
Low volatility and thin mispricings made the strategy marginal. Even the 2020–2021 post-COVID issuance surge provided little opportunity — deals came at rich valuations absorbed by price-insensitive long-only buyers.[⁵]
Resurrection (2023–2025)
2023: HFR index +10.1%[⁵] 2024: “Best annual returns in recent memory”[⁵] 2025: Top managers like LMR delivering 30%[¹]
Returns came “from core convert-arb mechanics working again across many deals,” with funds “extracting value from underpriced convertible options and improved carry” while maintaining near-zero equity beta.[⁵]
Part VIII: Forward Outlook
Structural Tailwinds
Refinancing wave: Industry estimates place $65–71 billion (estimate range) of pandemic-era convertibles maturing by end-2026.[³][⁴] Companies unable to refinance from cash flow will issue new convertibles, sustaining deal flow.
Persistent volatility: Political uncertainty, trade policy unpredictability, and monetary policy debates likely maintain elevated implied volatility — the fuel for gamma strategies.
Improved market structure: Hedge fund ownership at ~45% (down from 75% pre-crisis) reduces forced-selling risk even during stress.[²⁵]
Countervailing Risks
Credit deterioration: Significant recent issuance from speculative-grade entities. Economic downturns could trigger defaults. Convertibles often lack covenants, enabling sudden repricing on credit concerns.[⁵]
Strategy crowding: Strong 2023–2025 returns attract capital. More funds competing for similar trades compresses spreads and reduces opportunity.
Rate uncertainty: If rates decline significantly, short rebate advantage diminishes. If rates spike too quickly, leveraged issuers face stress.
Volatility normalization: If VIX reverts to 2010s levels (consistently sub-15), gamma opportunities decline sharply.
Base Case: 2026 Expectations
Most probable scenario: continued opportunity with compressed returns versus the exceptional 2024–2025 period.
Expected ranges:
Convertible arbitrage indices: 6–9% (mid-to-high single digits)
Top-tier managers: 10–15% (low double digits)
Exceptional performers: 20%+
These represent excellent risk-adjusted returns for market-neutral strategies, though not the extraordinary 30%+ LMR achieved during 2025’s convergent conditions.
Conclusion: Dissecting the P&L
LMR Partners’ 30% return resulted from factor convergence:
Market structure: Record issuance driven by refinancing requirements intersected with April tariff shock creating both abundant opportunities and extreme volatility to harvest.
Operational infrastructure: Multi-year experience, scale for primary market access, geographic positioning for continuous monitoring, integration within diversified multi-strategy platform.
Systematic execution: Exploitation of four distinct profit sources — gamma trading, volatility repricing, credit carry, corporate actions — while maintaining disciplined risk management and low market beta.
Strategic positioning: Pre-positioning before the volatility event, enabling rebalancing of existing positions rather than chasing entries at compressed spreads.
The returns weren’t luck. They represented systematic application of option theory, credit analysis, financing optimization, and risk management — deployed in an environment that rewarded precisely these competencies.
Key takeaways for strategy development:
Volatility forecasting matters more than price prediction for relative-value strategies
Financing economics determine viability independent of theoretical edge
Primary market access creates structural advantages at sufficient scale
Corporate action integration adds uncorrelated alpha to volatility strategies
Risk management separates survivors from casualties during inevitable tail events
The opportunity persists. With $65–71 billion of maturities approaching and continued market uncertainty, arbitrageurs with appropriate infrastructure, risk frameworks, and quantitative capabilities will continue extracting alpha.
Positioning requires answering: Can you forecast volatility accurately? Model financing completely? Access primary deals? Integrate corporate actions? Execute under stress?
The 30% return validated a strategy resurrected from near-extinction. The question is whether your infrastructure can capture what comes next.
Sources & Citations
[¹]: Bloomberg. (October 30, 2025). “Convertible Bond Boom Delivers Hedge Fund LMR’s Traders 30% Gain.”
[²]: Numerix. (2025). “Convertible Bond Market Boom: What’s Driving the Record Growth?” Q2 2025 Issuance Report.
[³]: White & Case Debt Explorer. (2025). “Convertible bond boom opens window of opportunity for issuers.”
[⁴]: Reuters. (September 29, 2025). “Convertible bond deals surge to five-year high as firms refinance.”
[⁵]: Resonanz Capital. (July 17, 2025). “Convertible Arbitrage: The 2023–2025 Comeback.”
[⁶]: Janus Henderson Investors. (August 28, 2024). “Is convertible arbitrage making a comeback in liquid alternative portfolios?”
[⁷]: Investing.com. (September 30, 2025). “Convertible bond deals surge to five-year high as firms hunt cheaper capital.”
[⁸]: Investing.com / Yahoo Finance. (June 2, 2025). “Tariffs, turmoil, and the VIX: How April 2025 compares to past crises?”
[⁹]: Macroption. (2025). “VIX All-Time Highs and Biggest Spikes.” Historical data; FRED St. Louis Fed for daily closes.
[¹⁰]: MacKay Shields / New York Life Investments. (April 16, 2025). “Convertibles 2Q25 Outlook.” Market drawdown analysis.
[¹¹]: MacKay Shields / New York Life Investments. (April 16, 2025). “Convertibles 2Q25 Outlook.” ICE BofA Index performance.
[¹²]: Numerix. (2025). “Global Convertibles: Key Trends and Insights Q2 2025.” White paper on financing and market dynamics.
[¹³]: Wikipedia. (March 4, 2025). “Convertible arbitrage.” Cites academic research on gamma profitability.
[¹⁴]: Calamos Investments. (2024). “Convertible Arbitrage 101.” Educational materials on gamma trading mechanics.
[¹⁵]: Calamos Investments. (2024). “Convertible Arbitrage 101.” Direct quote on gamma trading opportunities.
[¹⁶]: Yurek, Chris. “Hedge Fund Returns: A Study of Convertible Arbitrage.” NYU Stern School of Business.
[¹⁷]: Medium — A-STAR7_DOCTOR. (October 2025). “Capital Structure & Convertible Arbitrage.”
[¹⁸]: The Hedge Fund Journal. (2024). “LMR Partners: 15 Years of Differentiated Multi-Strategy Alpha.”
[¹⁹]: Private Banking International. (November 16, 2022). “Hedge fund LMR Partners to set up office in Dubai.”
[²⁰]: LMR Partners. (2025). “Approach.” Corporate website.
[²¹]: Bloomberg. (August 27, 2025). “A Niche Arbitrage Trade Is Gaining Traction Among Hedge Funds.”
[²²]: Hedgeweek. (June 3, 2024). “Hedge funds up convertible arbitrage exposure.”
[²³]: HedgeNordic. (October 19, 2025). “Record Month for Tidan in Priced-to-Perfection Credit Market.”
[²⁴]: Mitchell, Mark and Pulvino, Todd. (2012). “Arbitrage Crashes and the Speed of Capital.” Journal of Financial Economics.
[²⁵]: Man Group. (2019). “Convertible Arbitrage’s Quiet Evolution: A Fit and Leaner Strategy for Volatile Markets.”
[²⁶]: Mergers & Inquisitions. (December 30, 2024). “Convertible Arbitrage Hedge Funds: Full Guide.”
[²⁷]: Yurek, Chris. NYU Stern. “Hedge Fund Returns: A Study of Convertible Arbitrage.” Historical performance data 1995–2004.
Disclosure: This analysis is for educational purposes and does not constitute investment advice. The author has no position in LMR Partners or convertible arbitrage funds discussed. Performance data cited from public sources; past performance does not guarantee future results.
About the Series: Deep-dive case studies on real hedge fund trades, focusing on one question: How did this trade make money — and what can we learn from it?
Cover photograph: Bear Bull Traders, CC BY 2.0, via Wikimedia Commons.
Well done on this write-up. Very useful